감나무 생육 및 과실 특성의 연차 변이에 대한 주요 기온 요인 추출
전경수1·김호철2·한점화3·김태춘2*
1원광대학교 환경조경학과, 2원광대학교 원예·애완동식물학부, 3국립원예특작과학원
Selection of Main Air Temperature Factors on Annual Variation of Growth and Fruit Characteristics of Persimmon
Kyung Soo Jeon1, Ho Cheol Kim2, Jeom Hwa Han3, and Tae-Choon Kim2*
1Department of Environment Landscape Architecture, Wonkwang University, Iksan 570-749, Korea
2Division of Horticulture and Pet Animal-Plant Science, Wonkwang University, Iksan 570-749, Korea
3National Institute of Horticultural & Herbal Science, Suwon 441-440, Korea
Abstract. This experiment was conducted to select the affected main factors on growth and fruit charac- teristics of 'Fuyu' persimmon (Diospyros kaki Thunb.) in 25 factors of air temperature factors in Naju. Mean air temperature, cumulative temperature and days for March and April of 25 factors were the highest annual variation. Number of the first and second principal components extracted from 25 air temperature factors were 14 and 3 factors related with mean temperature for annul and April, and cumulative contribution of these was 52.2%. Also the affected years by the first principal components were 1990, 1980 and 1986.
Annual standard deviation on leafing, flowering and maturing date were 4.0~6.7 days range, and flowering date and days from leafing to flowering had the highest coefficient of variation. Annual variation of days from flowering to maturing date was affected by greatly mean air temperature and days of cumulative tem- perature in October, days from March 1 to leafing date was affected by cumulative temperature for growing period, days from leafing to flowering date was affected by mean air temperature in April. Annual variation of fruit weight was affected by mean air temperature for March and October.
Key words : air temperature factors, annual variation, fruit characteristics, persimmon
서 론
기상 환경 변화는 노지 형태로 재배되고 있는 과수 에 있어 생장 및 발육에 직접적인 영향을 주는 요인 이다. 우리나라는 지난 100년 간 평균 1.8oC 정도 상 승하였는데(Choi와 Kwon, 2005; Yun, 2002), 겨울철 기온 상승에 따라 작물의 적정 재배 지역이 변화하고 있다(Yun 등, 2001; Yun과 Lee, 2001). 특히, 잦은 기온 변화로 인하여 수체 생장 및 발육에 많은 문제 점을 발생시키고 있다(Yun, 2002). 감나무는 다른 낙 엽과수와 마찬가지로 생육에 있어 온도의 영향을 크게 받으며 광합성의 최적온도는 20oC 정도로 알려져 있
고(Amano 등, 1972), 발아 시기에는 온도의 영향이 가장 크고 그 시기의 온도 수준에 따라 저온 민감성 도 차이를 나타내는 것으로 보고되었다(Kang 등, 1998). Sugiura 등(1991)은 단감 ‘부유’의 과실 비대 는 생장 제 1기, 과실 무게는 제 3기에 크게 증가하 는데, 그 시기의 온도 수준에 따라 차이를 나타내어 온도가 낮을 경우 과실 생장 제 2기가 짧아지면서 전 체 생육 기간이 단축된다고 보고하였다. 작물의 생육에 있어 환경 요인의 영향이 크다는 것은 이미 인식되어 왔으나 대부분 과원의 토양 환경(Jung 등, 1994;
Kim 등, 1995)에 치중되어 왔고, 기상 환경 부분에서 는 한정된 품종에 대한 내동성 연구가 대부분을 차지 하는 등 다양한 연구가 진행되지 못하였다. 이에 감 생산 농가에서는 이상 기후에 따른 다양한 피해가 나 타나고 있어 재배지의 국지 기상 환경과 수체 생육에
*Corresponding author: [email protected]
*Received September 2, 2010; Revised September 14, 2010;
*Accepted September 24, 2010
대한 데이터의 수집 및 누적화가 반드시 필요하고 이 들 간 관계성을 밝히려는 노력이 필요하다.
따라서 본 연구는 전남 나주에 소재한 국립원예특작 과학원 배연구소의 단감 ‘부유’의 생육 자료 및 광주 지역의 기상청 자료를 이용하여 감의 생육 및 과실 특성의 연차 변이에 대한 주요 기온 요인을 알아보고 자 수행하였다.
재료 및 방법
광주 지역 기온은 1980년부터 1995년까지 광주 기 상관측소의 기온 자료를 3월~10월의 평균기온(X1~X8) 및 적산온도(X9~X16), 3월, 4월 및 10월의 적산일수 (X17~X19), 연평균기온(X20), 연평균최저기온(X21), 연평균적산온도(X22), 온량지수(X23), 생육기 동안의 적산온도(X24) 및 적산일수(X25) 등 25개 요인으로 세분류하였고, 주요 요인들을 평균, 편차 및 변이계수 로 나타내었다. 단감 ‘부유’의 생육 및 과실 특성은 1980년부터 1995년까지 전남 나주 지역에서 재배되고
있는 단감 ‘부유’를 대상으로 국립원예특작과학원 배연 구소의 전엽기, 개화기 및 성숙기에 대한 자료를 기초 로 하여 생육 단계별 조만과 일수, 과중, 종자수, 당도, 경도를 평균, 표준편차 및 변이계수로 나타내었다. 조 사 기간 동안 25개 기온요인 중 주요 변인을 추출하 기 위해 주성분 분석을 수행하였고, 주성분 점수 (component score)를 이용하여 추출된 제1 및 2 주성 분을 X 및 Y축 좌표평면에 나타내어 연도별 추출된 기온 요인의 영향력을 분석하였다. 단감 ‘부유’의 생육 및 과실 특성의 연차 변이에 크게 관여한 기온 요인 을 추출하고자 각 특성에 대한 25개 기온요인을 이용 하여 단계적 다중회귀분석을 수행하였다. 주성분 및 다 중회귀 분석은 SPSS 11.0 통계패키지를 이용하였다.
결과 및 고찰
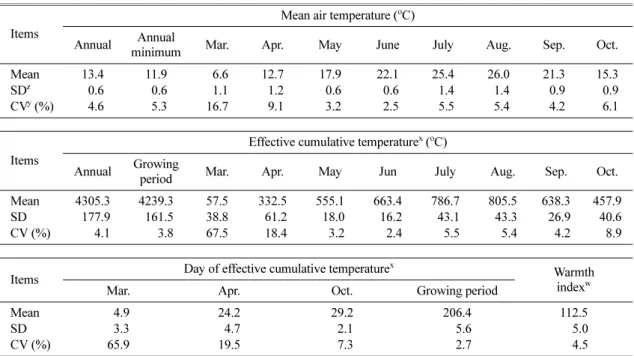
1980년에서 1995년까지 광주 지역의 주요 기온요인을 분석한 결과(Table 1), 연 평균기온 및 평균최저기온은 각각 13.4oC와 11.9oC로 조사 기간 동안 연차변이가 아
Table 1. Annual variation of 25 factors of air temperature for growing period (from April 1 to October 31) in Gwangju (Gwangju Regional Meteorological Administration, 1980~1995).
Items
Mean air temperature (oC) Annual Annual
minimum Mar. Apr. May June July Aug. Sep. Oct.
Mean 13.4 11.9 06.6 12.7 17.9 22.1 25.4 26.0 21.3 15.3
SDz 00.6 00.6 01.1 01.2 00.6 00.6 01.4 01.4 00.9 00.9
CVy (%) 04.6 05.3 16.7 09.1 03.2 02.5 05.5 05.4 04.2 06.1
Items
Effective cumulative temperaturex (oC) Annual Growing
period Mar. Apr. May Jun July Aug. Sep. Oct.
Mean 4305.3 4239.3 57.5 332.5 555.1 663.4 786.7 805.5 638.3 457.9 SD 0177.9 0161.5 38.8 061.2 018.0 016.2 043.1 043.3 026.9 040.6 CV (%) 0004.1 0003.8 67.5 018.4 003.2 002.4 005.5 005.4 004.2 008.9
Items Day of effective cumulative temperaturex Warmth indexw
Mar. Apr. Oct. Growing period
Mean 04.9 24.2 29.2 206.4 112.5
SD 03.3 04.7 02.1 005.6 005.0
CV (%) 65.9 19.5 07.3 002.7 004.5
zStandard deviation (n = 16).
yCoefficient of variation.
xΣ(Temperature level and days over 10oC) in daily mean air temperature from March to October.
wΣ[(monthly mean air temperature over 5oC)− 5oC] for year.
주 적었다. 3월 평균기온은 6.6oC, 편차는 1.1oC였고 변 이계수 16.7%로 가장 높게 나타났다. 전엽기인 4월 평 균기온은 12.9oC, 편차는 1.2oC이었으며 변이계수 9.1%
로 나타났다. 개화기인 5월과 유과기인 6월 평균기온은 다른 월에 비해 편차가 작고 변이계수도 낮았다. 7월과 8월의 평균기온은 25~26oC로 편차가 가장 컸으나 변이 계수가 3월 및 4월보다 낮았다. 9월 평균기온은 21.3oC 이었고 과실 착색기인 10월에는 평균기온은 15.3oC로 9 월에 비해 6oC 정도가 떨어졌다. 3월에서 10월까지의 적산온도에는 과실 비대 및 착색기인 9월 및 10월보다 전엽 전후 시기인 3월에서 4월 동안 적산온도의 변이정 도가 다소 크게 영향을 주었다. 특히, 3월에서 10월까지 의 적산일수에는 3월에서 4월 동안 적산일수의 변이정도 가 크게 영향을 미쳤다. 이러한 결과는 3월 및 4월 평 균기온의 변이 정도가 크고(Table 1), 그 시기 기온의 하강 및 상승한 날이 잦았던 것으로 생각된다.
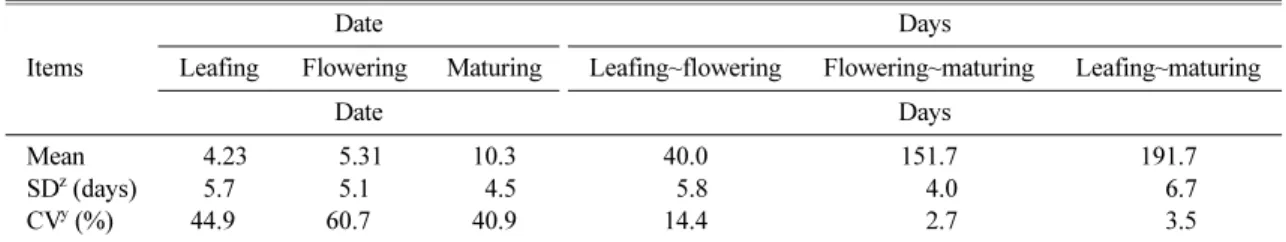
1980년에서 1995년까지 나주 지역 과원의 단감 ‘부 유’의 생육 특성을 분석한 결과(Table 2), 전엽일은 평균 4월 23일이었고 편차는 5.7일로 변이계수는 44.9%이었다. 개화일은 평균 5월 31일이었고 편차는 5.1일로 변이계수는 60.7%로 전엽일과 마찬가지로 아 주 컸다. 과실 성숙일은 평균 10월 30일이었고 편차 는 4.5일로 변이계수는 40.9%로 다소 높았다. 전엽일 이나 개화일의 큰 연차 변이는 연도 간 3월 및 4월 기온의 기온 차이가 컸기 때문으로 생각된다(Table 1).
그리고 감나무의 전엽이나 개화 시기는 월동 이후 조 기 기온 상승에 따라 앞당겨진다고 보고된 연구 결과 (Fitter와 fitter, 2002; Lu 등, 2006)를 고려하면 이러 한 3월 및 4월 기온의 연차 변이가 큰 것은 연차 간 월동 후 온도 상승 시기의 조만에서 온 것으로 생각 된다. 그리고 전엽일에서 과실 성숙일까지의 생육 일수
에 대하여 전엽일에서 개화일까지의 일수의 영향이 큰 것으로 나타났다. 따라서 과실의 수확 시기에는 3월 및 4월의 기온 요인이 크게 관여할 것으로 생각된다.
1980년에서 1995년까지 나주 지역 과원의 단감 ‘부 유’의 과실 특성을 분석한 결과(Table 3), 과중은 평 균 194.0g이었고 편차는 15.7g, 그리고 변이계수는 8.1%였다. 과실 당도는 평균 14.5oBrix였고 편차는 1.1oBrix, 그리고 변이계수는 7.5%로 과실 특성 중 연 차 변이가 가장 낮았다. 종자수는 평균 4.0개였고, 편 차는 1.3개, 그리고 변이계수는 32.8%로 다른 특성에 비해 연차 변이가 아주 컸다. 과실 경도는 평균 2.7kg/Ø1mm이었고 편차는 0.4kg/Ø1mm, 그리고 변이 계수는 17.3%였다. 과중 및 당도는 생육 단계별 기온 및 성숙기 기온의 영향을 크게 받는 것으로 알려져 있는데(Bergh, 1990; Tromp, 1997; Beruter, 1985;
Song, 1999; Yamaki와 Ishikawa, 1986), 과중은 과 실 비대기인 7월과 8월 평균기온의 변이가 착과 후 생육 기간 동안 다른 시기에 비해 연차 변이가 컸던 것을 고려하면(Table 1) 이러한 변이 정도는 이 시기 의 영향을 받았을 것으로 생각된다. 하지만 당도는 9 월 및 10월 평균기온과 그 변이정도, 그리고 당도는 Table 2. Annual variation of date and days of growth stage of ‘Fuyu’ persimmon in Naju (Pear experiment station in NHRI,
1980~1995).
Items
Date Days
Leafing Flowering Maturing Leafing~flowering Flowering~maturing Leafing~maturing
Date Days
Mean 04.23 05.31 10.3 40.0 151.7 191.7
SDz (days) 5.7 5.1 04.5 05.8 004.0 006.7
CVy (%) 44.90 60.70 40.9 14.4 002.7 003.5
zStandard deviation.
yCoefficient of variation.
Table 3. Annual variation of fruit characteristics of ‘Fuyu’
persimmon in Naju (Pear experiment station in NHRI, 1980~1995).
Items
Fruit characteristics Weight
(g)
Soluble solid (oBrix)
No. of seeds
Hardness (kg/Ø1mm) Mean 194.0 14.5 04.0 02.7
SDz 015.7 01.1 01.3 00.5
CVy (%) 008.1 07.5 32.8 17.3
zStandard deviation.
yCoefficient of variation.
생육 과정 중에는 온도의 영향을 받으나 최종 성숙과 에서는 영향을 받지 않는다는 Sugiura 등(1991)의 연 구결과를 고려하면 당도의 연차 변이에는 조사자의 측 정 기준 차이에서 온 것으로 생각된다.
Table 1의 기온 요인을 포함하여 25개 요인으로 분 류한 후 주성분 추출 방법을 이용하여 분석하여 주요 변이 요인을 추출하였다(Table 4). 제1주성분에는 연 평균기온, 연 평균최저기온, 연 평균적산온도, 온량지수, 그리고 7월 이후 평균기온 및 적산온도 등 14개 요인 이 크게 영향을 주었고, 고유치가 8.63, 기여율이 34.6%로 영향력이 다소 컸다. 제2주성분에는 4월의 기온요인 3개가 크게 영향을 주었고, 고유치가 4.89, 기여율이 17.6%였다. 이에 따라 제2주성분까지의 누적 기여율은 50% 이상을 나타내었고, 제5주성분까지는
89.3%를 나타내었다.
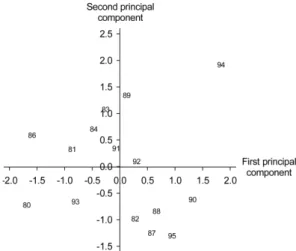
제1과 2주성분을 x축과 y축으로 하여 연도별 주성 분 점수(component score)를 좌표평면에 나타내어 제 1과 2주성분의 영향을 크게 받은 연도를 추출하였다 (Fig. 1). 제1주성분에 양(+)의 영향력을 크게 받은 연 도는 1990년, 음(−)의 영향력을 크게 받은 연도는 1980년과 1986년으로 나타났다. 이에 본 재배 연도는 다른 연도와 연 평균기온, 연 평균최저기온, 10월 적 산온도의 차이가 컸던 것으로 생각된다. 제2주성분에 양(+)의 영향력을 크게 받은 연도는 1983년과 1989년 이었고, 음(−)의 영향력을 크게 받은 연도는 1982년과 1987년으로 나타났다. 이에 본 재배 연도는 다른 연도 와 전엽기인 4월 기온의 차이가 컸을 것으로 생각된다.
조사 재배 연도 동안 과실 특성의 연차 변이에 대 한 생육 단계별 일수의 영향을 분석한 결과에서는 요 인이 전혀 추출되지 않았다(자료 미제시).
조사 재배 연도 동안 생육 단계별 일수 및 과실 특 성에 영향을 크게 미친 주요 기온 요인을 추출하고자 다중회귀분석을 실시하였다(Table 5). 개화일에서 과실 성숙일까지의 일수는 10월 적산일수(X19)에 영향을 가 장 크게 받았고, 다음으로 10월 평균기온(X8)의 영향 을 크게 받았는데 이 두 요인에 의한 영향력은 62.6%
(r2= 0.626)이었다. 3월 1일에서 전엽일까지의 일수는 생육기 적산온도(X24)의 영향을 받았고 그 영향력은 42.6%(r2= 0.426)이었다. 그리고 전엽일에서 개화일까 Table 4. Rotated component matrix, eigenvalues, and cumula-
tive percentage extracted by principal components analy- sis with 25 air temperature factors in Gwangju.
Air temperature
factors PC 1 PC 2 PC 3 PC 4 PC 5 X21 0.89 −0.03 −0.06 −0.26 0.13 X16 0.89 −0.17 0.15 0.02 0.25 X20 0.89 0.28 0.14 −0.06 0.11 X22 0.88 0.36 0.27 0.03 0.11 X23 0.80 0.37 0.13 0.31 0.14 X8 0.80 −0.32 0.01 0.08 0.36 X19 0.77 0.13 0.30 −0.06 0.03 X24 0.77 0.49 0.30 0.25 0.07 X14 0.72 0.32 0.19 0.33 −0.14 X6 0.72 0.33 0.19 0.33 −0.14 X13 0.70 0.44 −0.11 0.23 −0.37 X5 0.70 0.44 −0.11 0.24 −0.37 X15 0.56 0.34 0.49 0.08 0.28 X7 0.56 0.33 0.50 0.08 0.27 X10 0.22 0.94 −0.06 −0.08 0.12 X2 0.24 0.93 −0.08 −0.06 0.19 X18 0.09 0.82 0.37 0.00 0.24 X17 0.13 0.02 0.95 0.04 −0.13 X9 0.16 0.02 0.95 0.03 −0.17 X1 0.03 −0.20 0.85 −0.35 −0.15 X25 0.36 0.50 0.75 0.00 0.08 X4 0.08 −0.07 −0.06 0.96 0.12 X12 0.08 −0.05 −0.06 0.96 0.13 X3 0.14 0.25 −0.16 0.15 0.88 X11 0.16 0.24 −0.17 0.15 0.88 Eigenvalues 8.63 4.89 4.19 2.61 2.50 Variance (%) 34.55 17.55 16.75 10.44 9.88 Cumulative (%) 34.55 52.11 68.85 79.30 89.28
Fig. 1. Scatter diagram on the first and the second principal component axes by component scores of air temperature factors by cultivating year in Gwangju. Each number is the cultivating year.
지의 일수도 4월 평균기온(X2)에 영향을 받았고 그 영향력은 44.2%(r2= 0.442)이었다. 따라서 생육기 동 안 일 평균기온이 높고 그 일수가 많은 해에는 전엽 이 빨라지는데 특히, 4월 평균기온이 높으면 개화까지 도 더욱 빨라지는 경향으로 나타났다(Fitter와 Fitter, 2002; Lu 등, 2006). 그리고 개화 이후 과실 비대기 나 과실 착색기에 기온이 높으면 과실 숙기가 다소 늦어지는 경향을 나타내었는데(Tromp, 1997), 전체 성 숙 일수는 전엽일의 조만에 따를 것으로 생각된다. 이 결과는 생육 초기의 기온이 중기나 말기보다 생육 일 수에 더 큰 영향을 준다(Eggert, 1960; Lombard 등, 1971)는 연구 결과와 일치하나 생육 초기에 저온에 의 한 생육 기간의 단축(Sugiura 등, 1991), 저온요구도 부족의 영향(Oh와 Klinac 2003) 등의 연구 결과를 고려하면 더욱 세밀한 관계 분석이 필요할 것으로 생 각된다. 과중은 3월 평균기온(X1)에 가장 큰 영향을 받았고, 다음으로 10월 평균기온(X8)에 영향을 받았는 데 이 두 요인의 영향력은 68.0%(r2= 0.680)로 나타 났다. 3월 평균기온은 다른 요인에 비해 연차 변이가 아주 컸고(Table 1), 이러한 영향이 월동 후 기온 상 승의 조만 및 전엽일에 영향을, 10월 평균기온은 착과 이후 기온 요인 중 연차 변이가 컸고(Table 1) 또한
‘부유’ 품종의 후기 과실비대가 일어나는 시기이기 때 문에 추출된 것으로 생각된다. 과중을 제외한 다른 과 실 특성에서는 연차 변이에 유의한 영향을 준 기온 요인이 추출되지 않았다. 특히, Table 3에서 종자수는 과중보다 아주 큰 연차 변이를 나타내었음에도 불구하 고 기온 요인이 추출되지 않은 것으로 보아 기온의 영향보다는 개화기의 강우나 바람 등에 따른 수분 정 도 차이에서 온 것으로 생각된다(Yabada 등, 1987).
적 요
본 연구는 감나무 생육 및 과실 특성의 연차 변이
에 대한 주요 기온 요인을 알아보고자 수행하였다. 연 차 변이는 3월과 4월의 평균기온, 적산일수 및 적산온 도에서 가장 컸다. 25개 기온 요인 중 제1주성분으로 는 연 평균 기온 요인들 14개, 제2주성분으로는 4월 기온요인들 3개로 추출되었으며 그 누적 기여율은 52.2%이었다. 제1주성분에 양의 영향력을 크게 받은 연도는 1990년, 음의 영향력을 크게 받은 연도는 1980년과 1986년으로 나타났다. 감나무의 전엽일, 개 화일 및 과실 성숙일의 연간 편차는 4.0~6.7일 범위였 으며 변이계수는 개화일, 전엽일에서 개화일까지의 일 수가 가장 컸다. 그리고 과실 특성 중 과중, 당도, 경 도는 연차 변이가 적었으나, 종자수는 평균 4.0개, 연 간 편차 1.3개, 변이계수가 32.8로 연차 변이가 가장 컸다. 감나무 생육 및 과실 특성과 기온 요인들 간 다중회귀분석 결과, 개화일에서 과실 성숙일까지의 일 수는 10월의 평균기온 및 적산일수, 전엽일에서 개화 일까지의 일수는 4월 평균기온, 과중은 3월 평균기온 과 10월 평균기온의 영향을 가장 크게 받은 것으로 나타났다.
주제어 : 감, 기온 요인, 과실특성, 연차변이
사 사
이 논문은 2008년도 원광대학교의 교비지원에 의해 서 수행됨.
인 용 문 헌
1. Amano, S., A. Hino, H. Daito, and T. Turaoka. 1972.
Studies on photosynthetic activity in several kinds of fruit tree. I. Effect of some environmental factors on the rate of photosynthesis. J. Japan. Soc. Hort. Sci. 41:
144-150.
2. Bergh, O. 1990. Effect of temperature during the first 42 days following full bloom on apple fruit growth Table 5. Air temperature factors extracted by multiple regression analysis on days of growth stage and fruit weight of ‘Fuyu’
persimmon.
Growth characteristics R2 Sig. Regression equation
From flowering to maturing date 0.626 0.001 251.62− 2.481X19 + 3.775X8 From March 1 to leafing date 0.426 0.008 175.01− 0.028 X24
From leafing to flowering date 0.442 0.007 143.63− 3.996 X2
Fruit weight 0.680 0.005 122.34 + 8.83X1 + 12.96X8− 13.79X20
and size at harvest. South African J. Plant Soil 7:11- 18.
3. Beruter, J. 1985. Sugar accumulation and change in the activities related enzymes during development of apple fruit. J. Plant Physiol. 121:331-341.
4. Choi, Y.E. and W.T. Kwon. 2005. Climate change studies in geography: Reviews and prospects. J. Kor.
Meteor. Soc. 41:249-262.
5. Eggert, F.G. 1960. The relation between heat unit accu- mulation and length of time required to mature McIn- tosh apples in Maine. Proc. Amer. Soc. Hort. Sci.
76:98-105.
6. Fitter, A.H., R.S.R. Fitter, 2002. Rapid changes in flowering time in British plants. Science 296:1689- 1691.
7. Jung, S.J., C.S. Park, D.C. Noh, Y.K. Jo, J.D. So, and Y.T. Jung. 1994. Soil property criteria for apple orchard soil in terms of land characteristics. RDA. J.
Agri. Sci. 36(2):241-245.
8. Kang, S.K., H. Motosugi, K. Yonemori, and A. Sug- iura. 1998. Freezing injury to persimmons (Diospyros kaki Thunb.) and four other Diospyros species during deacclimation in the spring as related to bud develop- ment. Scientia Horticulturae 77:33-43.
9. Kim, J.K., Y.T. Jung, I.S. Son, and E.S. Yun. 1995.
Physiography and soil characteristics of the apple orchards in chief producing localities in Yeongnam area. RDA. J. Agri. Sci. 37(2):239-245.
10. Lombard, P.B., C.B. Cordy, and E. Hansen. 1971.
Relation of post-bloom temperature to ‘Bartlett’ pear maturation. J. Amer. Soc. Hort. Sci. 96:799-801.
11. Lu, P., Q. Yu, J. Liu, and X. Lee. 2006. Advance of tree-flowering dates in response to urban climate
change. Kor. J. Agri. Forest Meteorol. 138:120-131.
12. Oh, S.D. and D. Klinac. 2003. Relationship between incidence of floral bud death and temperature fluctua- tion during Winter in Japanese pear (Pyrus pyrifolia cv. Hosui) under New Zealand climate conditions. J.
Kor. Soc. Hort. Sci. 44(2):162-166.
13. Sugiura, A., G.H. Zheng, and K. Yonemori. 1991.
Growth and ripening of persimmon fruit at controlled temperatures during growth stage III. HortScience 26(5):574-576.
14. Tromp, J. 1997. Maturity of apple cv. Elstar as affected by temperature during a six-week period following bloom. J. Hort. Sci. 72:811-819.
15. Yabada, M., A. Kurihara, and T. Sumi. 1987. Varietal differences in fruit bearing in Japanese persimmon (Diospyros kaki Thunb.) and their yearly fluctuations.
J. Japan. Soc. Hort. Sci. 56:295-299.
16. Yamaki, S. and K. Ishikawa. 1986. Roles of four sorb- itol related enzyme and invertase in the seasonal alter- ation of sugar metabolism in apple tissue. J. Amer.
Soc. Hort. Sci. 111:134-137.
17. Yun, J.I. 2002. Urbanization effect on the observed warming in Korea during the recent half century. Kor.
J. Agri. Forest Meteorol. 4:58-63.
18. Yun, S.H. and J.T. Lee. 2001. Climate change impacts on optimum periods of rice plant and its countermea- sure in rice cultivation. Kor. J. Agri. Forest Meteorol.
3:55-70.
19. Yun, S.H., J.N. Im, J.T. Lee, K.M. Shin, and K.H.
Hwang. 2001. Climate change and coping with vulner- ability of agricultural productivity. Kor. J. Agri. Forest Meteorology 3(4):220-237.