Detection of Subsurface Defects in Metal Materials Using Infrared Thermography; Image Processing and Finite Element Modeling
Shrestha
Ranjit* and Won Tae Kim*
✝Abstract Infrared thermography is an emerging approach to non-contact, non-intrusive, and non-destructive inspection of various solid materials such as metals, composites, and semiconductors for industrial and research interests. In this study, data processing was applied to infrared thermography measurements to detect defects in metals that were widely used in industrial fields. When analyzing experimental data from infrared thermographic testing, raw images were often not appropriate. Thus, various data analysis methods were used at the pre-processing and processing levels in data processing programs for quantitative analysis of defect detection and characterization; these increased the infrared non-destructive testing capabilities since subtle defects signature became apparent. A 3D finite element simulation was performed to verify and analyze the data obtained from both the experiment and the image processing techniques.
Keywords: Non-destructive Testing, Infrared Thermography, Image Processing, Finite Element Simulation
[Received: January 21, 2014, Revised: March 29, 2014, Accepted: April 16, 2014] *Department of Mechanical Engineering, Kongju National University, Cheonan 330-717, Korea ✝Corresponding Author: [email protected]
ⓒ 2014, Korean Society for Nondestructive Testing
1. Introduction
Currently, the use of STS materials has been gradually extended to various application fields such as nuclear pipes, automobile, railroad, and building structure. Increased usage of STS ma- terials has led to an increased interest to the production processes including detection methods of subsurface defects.
Infrared thermography is a widely used non- contact, non-intrusive and non-destructive inspec- tion technique that can be used for the quan- titative determination of the sizes and locations of subsurface defects. Infrared thermography is gaining more acceptance as a fast non-contact and large area visualizing inspection technique primarily due to the recent advances in data acquisition and analysis systems. It utilizes an infrared camera to monitor and record the tem- perature variation over the viewed surface. The presence of a defect at a certain depth interferes with the heat flow causing local surface tempera-
ture variations or any other changes in the ther- mal properties of the materials. The changes in the heat flow cause localized energy differences on the surface of the test object, which can be measured using an infrared detector. The thermal signatures are then used to evaluate various flaws, including leaks, cracks, debonding, corro- sion, poor electrical wiring and contacts, and delamination [1-4]. The zones of interest (defects) appear sometimes as subtle signatures in the image obtained from the infrared camera. In this work, raw images are not often appropriate [5].
So for detection and characterization of sub-
surface defects, various data analysis methods
such as MATLAB and Lab View program were
used. The use of these methods has increased
the infrared non-destructive testing (NDT) cap-
abilities since subtle defects became more
apparent. 3D finite element simulation (ANSYS
program) was performed to verify and analyzed
the data obtained from both the experiment and
the image processing techniques.
where q is the rate of energy emission (W), A is the area of emitting surface (m
2), T is the absolute temperature (K),
is the Stefan-Boltzmann’s constant (
= 5.676*10
-8W/m
2K
4), and ε is the emissivity of the material.
Thermography can be broadly classified into two categories, viz. passive and active. In passive thermography no external heating is required. Only the thermal radiation due to difference in temperature between the surround- ing and specimen is monitored. The applications of passive thermography include monitoring of buildings and concrete structures, medical and biological investigations. On the other hand, in active thermography, an external heating is required and the evolution of surface tempera- ture is monitored in the transient or stationary domain. Depending on the heating procedure, active thermography can be further subdivided into different categories such as pulsed, step heating, lock-in, vibrothermography and pulsed phase thermography [6-14].
Heat diffusion through a solid is a complex 3D problem that can be described by the Fourier’s law of heat diffusion which is given by [7],
(2)
where α is the thermal diffusivity of the ma- terial being inspected.
For a planar semi-infinite specimen heated by a sinusoidal heat source of fixed amplitude
(4)
3. Data Processing Methodology 3.1 Sample and Experimental Set-up
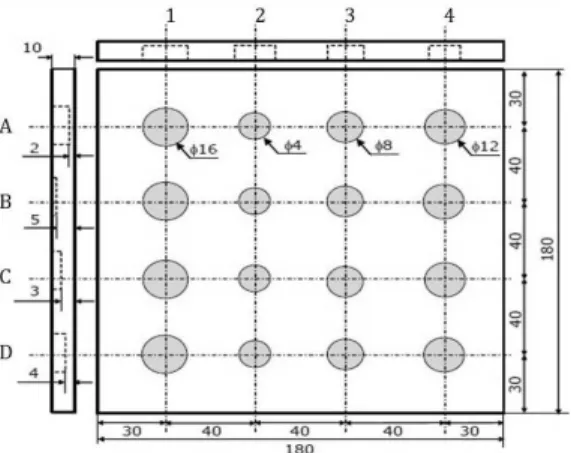
A square shaped (180 mm × 18 mm) speci- men of the stainless materials (STS 304) was used in the experiment. Artificial defects (flat bottom holes) of different depths and diameters were created at the back side of the specimen.
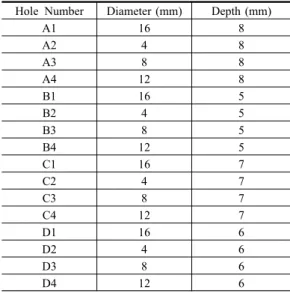
The schematic of the specimens with defect locations is shown in Fig. 1. The detailed geometrical descriptions of the defects in the specimens are provided in Table 1.
Table 1 Geometrical description of defects Hole Number Diameter (mm) Depth (mm)
A1 16 8
A2 4 8
A3 8 8
A4 12 8
B1 16 5
B2 4 5
B3 8 5
B4 12 5
C1 16 7
C2 4 7
C3 8 7
C4 12 7
D1 16 6
D2 4 6
D3 8 6
D4 12 6
Fig. 3 Procedure for data acquisition Fig. 1 Inclusion defect specimen of STS 304
Fig. 2 Experimental set-up for active thermography
For generation of sine waves of a single frequency, a programmable function generator, (Agilent 33210A, Malaysia) was used and for detection of thermal waves infrared camera (A655SC, FLIR Systems, Sweden) was used that has a 640×480 pixels resolution. 0.68 mrad IFOV and thermal sensitivity of 0.05 ℃. The sample was heated with a sinusoidally modulated heat wave from two, 1 kW halogen lamps (connected to the output of function generator) kept at 1000 mm away from the specimen. The camera was kept at a distance of 500 mm from the specimen in such a way that the axis of the camera coincides with the axis of the sample.
Reflection method was adopted, i.e., images were acquired from the same surface that was heated periodically. Images were acquired by using FLIR R&D software as shown in Fig. 2. The general procedure for the data acquisition is as shown in Fig. 3.
In thermography, temperature is interpreted from the radiation emitted from the surface under investigation. If the emissivity of the surface is very low, then the radiation emitted from this surface is very weak. Low emissivity surfaces also suffer from the problem of second- ary reflection, due to the presence of surround- ing bodies. The most common methodology to overcome the above mentioned emissivity prob- lems is by applying a uniform black paint of high emissivity value, which not only increases the surface emissivity value but also reduces the secondary reflections, besides providing a uni- formly emissive surface. So for the detection sensitivity, KRYLON flat black paint (emissivity 0.95) was applied to the surface of the specimen facing the camera in order to satisfy the conditions similar to the black body with an emissivity of 1, and the emissivity to be maintained at 0.95.
3.2 Numerical Model:
The physical model assumed 3D heat transfer
conditions within a homogeneous STS plate. The
thermal properties and geometrical param- eters
are defined for the FE-model. Boundary
conditions included the heat transfer by con-
duction on all samples boundaries. The initial
Fig. 4 Finite element model with meshing using ANSYS
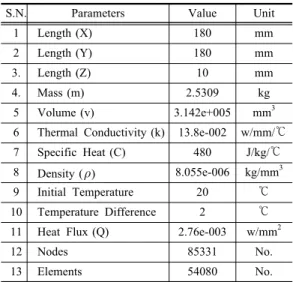
Table 2 General parameters of STS 304 sample
S.N. Parameters Value Unit
1 Length (X) 180 mm
2 Length (Y) 180 mm
3. Length (Z) 10 mm
4. Mass (m) 2.5309 kg
5 Volume (v) 3.142e+005 mm3 6 Thermal Conductivity (k) 13.8e-002 w/mm/℃
7 Specific Heat (C) 480 J/kg/℃
8 Density () 8.055e-006 kg/mm3
9 Initial Temperature 20 ℃
10 Temperature Difference 2 ℃ 11 Heat Flux (Q) 2.76e-003 w/mm2
12 Nodes 85331 No.
13 Elements 54080 No.
condition used in the model was taken to the room temperature as measured prior to the experiment. Assuming the temperature rise of 2 degree centigrade in the specimen, the total heat flux was calculated. Then the calculated heat flux and the initial temperature conditions were applied as the boundary condition for finding the surface temperature distribution on the specimen. The finite element model of the specimen is shown at Fig. 4. The general parameters and thermo-physical properties of the specimen are provided in Table 2.
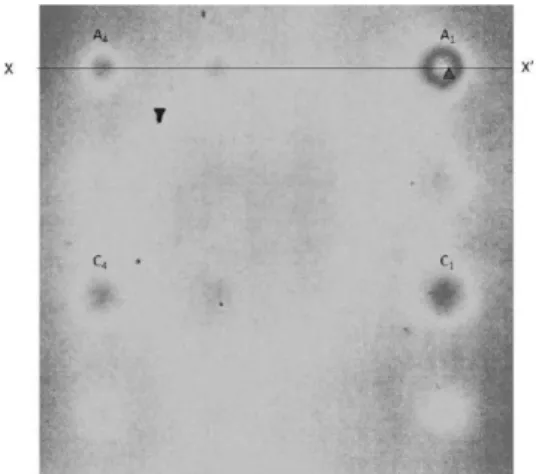
shows the experimental image taken at fre- quency of 10 mHz and Fig. 6 shows the temperature profile of path X-X’ of Fig. 5. It was observed that visible defective holes A
1, A
4, C
1, and C
4have the highest contrast. So it was found that the thermal contrast increases with the increased defects depth.
Image processing algorithm such as edge detection and thresholding as shown in Fig. 7, 8 and 9, were used for the raw image in MATLAB 7.10.0 (R2010a) environment. Edge detection algorithm was used for identifying and locating sharp discontinuities in an image. The dis- continuities are due to the abrupt changes in pixel intensity which characterize boundaries of objects in an image. It is also observed that Canny’s edge detection algorithm performs better. Thresholding algorithm was used for image segmentation, which separates the light and dark regions in the image. These binary images provide better insights in to the defect locations and the relative contrast corresponding to different defects. From Fig. 9, it was observed that defects A
1, A
4, C
1has the highest contrast as these were visible in the binary images even after the threshold level is set to 0.5. Such binary images may help in the development of automatic defect recognition algorithms for thermal images.
A finite element modeling scheme using
ANSYS is proposed to completely simulate the
active infrared thermography applied to STS
plate. With the assumption of steady state
Fig. 7 Edge detection using Canny function in MATLAB
Fig. 8 Edge detection using Shobel function in MATLAB
Fig. 9 Binary Image with threshold level 0.5 in MATLAB
Fig. 5 Original image at frequency 10 mHz
Fig. 6 Temperature profile along path X-X’ of Fig. 5
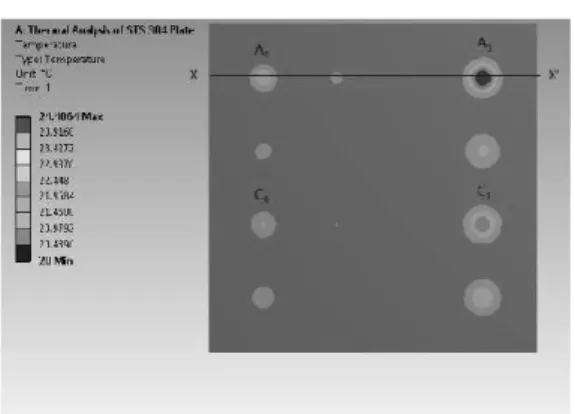
condition, boundary conditions included the heat transfer by conduction on all samples boundaries. The initial condition used in the model was taken at room temperature and was measured prior to the experiment. Assuming the temperature rise of 2 ℃ in the specimen, the total heat flux was calculated. Then the calculated heat flux and the initial temperature conditions were applied as the boundary con- dition for finding the surface temperature distribution on the specimen. Fig. 10 and Fig.
11 show the surface temperature distributions of STS 304 FE-model.
As per the experiment result as shown in
Fig. 5 and the finite element simulation results
from Fig. 10, it is found that the defects A
1and C
1with diameter 16 mm and defects depth
Fig. 11 Temperature profile along path X-X’ of Fig.
10