INTRODUCTION
Specific IgE (sIgE) identification is essential for the diagnosis and treatment of IgE-mediated allergic diseases, such as aller- gic rhinitis, asthma, atopic dermatitis, food and drug allergies, bee-sting allergy, and anaphylaxis. Allergen avoidance and de- cisions regarding allergen immunotherapy are based on sIgE
detection and corresponding symptoms. As the detection of sIgE indicates only sensitization, not an allergy itself, both the selection of test allergens and the interpretation of test results require highly sophisticated judgments. Moreover, when de- signing test panels, biogeographic characteristics and culinary culture should be considered.1,2 As well, clinicians should take into account the patient’s age, exposure history with relevant manifestations, and allergen cross-reactivity in making deci- sions regarding the causative allergen(s).3
Due to the diversity of sIgE detection methods, it is important to understand the characteristics (validity, reliability, strengths, and limitations) of each test.4 Serologic tests are more conve- nient than skin tests, since they do not require patients to stop medications. Also, in the case of anaphylaxis patients, there is no need to wait for recovery of histamine release capability af- ter a severe anaphylactic reaction. Serologic tests also involve no risk of recurrence of allergic reactions due to testing. More- over, there are no concerns regarding variability associated with
Comparison of the ImmunoCAP Assay and AdvanSure TM AlloScreen Advanced Multiplex Specific IgE Detection Assay
Kyung Hee Park
1,2, Jongsun Lee
2, Sang Chul Lee
1, Young Woong Son
1, Da Woon Sim
1,2, Jae-Hyun Lee
1,2, and Jung-Won Park
1,21Division of Allergy and Immunology, Department of Internal Medicine, Yonsei University College of Medicine, Seoul;
2Institute of Allergy, Yonsei University College of Medicine, Seoul, Korea.
Purpose: The AdvanSureTM AlloScreen assay is an advanced multiplex test that allows for simultaneous detection of specific IgE (sIgE) against multiple allergens. For precise identification of causative allergens in allergic patients, we compared this new mul- tiplex sIgE assay with the ImmunoCAP assay, which is currently the gold-standard method for sIgE detection.
Materials and Methods: Serum samples from 218 Korean allergic disease patients were used to compare the ImmunoCAP and AlloScreen assays with respect to the following 13 allergens: Dermatophagoides pteronyssinus, Dermatophagoides farinae, cat and dog dander, Alternaria, birch, oak, ragweed, mugwort, rye grass, and food allergens (egg white, cow’s milk, peanuts).
Results: A total of 957 paired tests using the 13 allergens were compared. The total agreement ratio ranged from 0.74 (oak) to 0.97 (Alternaria). With respect to class association analyses, the gamma index ranged from 0.819 (rye grass) to 0.990 (Alternaria). The intra-class correlation coefficients for house dust mites, cat and dog dander, Alternaria, birch, ragweed, egg white, cow’s milk, and peanut sIgE titers were >0.8.
Conclusion: The AlloScreen and ImmunoCAP assays exhibited similar diagnostic performance. However, due to methodological differences between the two systems, careful interpretation of their results is needed in clinical applications.
Key Words: Allergens, immunoassay, immunoglobulin E
pISSN: 0513-5796 · eISSN: 1976-2437
Received: November 2, 2016 Revised: April 7, 2017 Accepted: April 7, 2017
Corresponding author: Dr. Jung-Won Park, Division of Allergy and Immunology, Department of Internal Medicine, Yonsei University College of Medicine, 50-1 Yonsei-ro, Seodaemun-gu, Seoul 03722, Korea.
Tel: 82-2-2228-1961, Fax: 82-2-393-6884, E-mail: [email protected]
•The authors have no financial conflicts of interest.
© Copyright: Yonsei University College of Medicine 2017
This is an Open Access article distributed under the terms of the Creative Com- mons Attribution Non-Commercial License (http://creativecommons.org/licenses/
by-nc/4.0) which permits unrestricted non-commercial use, distribution, and repro- duction in any medium, provided the original work is properly cited.
Yonsei Med J 2017 Jul;58(4):786-792 https://doi.org/10.3349/ymj.2017.58.4.786
the proficiency of the operator, the test site, or underlying medi- cal illnesses, especially skin diseases.4,5
In Korea, multiplex sIgE detection is commonly used to screen for allergic diseases. In this study, the diagnostic capa- bility of a new Korean multiplex sIgE assay was compared with that of the ImmunoCAP system, which is the current gold-stan- dard method for allergy diagnosis.
MATERIALS AND METHODS
Participants
This study was conducted between January 2014 and Decem- ber 2015 at the Allergy and Asthma Center at Severance Hos- pital, Yonsei University Health System (Seoul, Korea). Patients diagnosed with allergic rhinitis, asthma, atopic dermatitis, food allergy, chronic urticarial, or anaphylaxis were enrolled in the study. Patients ranging from 6 to 75 years of age were included.
Patients receiving immunotherapy were excluded. All partici- pants provided written or verbal informed consent. This study was approved by the Institutional Review Board of the Yonsei University Health System (Approval no. 1-2014-0068).
Blood sampling
Blood samples were collected from 218 patients using serum separation vacuum tubes (Greiner Bio-One, KremsmÜnster, Austria). After centrifugation, the serum was collected from each sample and stored at -70°C for simultaneous testing. After enrollment of the final patient, all samples were sent to two lab- oratories for sIgE analysis. No accompanying clinical data were provided in order to ensure blind testing.
sIgE detection assays
The ImmunoCAP (Thermo Fisher Scientific, Uppsala, Sweden) and AdvanSureTM AlloScreen (LG Life Science, Seoul, Korea) assays were compared with respect to sIgE detection. Both tests were carried out according to standard instructions provided by the respective manufacturers. Thirteen allergens were com- pared: 10 inhalant allergens [Dermatophagoides pteronyssinus (D. pteronyssinus), Dermatophagoides farinae (D. farinae), cat and dog dander, Alternaria, birch, oak, ragweed, mugwort, and rye grass] and three food allergens (egg white, cow’s milk, pea- nuts). The cutoff for a positive result for both the ImmunoCAP and AlloScreen assays was 0.35 kU/L. Both assays adopted the same class determination range, expressed as kU/L: class 0 (0.00–0.34 kU/L), class 1 (0.35–0.69 kU/L), class 2 (0.70–3.49 kU/L), class 3 (3.50–17.49 kU/L), class 4 (17.50–49.99 kU/L), class 5 (50.00–99.99 kU/L), and class 6 (>100 kU/L).
Statistical analyses
To assess the validity and reliability of the multiplex and single- plex assays, IBM SPSS Statistics for Windows software, version 23.0 (IBM Corp., Armonk, NY, USA) was used. First, the sensi-
tivity, specificity, and positive and negative predictive values were calculated based on the ImmunoCAP results. The total agreement ratio was calculated as follows: (number of both tests showing a positive result+number of both tests showing a negative result)/total number of tests.6 This agreement was analyzed by Pearson’s chi-square test. These categorical cross- table data were also compared using Cohen’s kappa analysis.
Kappa values were interpreted as follows: almost perfect (0.8–
1.0), substantial (0.6–0.8), moderate (0.4–0.6), fair (0.2–0.4), and poor (<0.2).7 Second, class assessment was compared using gamma analysis. The closer the gamma index is to 1 indicates stronger association. Third, intra-class correlation (ICC) was used for comparison of sIgE titers.8,9 Therein, values closer to 1 indicate good agreement between the two methods. p<0.05 indicated statistical significance.
RESULTS
Participants and allergens
A total of 218 patients were enrolled in this study. Their mean age was 25.7 years. Males comprised 53.7% of the study group.
Allergic rhinitis was the most common disease among the pa- tients (50.9%), followed by asthma, atopic dermatitis, food al- Table 1. Demographic Characteristics of the Patients
Parameter n=218
Age (yr, mean±SD) 25.73±17.90
Gender, n (%)
Male 117 (53.7)
Female 101 (46.3)
Diagnosis, n (%)
Allergic rhinitis 111 (50.9)
Asthma 65 (29.8)
Atopic dermatitis 70 (32.1)
Food allergy 43 (19.7)
Chronic urticaria 21 (9.6)
Anaphylaxis 5 (2.3)
SD, standard deviation.
Table 2. Qualitative, Semi-Quantitative, and Quantitative Analyses Used for Comparison
Qualitative analysis
Semi-quantitative analysis
Quantitative analysis Specific IgE titers
Class ImmunoCAP
(kUA/L)
AlloScreen (IU/mL)
Negative 0 <0.35 0.00–0.34
Positive 1 0.35 to <0.7 0.35–0.69
Positive 2 0.7 to <3.5 0.70–3.49
Positive 3 3.5 to <17.5 3.50–17.49
Positive 4 17.5 to <50 17.50–49.99
Positive 5 50 to <100 50.00–99.99
Positive 6 >100 ≥100
lergy, chronic urticarial, and anaphylaxis (Table 1). The number of patients tested for sIgE against each of the 13 allergens and the number of patients testing positive for sIgE against each al- lergen according to the ImmunoCAP assay are shown in Table 2.
Qualitative comparison: positivity and negativity
Diagnostic agreement between the assays, as determined by positivity and negativity, is summarized in Table 3. The total agreement ratio ranged from 0.74 (oak) to 0.97 (Alternaria).Kappa index classifications were as follows: almost perfect (D.
pteronyssinus, D. farinae, cat dander, Alternaria), substantial (dog dander, birch, mugwort, peanuts), and moderate (oak, rag- weed, rye grass, egg white, cow’s milk). The kappa indices ranged from 0.51 (cow’s milk) to 0.93 (Alternaria). p-values calculated using Pearson’s chi-square and Cohen’s kappa analysis were all
<0.001.
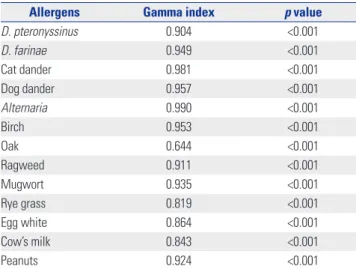
Semi-quantitative comparison: class consistency (class 0–6)
The AlloScreen assay groups test results into classes numbered 0 to 6. Likewise, the ImmunoCAP assay groups test results for both sIgE titers in classes numbered 0 to 6. Even though the two systems are fundamentally different, we compared them in terms of class determination consistency. The results are shown in Table 4. Except for oak allergen, the gamma index of all other allergens examined was >0.8. The Spearman’s correlation coefficients were >0.7 except for oak, rye grass, and egg white.
For both indicators, a value close to 1 indicates that the tests are in good agreement.
Table 3. Diagnostic Agreement between the Two Assays (Sensitivity and Specificity)
Allergens Positive patients, n (%) Total agreement
ratio p value* Kappa index p value†
ImmunoCAP AlloScreen
D. pteronyssinus 37 (53.6) 38 (55.1) 0.93 <0.001 0.85 <0.001
D. farinae 106 (64.6) 109 (66.5) 0.92 <0.001 0.83 <0.001
Cat dander 29 (47.5) 32 (52.5) 0.95 <0.001 0.90 <0.001
Dog dander 35 (50.7) 32 (46.4) 0.87 <0.001 0.74 <0.001
Alternaria 26 (42.6) 24 (39.3) 0.97 <0.001 0.93 <0.001
Birch 40 (57.1) 47 (67.1) 0.81 <0.001 0.61 <0.001
Oak 30 (49.2) 20 (32.8) 0.74 <0.001 0.47 <0.001
Ragweed 38 (52.8) 25 (34.7) 0.79 <0.001 0.59 <0.001
Mugwort 31 (51.7) 20 (33.3) 0.82 <0.001 0.64 <0.001
Rye grass 35 (53.8) 23 (35.4) 0.78 <0.001 0.58 <0.001
Egg white 34 (44.7) 21 (27.6) 0.78 <0.001 0.53 <0.001
Cow’s milk 36 (52.2) 27 (39.1) 0.75 <0.001 0.51 <0.001
Peanuts 31 (51.7) 14 (21.9) 0.87 <0.001 0.74 <0.001
D. farinae, Dermatophagoides farinae; D. pteronyssinus, Dermatophagoides pteronyssinus.
p values were calculated using *Pearson’s chi-square test, †Cohen’s kappa analysis.
Table 4. Class Consistency between the Two Assays
Allergens Gamma index p value
D. pteronyssinus 0.904 <0.001
D. farinae 0.949 <0.001
Cat dander 0.981 <0.001
Dog dander 0.957 <0.001
Alternaria 0.990 <0.001
Birch 0.953 <0.001
Oak 0.644 <0.001
Ragweed 0.911 <0.001
Mugwort 0.935 <0.001
Rye grass 0.819 <0.001
Egg white 0.864 <0.001
Cow’s milk 0.843 <0.001
Peanuts 0.924 <0.001
D. farinae, Dermatophagoides farinae; D. pteronyssinus, Dermatophagoides pteronyssinus.
Table 5. Analysis of Correlations between the Two Assays Allergens Intra-class correlation p value D. pteronyssinus 0.794 (0.668 to 0.876) <0.001
D. farinae 0.939 (0.918 to 0.956) <0.001
Cat dander 0.813 (0.688 to 0.888) <0.001
Dog dander 0.904 (0.844 to 0.940) <0.001
Alternaria 0.897 (0.828 to 0.938) <0.001
Birch 0.948 (0.917 to 0.968) <0.001
Oak 0.154 (-0.41 to 0.492) 0.260
Ragweed 0.833 (0.733 to 0.896) <0.001
Mugwort 0.394 (-0.02 to 0.638) 0.028
Rye grass 0.556 (0.273 to 0.729) 0.001
Egg white 0.839 (0.747 to 0.898) <0.001
Cow’s milk 0.911 (0.857 to 0.945) <0.001
Peanuts 0.912 (0.852 to 0.947) <0.001
D. pteronyssinus, Dermatophagoides pteronyssinus; D. farinae, Dermatopha- goides farinae.
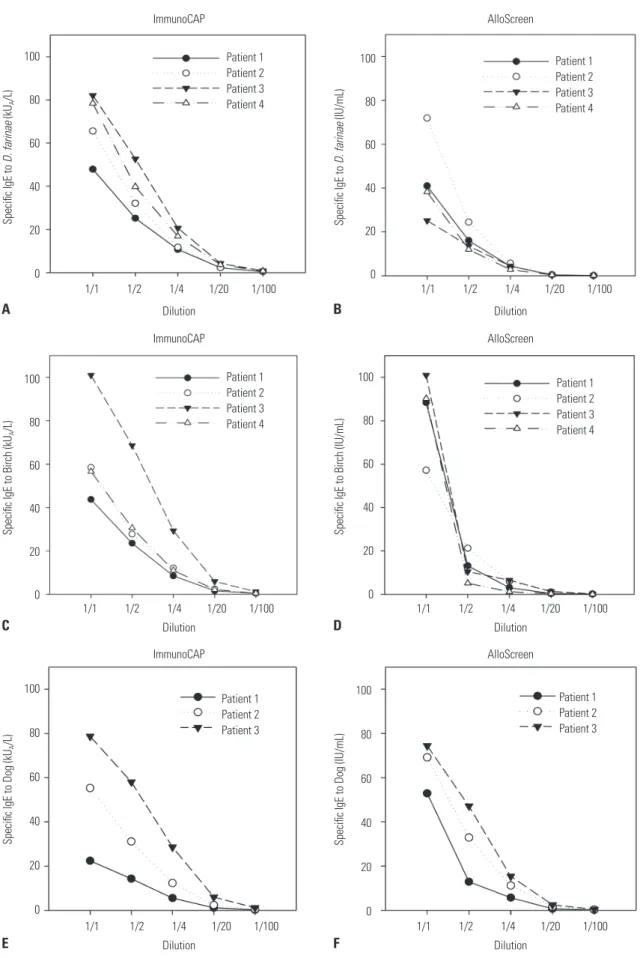
Quantitative comparison: sIgE titer determination
The ICCs for each allergen are shown in Table 5. The ICCs were>0.5 for all of the allergens examined with the exception of oak and mugwort. The results of Passing-Bablok regression analy- ses were not significant. Scatter plots of sIgE titers for each al- lergen are shown in Fig. 1. In addition, we checked the sIgE ti- ters of serially diluted serum specimens (Fig. 2). ImmunoCAP showed good linearity as a quantitation assay. Despite the limi-
tation of being a semi-quantitation assay, AlloScreen showed fair linearity in this dilution test.
DISCUSSION
In this study, we compared the AlloScreen and ImmunoCAP assay systems. AlloScreen is a simultaneous test for multiple
Fig. 1. Specific IgE titers of each allergen detected by ImmunoCAP and AlloScreen. D. pteronyssinus, Dermatophagoides pteronyssinus; D. farinae, Der- matophagoides farinae.
D. pteronyssinus
Alternaria
Mugwort
Peanut
D. farinae
Birch
Rye grass
Cat
Oak
Egg
Dog
Ragweed
Milk
AlloScreen (IU/mL)AlloScreen (IU/mL)AlloScreen (IU/mL)AlloScreen (IU/mL) AlloScreen (IU/mL)AlloScreen (IU/mL)AlloScreen (IU/mL) AlloScreen (IU/mL) AlloScreen (IU/mL)
AlloScreen (IU/mL) AlloScreen (IU/mL)AlloScreen (IU/mL)AlloScreen (IU/mL)
ImmunoCAP (kUA/L)
ImmunoCAP (kUA/L)
ImmunoCAP (kUA/L)
ImmunoCAP (kUA/L)
ImmunoCAP (kUA/L)
ImmunoCAP (kUA/L)
ImmunoCAP (kUA/L)
ImmunoCAP (kUA/L) ImmunoCAP (kUA/L)
ImmunoCAP (kUA/L) ImmunoCAP (kUA/L)
ImmunoCAP (kUA/L) ImmunoCAP (kUA/L)
Fig. 2. Specific IgE titers of serially diluted serum specimens. Specific IgE titers of Dermatophagoides farinae (D. farina) detected by ImmunoCAP (A) and AlloScreen (B). Specific IgE titers of birch detected by ImmunoCAP (C) and AlloScreen (D). Specific IgE titers of dog detected by ImmunoCAP (E) and Al- loScreen (F).
100 80 60 40 20 0
100 80 60 40 20 0
100 80 60 40 20 0
100 80 60 40 20 0
100 80 60 40 20 0 1/1 1/2 1/4 1/20 1/100
1/1 1/2 1/4 1/20 1/100
1/1 1/2 1/4 1/20 1/100
1/1 1/2 1/4 1/20 1/100
1/1 1/2 1/4 1/20 1/100
1/1 1/2 1/4 1/20 1/100 Dilution
Dilution
Dilution
Dilution
Dilution
Dilution ImmunoCAP
ImmunoCAP
AlloScreen
AlloScreen
AlloScreen
Specific IgE to D. farinae (kUA/L)Specific IgE to Birch (kUA/L)Specific IgE to Dog (kUA/L) Specific IgE to D. farinae (IU/mL)Specific IgE to Birch (IU/mL)Specific IgE to Dog (IU/mL)
Patient 1 Patient 2 Patient 3 Patient 4
Patient 1 Patient 2 Patient 3 Patient 4
Patient 1 Patient 2 Patient 3
Patient 1 Patient 2 Patient 3 Patient 4
Patient 1 Patient 2 Patient 3 Patient 4
Patient 1 Patient 2 Patient 3 A
C
E
B
D
F ImmunoCAP
100 80 60 40 20 0
allergens that employs a semi-quantitative enzyme immunoas- say (EIA). There are currently six representative simultaneous tests for multiple allergens available in Korea: AdvanSureTM Al- loScreen (LG Life Science, Seoul, Korea), MAST CLA Allergy Test (Hitachi Chemical Diagnostics, Inc., Mountain View, CA, USA), Polycheck Allergy (Biocheck GmbH, Munster, Germany), RIDA Allergy Screen (R-biopharm, Darmstadt, Germany), PROTIA Allergy-Q (ProteomeTech, Seoul, Korea), and RIDA Allergy Screen (R-Biopharm, Darmstadt, Germany). AlloScreen can test 44 to 62 kinds of allergens simultaneously with 3.5 hours of analysis time with automation process; required serum amount is 100 μL.
The principal tests mentioned above that are available in Korea utilize different technologies, and therefore, the results are not necessarily comparable. One difference is the use of quantitative fluorescent EIA (ImmunoCAP) versus semi-quan- titative EIA (AlloScreen).10 The AlloScreen test procedure is as follows: each allergen is fixed on a membrane strip in the Allo- Screen panel. Serum sample (containing IgE) incubation, wash- ing, incubation with biotinylated anti-IgE, washing, and incu- bation with streptavidin-alkaline phosphatase and substrate proceed sequentially. For color development, nitro-blue tetra- zolium chloride and 5-bromo-4-chloro-3’-indolyphosphate p- toluidine salt are utilized, and the resulting signals are analyzed using AlloStation equipment. There are also methodological differences between the ImmunoCAP and AlloScreen assays with respect to allergen coating (covalent binding to a solid phase), color development (β-galactosidase and methylumbelliferyl-β- D-galactoside), and signal detection (fluorescence intensity).11 For allergen coating, the two assays compared in this study utilize different methods, which can lead to differences in IgE binding. ImmunoCAP uses multiporous nitrocellulose block, which enables thee-dimensional coupling of allergen and its IgE. In this process, allergens are attached to the solid phase via biotinylation. On the other hand, AlloScreen uses nitrocel- lulose membrane, which enables two-dimensional coupling without modification of allergen.8
Differences also exist with respect to allergen sources and allergenic extract quality control. Mongolian oak (Quercus mongolica) and Saw tooth oak (Quercus acutissima) are domi- nant species in Korea instead of white oak (Quercus alba), which is used for ImmunoCAP and AlloScreen.12,13 Well stan- dardized, commercially available Mongolian oak or Saw tooth oak allergen is not available. Therefore, Korean oak allergy pa- tients are diagnosed using foreign oak tree. In Korean allergy patients, the relatively low agreement ratio on oak pollen can be explained by the oak allergen used in the test.
For the above-mentioned reasons, quantitative data regard- ing sIgE titer are not well correlated. In addition, AlloScreen has been developed as a semi-quantitative method, such that quantification precision can differ from that in ImmunoCAP.
Several studies have compared multiplex and single-plex test results obtained with various assays. A comparison of the RIDA
qLine Allergy (R-Biopharm AG, Darmstadt, Germany) and Im- munoCAP assays revealed that the RIDA system is more likely to return false-positive results.14 Another study comparing three multiplex sIgE assays [RIDA Allergy Screen (R-Biopharm), MAST Optigen allergy system (Hitachi Chemical Diagnostics), and Polycheck Allergy (Biocheck GmbH)] showed that the MAST Optigen allergy system provides better sensitivity and that the Polycheck Allergy provides better specificity.15 The Al- loScreen was also compared with skin prick test16 and showed good correlation and agreement.
As medical costs and insurance systems differ in each coun- try, clinicians must be well-informed regarding the strengths and weaknesses of available diagnostic assays in terms of their use in actual patient testing. The fact that sIgE is detected by different assays is not a guarantee that the results are compa- rable.17 Detection of in vitro sIgE does not mean that it is the cause of allergic disease. Clinical manifestation after exposure of allergen, cross-reactivity between the allergens should be considered for interpretation of sIgE assay.
In order to minimize the disadvantages of in vitro tests, many companies have sought to improve the quality of their prod- ucts.18 The AdvanSureTM AlloScreen is a updated version of the AdvanSureTM Allergy Screen.8,19 AlloScreen shows stronger agreement with ImmunoCAP than Allergy Screen.8 As these as- says were developed in an East Asian country, the panel com- position was differentiated to include Asian sensitization pro- files: Humulus japonicus as an inhalant allergen, and mackerel and chrysalis as food allergens.20,21
The current study has some limitations. First, this study was performed considering sensitization but not a clinical diagno- sis of allergy, because the clinical relevance of sensitization was not considered. Clinical manifestations of allergen expo- sure in the study subjects were not objectively identified. Sec- ond, the results of single-plex sIgE assays can differ,6,22,23 al- though this study compared the AlloScreen assay only with the ImmunoCAP assay, as it is highly certified for single-plex sIgE detection. Third, false positivity and false negativity of the Allo- Screen assay were discriminated based on ImmunoCAP test results, not clinical manifestation. Finally, the cut-off value for sIgE positivity can differ between allergens.11
In conclusion, the results of the AlloScreen assay correlated well with those of the ImmunoCAP assay with regard to com- mon inhalant and food allergens. However, as each diagnostic method has unique characteristics, the results are not neces- sarily interchangeable.
ACKNOWLEDGEMENTS
This research was supported by a grant from the Korea Health Technology R&D Project through the Korea Health Industry Development Institute, funded by the Ministry of Health &
Welfare, Republic of Korea (grant number: HI13C0010) and LG Life Science (1-2014-0068). The funding organization(s)
played no role in the study design; in the collection, analysis, and interpretation of data; in the writing of the report; or in the decision to submit the report for publication.
REFERENCES
1. Bousquet PJ, Chinn S, Janson C, Kogevinas M, Burney P, Jarvis D;
European Community Respiratory Health Survey I. Geographical variation in the prevalence of positive skin tests to environmental aeroallergens in the European Community Respiratory Health Sur- vey I. Allergy 2007;62:301-9.
2. Burney P, Summers C, Chinn S, Hooper R, van Ree R, Lidholm J.
Prevalence and distribution of sensitization to foods in the Europe- an Community Respiratory Health Survey: a EuroPrevall analysis.
Allergy 2010;65:1182-8.
3. Cox L, Williams B, Sicherer S, Oppenheimer J, Sher L, Hamilton R, et al. Pearls and pitfalls of allergy diagnostic testing: report from the American College of Allergy, Asthma and Immunology/American Academy of Allergy, Asthma and Immunology Specific IgE Test Task Force. Ann Allergy Asthma Immunol 2008;101:580-92.
4. Bernstein IL, Li JT, Bernstein DI, Hamilton R, Spector SL, Tan R, et al. Allergy diagnostic testing: an updated practice parameter. Ann Allergy Asthma Immunol 2008;100(3 Suppl 3):S1-148.
5. Bousquet J, Heinzerling L, Bachert C, Papadopoulos NG, Bousquet PJ, Burney PG, et al. Practical guide to skin prick tests in allergy to aeroallergens. Allergy 2012;67:18-24.
6. Lee YW, Sohn JH, Lee JH, Hong CS, Park JW. Allergen-specific IgE measurement with the IMMULITE 2000 system: intermethod com- parison of detection performance for allergen-specific IgE antibod- ies from Korean allergic patients. Clin Chim Acta 2009;401:25-32.
7. Landis JR, Koch GG. The measurement of observer agreement for categorical data. Biometrics 1977;33:159-74.
8. Lee JH, Park KH, Kim HS, Kim KW, Sohn MH, Kim CH, et al. Spe- cific IgE measurement using AdvanSure® system: comparison of detection performance with ImmunoCAP® system in Korean aller- gy patients. Clin Chim Acta 2012;413:914-9.
9. Fleiss JL, Cohen J. The equivalence of weighted kappa and the in- traclass correlation coefficient as measures of reliability. Educ Psy- chol Meas 1973;33:613-9.
10. Lee JH, Park HJ, Park KH, Jeong KY, Park JW. Performance of the PROTIATM Allergy-Q® system in the detection of allergen-specific IgE: a comparison with the ImmunoCAP® system. Allergy Asthma Immunol Res 2015;7:565-72.
11. Goikoetxea MJ, Sanz ML, García BE, Mayorga C, Longo N, Gamboa PM, et al. Recommendations for the use of in vitro methods to de- tect specific immunoglobulin E: are they comparable? J Investig Allergol Clin Immunol 2013;23:448-54.
12. Jeong KY, Son M, Park JH, Park KH, Park HJ, Lee JH, et al. Cross-re- activity between oak and birch pollens in Korean tree pollinosis. J Korean Med Sci 2016;31:1202-7.
13. Park KH, Son YW, Lee SC, Jeong K, Sim DW, Park HJ, et al. Clinical significance of component allergens in fagales pollen-sensitized peanut allergy in Korea. Allergy Asthma Immunol Res 2016;8:505-11.
14. Hwang H, Kwon J, Kim JY, Lee HH, Oh CE, Choi GS. The RIDA al- lergy screen versus the phadiatop Test in 430 Consecutive Patient Specimens. Lab Med 2016;47:20-9.
15. Han M, Shin S, Park H, Park KU, Park MH, Song EY. Comparison of three multiple allergen simultaneous tests: RIDA allergy screen, MAST optigen, and polycheck allergy. Biomed Res Int 2013;2013:
340513.
16. Cho JH, Suh JD, Kim JK, Hong SC, Park IH, Lee HM. Correlation between skin-prick testing, individual specific IgE tests, and a multiallergen IgE assay for allergy detection in patients with chron- ic rhinitis. Am J Rhinol Allergy 2014;28:388-91.
17. Szeinbach SL, Barnes JH, Sullivan TJ, Williams PB. Precision and accuracy of commercial laboratories’ ability to classify positive and/or negative allergen-specific IgE results. Ann Allergy Asthma Immunol 2001;86:373-81.
18. Kim JK, Yoon YM, Jang WJ, Choi YJ, Hong SC, Cho JH. Compari- son study between MAST CLA and OPTIGEN. Am J Rhinol Allergy 2011;25:e156-9.
19. Oh EJ, Lee SA, Lim J, Park YJ, Han K, Kim Y. [Detection of allergen specific IgE by AdvanSure Allergy Screen test]. Korean J Lab Med 2010;30:420-31.
20. Kim SR, Park HJ, Park KH, Lee JH, Park JW. IgE sensitization pat- terns to commonly consumed foods determined by skin prick test in Korean adults. J Korean Med Sci 2016;31:1197-201.
21. Jeong KY, Son M, Choi SY, Park KH, Park HJ, Hong CS, et al. Stan- dardization of weed pollen cxtracts, Japanese hop and mugwort, in Korea. Yonsei Med J 2016;57:399-406.
22. Wang J, Godbold JH, Sampson HA. Correlation of serum allergy (IgE) tests performed by different assay systems. J Allergy Clin Im- munol 2008;121:1219-24.
23. Graham F, Bégin P, Paradis L, Lacombe-Barrios J, Paradis J, Des Roches A. Comparison of ImmunoCAP and Immulite serum spe- cific IgE assays for the assessment of egg allergy. Allergy Asthma Clin Immunol 2016;12:29.