Predictors of midpalatal suture expansion by miniscrew-assisted rapid palatal expansion in young adults: A preliminary study
12
0
0
전체 글
(2) Shin et al • Predictors of MARPE in adults. INTRODUCTION Miniscrew-assisted rapid palatal expansion (MARPE) is used in patients with maxillary constriction. It often shows adverse effects such as buccal tipping or bony dehiscence of the posterior teeth. Previous studies have reported that the success rates of MARPE in adults range from 84.2% to 86.96%.1,2 Although MARPE facilitates more efficient bone splitting than does conventional rapid palatal expansion (RPE),3 if it fails in a postgrowth patient, the treatment plan has to be changed to a more invasive surgically assisted RPE. Therefore, identification of predictors of success/failure of MARPE in young adults is clinically meaningful. However, previous studies have focused on predictors of conventional RPE,4,5 post-MARPE stability,2,6 or stress and displacement of craniofacial sutures,3,7,8 and no study has focused on the predictors of MARPE in young adults. Some previous studies indicated that an applianceinduced palatal bone split may be attributable to multiple factors rather than simply being caused by suture ossification.9-11 Although chronological age was considered as a conventional RPE indicator,12-14 this assumption remains controversial.15 In addition, given the physical phenomena involved in MARPE, palatal shape (length and depth) may also be a contributing factor. Although the MARPE appliance is not placed at the anterior palate, more expansion occurs in the anterior than in the posterior region due to the resistance of the sutures and posterior bones close to the palate, etc.7,8 Matsuyama et al.,16 through a finite element analysis, showed that palatal bone expansion decreased significantly with increased palate depth. Other factors that can be considered include the vertical skeletal pattern and anteroposterior skeletal classification. At higher sella-nasion (SN)-mandibular plane (MP) angles, the palate depth increased or the dental arch width decreased.17,18 Furthermore, the dental arch widths of Class II and III malocclusion groups were significantly smaller than that of a Class I group.19 Therefore, the SN-MP angle, which indicates the vertical skeletal pattern, and the point Anasion-point B (ANB) angle, which indicates the horizontal skeletal relationship, can be considered as factors that may affect midpalatal expansion in MARPE. Recently, the midpalatal suture maturation (MPSM) stage (stages A–E)20 and midpalatal suture density (MPSD) ratio21 were also proposed as predictors of conventional RPE response. Taken together, under the premise that midpalatal suture expansion by MARPE is affected by multiple factors, the following factors should be considered as potential contributing variables: chronological age, palate length and depth, SN-MP angle, anteroposterior skeletal classification, MPSM stage, and MPSD ratio.. www.e-kjo.org. https://doi.org/10.4041/kjod.2019.49.6.360. In general, skeletal expansion by MARPE is evaluated on cone-beam computed tomography (CBCT) images, because accurate evaluation of midpalatal suture expansion on radiographic images has been considered to be difficult due to image distortion and overlap of the midpalatal suture area with the vomer and nose.10 However, maxillary anterior periapical radiographs are still used for clinical evaluation of midpalatal suture expansion. This study evaluated midpalatal suture opening on periapical radiographs in which the magnification and distortion issues on radiographic images were minimized. This study sought to determine the predictors of midpalatal suture expansion by MARPE in young adults by analyzing the correlations of the midpalatal suture opening ratio with potential variables, namely, age, palate length and depth, vertical skeletal pattern, anteroposterior skeletal classification, MPSM stage, and MPSD ratio.. MATERIALS AND METHODS Study design This retrospective study included 31 adult patients (mean age, 22.52 ± 5.11 years) who had undergone MARPE at the Department of Orthodontics, Yonsei University Dental Hospital between 2016 and 2017. The study protocol, including the use of existing periapical radiographic and CBCT images, was approved by the Institutional Review Board of Yonsei University Dental Hospital (No. 2-2018-0030). The inclusion criteria were as follows: age greater than 18 years, good oral hygiene, and no general diseases or congenital cranial malformations. Patients with insufficient follow-up records were excluded. The corresponding patients’ records of lateral cephalograms, CBCT images, and maxillary anterior periapical radiographic images before (T0) and after (T2) MARPE were acquired from the archives of the Department of Orthodontics, including periapical radiographic images (HELIODENT MD; Siemens, Munich, Germany) taken at 2- to 4-week intervals after commencing MARPE activation to confirm the midpalatal suture opening. T1 was defined as the time when the midpalatal suture opening was found for the first time in a periapical radiographic image. In addition, to verify the factors affecting the success or failure of midpalatal suture expansion by MARPE, this study also involved subjects who did not show confirmed skeletal expansion in the final periapical radiographic images. All acquired radiographic images were confirmed using an anterior Rinn XCP positioning instrument to ensure a constantmagnification image. CBCT (Alphard-3030; ASAHI Roentgen IND, Kyoto, Japan) images were captured for 17 seconds (settings: 8.0 mA and 80 kV; field of view: 200 × 179 mm2; and voxel size: 390 µm).. 361.
(3) Shin et al • Predictors of MARPE in adults. The hyrax-type MARPE appliance was placed at the palate with four miniscrews (diameter: 1.8 mm, length 7.0 mm, self-drilled type; ORLUS; Ortholution, Seoul, Korea) in holes connected with an expander base (Figure 1). MARPE was activated at the rate of 1 turn/day (0.2 mm/turn). If no opening was found despite periodic activation in periapical radiographic images, a slow turn (1 turn/2 days) was applied to obtain a camouflage dental effect. For evaluation of midpalatal suture opening in the periapical radiographic images in this study, when midpalatal suture opening was verified in a radiographic image, the patient was classified into the “separation” group, otherwise the patient was classified into the “non-separation” group. Subjects in the present study were further classified into subgroups by MPSM stage, sex, vertical skeletal pattern (SN-MP angle: low [< 27o], average [27–37o], or. high [> 37o]),22 and anteroposterior skeletal classification (ANB angle: Class I [0–4o], Class II [> 4o], or Class III [< 0o]).22 Measurements Table 1 shows the definitions of the measured variables. The midpalatal suture opening ratio was the ratio of midpalatal suture opening width measured in periapical radiographic images to the MARPE screw expansion width, converted from the number of turns recorded in a chart on every visit. The midpalatal suture opening width was obtained in periapical radiographic images at T0 and T1 in the separation group and at T2 in the non-separation group, and was defined as the change in the distance between the mesial cementoenamel junction points of both upper central incisors (Figure 2). CBCT images were saved as digital imaging and communications in medicine (DICOM) files, and measure-. Figure 1. Miniscrew-assisted rapid palatal expansion appliance. A, Before expansion. B, After expansion. Table 1. Definitions of the measured variables Measure. Definition. Midpalatal suture opening width. Δ length between mesial CEJ points of both maxillany central incisors in periapical X-ray (refer to Figure 2). Midpalatal suture opening ratio. Midpalatal suture opening width/appliance expansion width. Palate length. In an axial slice passing through the incisive foramen, perpendicular distance from posterior border of incisive foramen to a line made by coronal plane through the PNS sagittally (refer to Figure 4A and 4B). U4/U6 palate depth. Perpendicular distance from deepest point of palate to the line passing through palatal CEJ points of 1st premolars (U4)/1st molars (U6) bilaterally (refer to Figure 4C and 4D). Vertical skeletal pattern. By SN-MP angle in a lateral cephalogram, classified to low (< 27o), average (27– 37o), and high (> 37o).. Anteroposterior skeletal classification. By ANB angle in a lateral cephalogram, classified to Class I (0–4o), Class II (> 4o), and Class III (< 0o). Midpalatal suture maturation stage. Determined by the change of the midpalatal suture morphology (refer to Figure 5). Midpalatal suture density ratio. Evaluated by the grey scales in midpalatal suture, palatine process of maxilla, and soft palate (refer to Figure 6). CEJ, Cementoenamel junction; PNS, posterior nasal spine; SN-MP, sella-nasion-mandibular plane; ANB, point A-nasion-point B.. 362. https://doi.org/10.4041/kjod.2019.49.6.360. www.e-kjo.org.
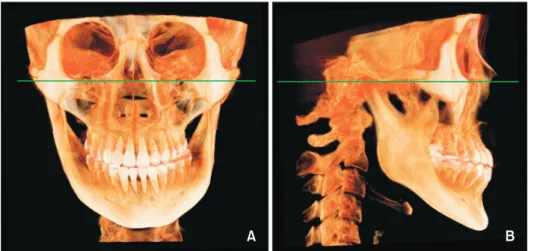
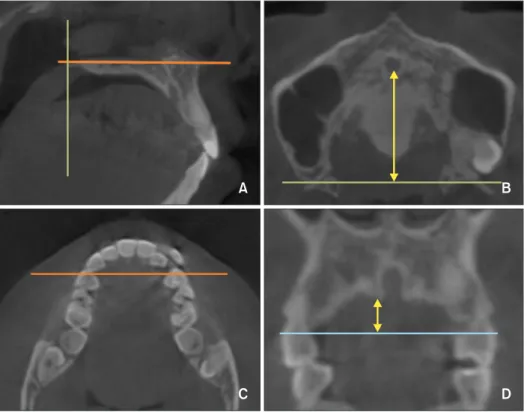
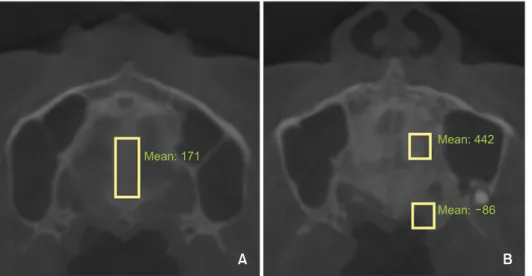
(4) Shin et al • Predictors of MARPE in adults. ments were made with InVivo5® software (ver. 5.4.5; Anatomage, San Jose, CA, USA). For re-orientation of CBCT images, a line that connected both the infraorbital lower margins in the frontal view as well as the Frankfort horizontal plane in the sagittal view were used (Figure 3). The palate length and depth, MPSM stage, and the MPSD ratio were acquired in imported T0 CBCT images. The palate length was defined, in axial view, as the distance from the posterior border of the incisive foramen to the line formed by the coronal slice passing the posterior nasal spine in sagittal plane (Figure 4A and 4B). The measurement of U4 or U6 palate depths started from the line passing through both upper first premolar buccal tips or mesiobuccal furcations of the first molar. Figure 2. Midpalatal suture opening width in periapical radiographic images (A) at T0 and (B) at T1 in separation and at T2 in non-separation cases. The midpalatal suture opening width was defined as the difference in distance (a′–a) between the mesial cementoenamel junctions of both upper central incisors. T0, Initial; T1, when the midpalatal suture opening was confirmed in a periapical radiograph; T2, immediately after miniscrew-assisted rapid palatal expansion stopped.. in an axial plane (Figure 4C). In the coronal slice obtained at the baseline in Figure 4C, palate depth was the distance from the deepest palate point to the line connected with both palatal cementoenamel junctions of both upper premolars (Figure 4D) or first molars. If the line connecting two points, such as the buccal tips or furcations, was not located on a plane in an axial view, the line was forced to pass through the midpoints of straight lines that passed through the respective points. The MPSM stages were determined based on the midpalatal suture morphology of both of maxillary and palatine bones, following the method proposed by Angelieri et al. (Figure 5).20 The MPSD ratio was evaluated by the grey scales in the midpalatal suture, the palatine process of the maxilla, and the soft palate, in accordance with the definition proposed by Grünheid et al.21 (Figure 6): the ratio of the difference in grey scales in the midpalatal suture and the soft palate to the difference of grey scales in the palatine process and soft palate. On the initial lateral cephalograms, the SN-MP angle and ANB angle were digitized in V-Ceph 5.5 (Osstem, Seoul, Korea). The MP was defined from the menton to the inferior border of the angular area of the mandible.23 The basic characteristics of the subjects are provided in Table 2. Statistical analysis All measurements were repeated after 2 weeks to assess their reliability. The intraclass correlation coefficient was > 0.9. All statistical analyses were performed in SPSS (ver. 15.0; SPSS Inc., Chicago, IL, USA). Based on the results of a pilot study, the minimum sample size for determining correlations between the midpalatal suture opening ratio and variables was 24 in R software ver. 3.4.4 for 80% power using a two-sided significance level of 0.05. The normality of each subgroup was determined by the Shapiro–Wilk test. One-sample t -test or an independent-sample t -test was used to compare the. Figure 3. Re-orientation in InVivo5® software. A, In the coronal view, the horizontal line connected with both infraorbital lower borders. B, In the sagittal view, the Frankfort horizontal plane was used. www.e-kjo.org. https://doi.org/10.4041/kjod.2019.49.6.360. 363.
(5) Shin et al • Predictors of MARPE in adults. A. B. C. D. Figure 4. Measurements of palate length and the maxillary first premolar (U4) palate depth. A, Baselines for palate length in a sagittal view: the horizontal line passing through incisive foramen and the vertical line passing through posterior nasal spine (PNS). B, The solid arrow indicates palate length, defined as a perpendicular length from the posterior border of incisive foramen to the horizontal line made by coronal plane through the PNS sagittally. C, In an axial view, the horizontal line passing through both U4 buccal tips. D, In a coronal slice including the horizontal line in C, a solid arrow indicates U4 palate depth, defined as the perpendicular length from the deepest point on the palate to the horizontal line connecting both palatal cementoenamel junction points of U4.. Figure 5. Schematic images of midpalatal suture maturation stages by midpalatal suture morphology, in accordance with the results reported by Angelieri et al.20 Stage A shows a straight high-density line of a midpalatal suture with little interdigitation; stage B shows a scalloped high-density line of a suture; stage C shows two parallel, scalloped, highdensity lines both in the maxillary and palatine bones; stage D is characterized by the fusion of the midpalatal suture in the palatine bone; and in stage E, the midpalatal suture is not seen even in the maxillary portion. means in the entire patient group and the subgroups. For the MPSM stage, an ordinal scale, nonparametric analysis was performed. The Mann–Whitney U test or. 364. Kruskal–Wallis test was applied to compare the data in subgroups. Pearson or Spearman correlation analysis was performed depending on the data normality of each. https://doi.org/10.4041/kjod.2019.49.6.360. www.e-kjo.org.
(6) Shin et al • Predictors of MARPE in adults. Figure 6. Evaluations of grey scales for midpalatal suture density ratio. A, In the midpalatal suture. B, In the palatine process of the maxilla and soft palate, in accordance with the results reported by Grünheid et al.21 Table 2. Basic characteristics of the subjects (n = 31) Characteristic. Total. Sex Vertical skeletal pattern (SN-MP angle). < 30 yr. 27. 23. 4. ≥ 30 yr. 4. 2. 2. Male. 10. 6. 4. Female. 21. 19. 2. 2. 2. 0. 15. 11. 4. High (> 37 ). 14. 12. 2. Class I (0–4o). 8. 5. 3. Class II (> 4o). 5. 5. 0. o. 18. 15. 3. Low (< 27o) Average (27–37o) o. Skeletal classification (ANB angle). Non-separation. 22.52 ± 5.11 (18–36). Age (yr) at MARPE start No. of subject. Separation. Class III (< 0 ) Periods of MARPE expansion in separation group from T0 to T1 (n = 25, days). 20.00 ± 8.71 (6–43). Periods of MARPE expansion trial in non-separation group from T0 to T2 (n = 6, days). 27.00 ± 6.42 (21–39). Values are presented as mean ± standard deviation (range) or number only. MARPE, Miniscrew-assisted rapid palatal expansion; SN-MP, sella-nasion-mandibular plane; ANB, point A-nasion-point B; T0, initial; T1, when the midpalatal suture opening was confirmed in a periapical radiograph; T2, right after MARPE expansion stopped.. group or the characteristic of each variable. Lastly, a linear regression model was developed. For this, the ordinal scale, MPSM stage, was converted to dummy variables (dMPSM1 and dMPSM2). For stage C, dMPSM1 = 0 and dMPSM2 = 0; for stage D, dMPSM1 = 1 and dMPSM2 = 0; and for stage E, dMPSM1 = 0 and dMPSM2 = 1.. RESULTS Table 3 shows the descriptive statistics of the measured variables in the separation and non-separation. www.e-kjo.org. https://doi.org/10.4041/kjod.2019.49.6.360. groups as well as in all subjects, including the mean differences between groups. Comparisons of the means of the variables in the entire patient group and the separation group did not show statistically significant differences (all p > 0.05). The median values of MPSM in the entire patient group and the separation group showed no difference (both medians = 3, 25th to 75th percentile = 3.00–4.00), unlike the findings for the non-separation group (median = 4, 25th to 75th percentile = 3.75–5.00). The Mann–Whitney U test between the separation and non-separation groups showed a statistically significant. 365.
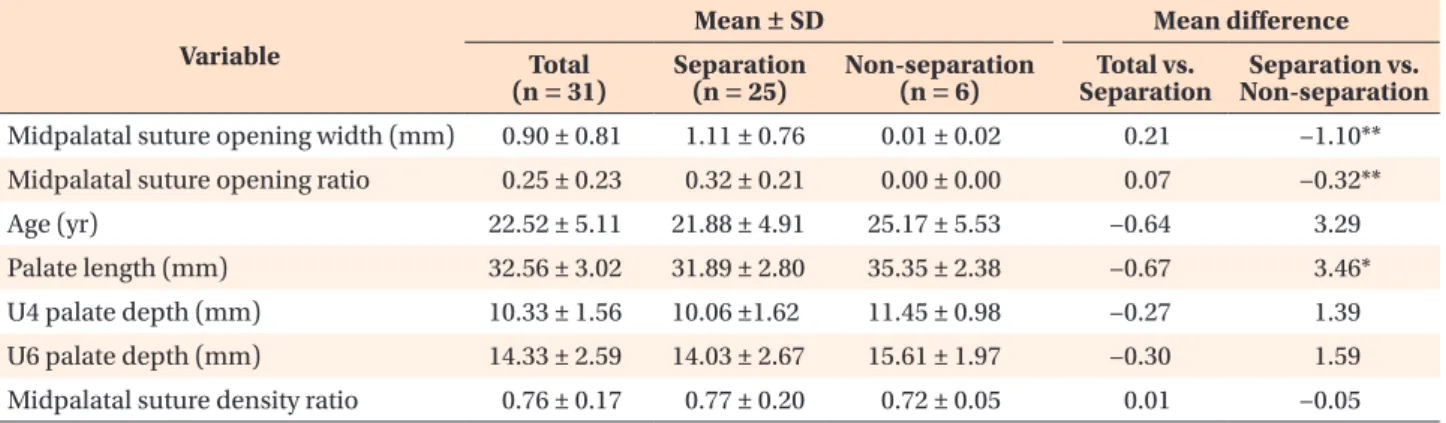
(7) Shin et al • Predictors of MARPE in adults. Table 3. Comparison of mean values among the entire patient group and the separation and non-separation groups Mean ± SD Variable. Total (n = 31). Separation (n = 25). Mean difference Non-separation (n = 6). Total vs. Separation. Separation vs. Non-separation. Midpalatal suture opening width (mm). 0.90 ± 0.81. 1.11 ± 0.76. 0.01 ± 0.02. 0.21. −1.10**. Midpalatal suture opening ratio. 0.25 ± 0.23. 0.32 ± 0.21. 0.00 ± 0.00. 0.07. −0.32**. 22.52 ± 5.11. 21.88 ± 4.91. 25.17 ± 5.53. −0.64. 3.29. Age (yr) Palate length (mm). 32.56 ± 3.02. 31.89 ± 2.80. 35.35 ± 2.38. −0.67. 3.46*. U4 palate depth (mm). 10.33 ± 1.56. 10.06 ±1.62. 11.45 ± 0.98. −0.27. 1.39. U6 palate depth (mm). 14.33 ± 2.59. 14.03 ± 2.67. 15.61 ± 1.97. −0.30. 1.59. 0.76 ± 0.17. 0.77 ± 0.20. 0.72 ± 0.05. 0.01. −0.05. Midpalatal suture density ratio. An ordinal scale, midpalatal suture maturation stage, was excluded from this Table. U4 and U6, The maxillary first premolar and molar respectively; SD, standard deviation. Mean difference was analyzed by a sample t -test according to the normality of the data (*p < 0.01; **p < 0.001).. Table 4. Descriptive statistics of subgroups and comparison of the midpalatal suture opening ratio Variable. Number (%). Age (yr) Median. Min. Midpalatal suture opening ratio. Max. IQR. Median. Min. Max. IQR. MPSM stage C. 17 (54.84). 19. 18. 34. 3. 0.47. 0.00. 0.76. 0.29. D. 11 (35.48). 22. 20. 36. 5. 0.06. 0.00. 0.26. 0.23. E. 3 (9.68). 29. 22. 30. 8. 0.00. 0.00. 0.13. -. p -value. 0.002*. 0.000**. Sex Male. 10 (32.26). 0.05. 0.00. 0.51. 0.27. Female. 21 (67.74). 0.26. 0.00. 0.76. 0.30. p -value. 0.022*. Vertical skeletal pattern (SN-MP angle) Low (< 27o). 2 (6.45). 0.16. 0.06. 0.26. -. Norm (27–37o). 15 (48.39). 0.24. 0.00. 0.76. 0.37. High (> 37o). 14 (45.16). 0.25. 0.00. 0.70. 0.39. 0.00. 0.76. 0.32. p -value. 0.889. Skeletal classification (ANB angle) Class I (0–4o) o. 8 (25.81). 0.19. Class II (> 4 ). 5 (16.13). 0.58. 0.04. 0.70. 0.56. Class III (< 0o). 18 (58.06). 0.24. 0.00. 0.51. 0.33. p -value. 0.281. Min, Minimum; max, maximum; IQR, interquartile range; MPSM, midpalatal suture maturation; SN-MP, sella-nasionmandibular plane; ANB, point A-nasion-point B. Mann–Whitney U test or Kruskal–Wallis test was performed because the data were not normally distributed. *p < 0.05; **p < 0.01. Refer to Figure 5 for definitions of MPSM stage.. difference (p < 0.05). Table 4 shows that there were significant differences in the midpalatal suture opening ratio in relation to. 366. the MPSM stage and sex (all p < 0.05), whereas no significant differences were observed in relation to the vertical skeletal pattern and the anteroposterior skeletal. https://doi.org/10.4041/kjod.2019.49.6.360. www.e-kjo.org.
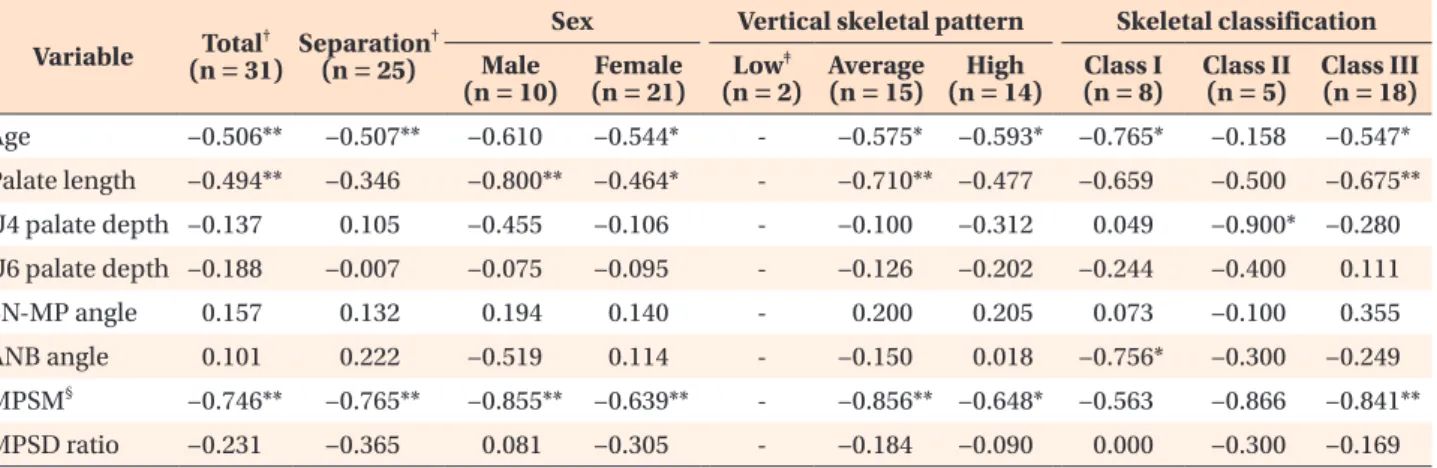
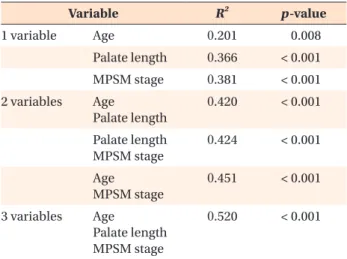
(8) Shin et al • Predictors of MARPE in adults. classification (all p > 0.05). Tukey test using ranks of the midpalatal suture opening ratio showed statistically significant differences in the MPSM stage C and others. Additionally, MPSM stages A and B were not found in the subjects of this study. The results of the correlation analyses between midpalatal suture opening ratio and variables in the entire patient group and subgroups are shown in Table 5. In the entire patient group, age, palate length, and MPSM stage showed statistically significant negative correlations with the midpalatal suture opening ratio (r = –0.506, –0.494, and –0.746, respectively, all p < 0.01; Figure 7), whereas age and MPSM stage showed significant negative correlations in the separation group (r = –0.507 and –0.765, respectively, both p < 0.01). In other subgroup analyses, only U4 palate depth showed a significant correlation in the skeletal Class II subgroup (r = –0.900, p < 0.05). Based on the results of the correlation analysis in the entire patient group, age, palate length, and MPSM stage were selected as the primary predictors for the MARPE midpalatal suture opening ratio. Before linear regression modeling, the determinant coefficient, adjusted R2 , and the significance were determined for the number of variables included to evaluate the explanatory power according to the number of variables considered (Table 6). As the number of variables increased, R2 increased. Age had the least explanatory power (0.201); the highest explanatory power (0.520) was obtained when all three variables were simultaneously included.. Therefore, age, palate length, and MPSM stage were all included in the linear regression model for the midpalatal suture opening ratio: Midpalatal suture opening ratio = –0.346 × age – 0.325 × palate length – 0.4 × dMPSM1 The characteristics of the non-separation subjects are shown in Table 7. In total, 15% of the subjects in their 20s and 50% of those in their 30s failed to achieve midpalatal suture opening. One subject with MPSM stage C was also included in this group.. DISCUSSION This study premised that midpalatal suture opening was affected by multiple variables and identified age, palate length, and MPSM stage as predictors of midpalatal suture expansion by MARPE in young adults. In general, as age increases, midpalatal suture interdigitation increases, with marked variations across individuals.9,24,25 In addition, some studies have stated that the ossification of the midpalatal suture of each individual should be assessed by CBCT.20,26 However, the results of the present study show that the age differed significantly across MPSM stages (Table 4), and age correlated significantly with the midpalatal suture opening ratio (Table 5). Furthermore, linear regression analysis indicated that the inclusion of age increased the explanatory power of the model (R2 = 0.424 excluding age; R2 = 0.520 including age). Therefore, it is reasonable that. Table 5. Correlations between midpalatal suture opening ratio and variables in the entire patient group and subgroups Variable. Total† Separation† (n = 31) (n = 25). Sex Male (n = 10). Vertical skeletal pattern. Female (n = 21). ‡. Average High Low (n = 2) (n = 15) (n = 14). Age. −0.506**. −0.507**. −0.610. −0.544*. -. −0.575*. Palate length. −0.494**. −0.346. −0.800**. −0.464*. -. −0.710** −0.477. -. −0.100. U4 palate depth −0.137. 0.105. −0.455. −0.106. U6 palate depth −0.188. −0.593*. Skeletal classification Class I (n = 8). Class II (n = 5). Class III (n = 18). −0.765*. −0.158. −0.547*. −0.659. −0.500. −0.675**. −0.312. 0.049. −0.900*. −0.280. −0.007. −0.075. −0.095. -. −0.126. −0.202. −0.244. −0.400. 0.111. SN-MP angle. 0.157. 0.132. 0.194. 0.140. -. 0.200. 0.205. 0.073. −0.100. 0.355. ANB angle. 0.101. 0.222. −0.519. 0.114. -. −0.150. 0.018. −0.756*. −0.300. −0.249. §. MPSM. −0.746**. −0.765**. MPSD ratio. −0.231. −0.365. −0.855** 0.081. −0.639**. -. −0.856** −0.648*. −0.305. -. −0.184. −0.090. −0.563. −0.866. −0.841**. 0.000. −0.300. −0.169. Vertical skeletal pattern by SN-MP angle: low, SN-MP < 27o; average, 27o ≤ SN-MP ≤ 37o; high, SN-MP > 37o. Skeletal classification by ANB angle: Class I, 0o ≤ ANB ≤ 4o; Class II, ANB > 4o; Class III, ANB < 0o. U4 and U6, The maxillary first premolar and molar respectively; SN-MP, sella-nasion-mandibular plane; ANB, point A-nasionpoint B; MPSM, midpalatal suture maturation; MPSD, midpalatal suture density. *p < 0.05; **p < 0.01. † Pearson’s correlation analysis was performed depending on the data normality, except for MPSM. For other subgroups, Spearman’s rho, rs, was obtained by Spearman correlation analysis because the data were not normally distributed. ‡ No statistical analysis was performed due to the small sample size. § For MPSM, an ordinal scale, Spearman correlation analysis was performed.. www.e-kjo.org. https://doi.org/10.4041/kjod.2019.49.6.360. 367.
(9) Shin et al • Predictors of MARPE in adults. Figure 7. Correlations between midpalatal suture opening ratio and age (A), palate length (B), MPSM stage (C), MPSD ratio (D), SN-MP angle (E), and ANB angle (F). Best-fit lines with correlation coefficients, r by Pearson correlation analysis and rs by Spearman correlation analysis (A–C, p < 0.01; D–F, p > 0.05). MPSM, Midpalatal suture maturation; MPSD, midpalatal suture density; SN-MP, sella-nasion-mandibular plane; ANB, point A-nasion-point B. age should be considered as a contributing predictor of MARPE outcome in adults, even though it could not be a definitive factor in determining the maturity of the midpalatal suture, as Angelieri et al.20 described. Persson and Thilander24 reported that midpalatal suture ossification progresses from the posterior to the anterior region. Therefore, in cases with a longer palate length, suture expansion in the anterior side will be clearly delayed. Furthermore, the result showing a. 368. statistically significant difference in the mean values of the palate length between the separation and nonseparation groups supports our finding of palate length as a new predictor. The MPSD ratio did not correlate significantly with the midpalatal suture opening ratio (Figure 7D), unlike the results reported by Grünheid et al.21 The differences between these studies may be due to the following factors. First, the MPSD ratio was determined by the dif-. https://doi.org/10.4041/kjod.2019.49.6.360. www.e-kjo.org.
(10) Shin et al • Predictors of MARPE in adults. ference in grey scale between the midpalatal suture and the palatal process (Figure 6). Unlike in the study by Grünheid et al.,21 which targeted growing patients (mean age, 7.9–16.6 years), this study targeted adults, in whom the grey scales of these two areas were not significantly different. Second, when the grey scale of the palatal process was measured using a 4- × 4-mm rectangle according to the method described by Grünheid et al.,21 the grey scale changed depending on the location of this rectangle. In contrast, the MPSM stage designation was highly reproducible in CBCT images, in agreement with another recent study.27 Matsuyama et al.16 reported that palate expansion was dependent on the palate depth, which was 4 or 8 mm higher, through finite element analysis, unlike the re-. Table 6. The determinant coefficient, R 2 , values of midpalatal suture opening ratio corresponding to the number of independent variables R2. Variable 1 variable. 2 variables. 3 variables. p -value. Age. 0.201. 0.008. Palate length. 0.366. < 0.001. MPSM stage. 0.381. < 0.001. Age Palate length. 0.420. < 0.001. Palate length MPSM stage. 0.424. < 0.001. Age MPSM stage. 0.451. < 0.001. Age Palate length MPSM stage. 0.520. < 0.001. MPSM, Midpalatal suture maturation.. sults of this study. However, the mean difference in palate depth between the separation and non-separation groups was less than 2 mm in their study. In females and skeletal Class III subgroups listed in Table 5, the variables that showed significant correlations with the midpalatal suture opening ratio were similar to those identified in the entire patient group, perhaps because females and skeletal Class III patients accounted for 67.7% (21 of 31) and 58.1% (18 of 31) of the total patient population, respectively. Thus, the characteristics of small subgroups may have been masked in the entire patient group. In that sense, the strong correlation of U4 palate depth with the midpalatal suture opening ratio in the skeletal Class II subgroup has important meaning. Therefore, further studies with more samples in each anteroposterior skeletal classification subgroup will be necessary to re-evaluate the correlation between the midpalatal suture opening ratio and anteroposterior skeletal classification. The explanatory power for the midpalatal suture opening ratio was the highest when age, palate length, and MPSM stage were all considered, as determined by the linear regression model. Furthermore, the explanatory power when including two variables was about two-fold greater than that obtained when considering only age. Thus, if the palate length can be measured accurately in lateral cephalograms, the possibility of midpalatal suture opening via MARPE can be easily predicted by using only age and palate length, without the evaluation of MPSM stage through CBCT images. As shown in Table 7, a subject with MPSM stage C was included in the non-separation group in this study, even though a previous study described that stage C in postadolescents was a good prognostic factor.26 Overall, the results of the correlation and linear regression analysis demonstrated that the midpalatal suture opening is. Table 7. Characteristics of the subjects in the non-separation group (n = 6) Sex. Age (yr). Palate length (mm). MPSM stage. 1. Female. 34. 35.16. C. High (41.79). Class I. 2. Male. 30. 34.04. E. Average (27.54). Class III. 3. Male. 23. 35.61. D. High (38.49). Class III. 4. Female. 22. 31.67. D. Average (36.50). Class I. 5. Male. 22. 38.40. E. Average (34.59). Class III. 6. Male. 20. 37.24. D. Average (36.31). Class I. 25.17 ± 5.53. 35.35 ± 2.38. Mean ± SD. Vertical skeletal pattern. Skeletal classification. Subject No.. Vertical skeletal pattern by the SN-MP angle: low, SN-MP < 27o; average, 27o ≤ SN-MP ≤ 37o; high, SN-MP > 37o. Skeletal classification by ANB angle: Class I, 0o ≤ ANB ≤ 4o; Class II, ANB > 4o; Class III, ANB < 0o. MPSM, Midpalatal suture maturation; SD, standard deviation; SN-MP, sella-nasion-mandibular plane; ANB, point A-nasionpoint B. Refer to Figure 5 for definitions of MPSM stage.. www.e-kjo.org. https://doi.org/10.4041/kjod.2019.49.6.360. 369.
(11) Shin et al • Predictors of MARPE in adults. influenced by multiple factors. This study had some unavoidable limitations. First, the present study considered only the midpalatal suture among facial and cranial sutures and limited the affected variables to those related to the palatal bone, even though previous studies have described that the midpalatal suture opening was affected by various factors related to the surrounding structures, including the pterygomaxillary suture, the sphenoid, and the zygomatic buttress.25,28,29 In addition, for quantitative assessment of the midpalatal suture interdigitation, microcomputed tomography analysis has been considered to be more accurate than CBCT analysis.30 The evaluation of the MPSM stages in the present study can be considered as a qualitative and relative analysis method. Thus, the observed results should be interpreted with caution. Second, the small samples of subgroups in this study limited the generalizability of the results. Therefore, further studies with more samples in each subgroup will be necessary to re-evaluate the correlation with the midpalatal suture opening ratio.. CONCLUSION For MARPE in young adults, age, palate length, and MPSM, but not the MPSD ratio, showed significant negative correlations with the midpalatal suture opening ratio. Although the vertical skeletal pattern and anteroposterior skeletal classification did not show statistically significant correlations, these findings should be verified in a future study with a larger sample size. Based on the regression analysis results, we propose that age, palate length, and MPSM should be considered simultaneously as predictors of the success/failure of MARPE in young adults.. CONFLICTS OF INTEREST No potential conflict of interest relevant to this article was reported.. REFERENCES 1. Lee KJ, Park YC, Park JY, Hwang WS. Miniscrew-assisted nonsurgical palatal expansion before orthognathic surgery for a patient with severe mandibular prognathism. Am J Orthod Dentofacial Orthop 2010;137:830-9. 2. Park JJ, Park YC, Lee KJ, Cha JY, Tahk JH, Choi YJ. Skeletal and dentoalveolar changes after miniscrewassisted rapid palatal expansion in young adults: a cone-beam computed tomography study. Korean J Orthod 2017;47:77-86. 3. Jain V, Shyagali TR, Kambalyal P, Rajpara Y, Doshi. 370. J. Comparison and evaluation of stresses generated by rapid maxillary expansion and the implant-supported rapid maxillary expansion on the craniofacial structures using finite element method of stress analysis. Prog Orthod 2017;18:3. 4. Handelman CS, Wang L, BeGole EA, Haas AJ. Nonsurgical rapid maxillary expansion in adults: report on 47 cases using the Haas expander. Angle Orthod 2000;70:129-44. 5. Işeri H, Ozsoy S. Semirapid maxillary expansion--a study of long-term transverse effects in older adolescents and adults. Angle Orthod 2004;74:71-8. 6. Cunha ACD, Lee H, Nojima LI, Nojima MDCG, Lee KJ. Miniscrew-assisted rapid palatal expansion for managing arch perimeter in an adult patient. Dental Press J Orthod 2017;22:97-108. 7. Gautam P, Valiathan A, Adhikari R. Stress and displacement patterns in the craniofacial skeleton with rapid maxillary expansion: a finite element method study. Am J Orthod Dentofacial Orthop 2007;132:5. e1-11. 8. Priyadarshini J, Mahesh CM, Chandrashekar BS, Sundara A, Arun AV, Reddy VP. Stress and displacement patterns in the craniofacial skeleton with rapid maxillary expansion-a finite element method study. Prog Orthod 2017;18:17. 9. Knaup B, Yildizhan F, Wehrbein H. Age-related changes in the midpalatal suture. A histomorphometric study. J Orofac Orthop 2004;65:467-74. 10. Wehrbein H, Yildizhan F. The mid-palatal suture in young adults. A radiological-histological investigation. Eur J Orthod 2001;23:105-14. 11. Kokich VG. Age changes in the human frontozygomatic suture from 20 to 95 years. Am J Orthod 1976;69:411-30. 12. Bishara SE, Staley RN. Maxillary expansion: clinical implications. Am J Orthod Dentofacial Orthop 1987;91:3-14. 13. Mossaz CF, Byloff FK, Richter M. Unilateral and bilateral corticotomies for correction of maxillary transverse discrepancies. Eur J Orthod 1992;14:1106. 14. Timms DJ, Vero D. The relationship of rapid maxillary expansion to surgery with special reference to midpalatal synostosis. Br J Oral Surg 1981;19:18096. 15. Korbmacher H, Schilling A, Püschel K, Amling M, Kahl-Nieke B. Age-dependent three-dimensional microcomputed tomography analysis of the human midpalatal suture. J Orofac Orthop 2007;68:364-76. 16. Matsuyama Y, Motoyoshi M, Tsurumachi N, Shimizu N. Effects of palate depth, modified arm shape, and anchor screw on rapid maxillary expansion: a finite element analysis. Eur J Orthod 2015;37:188-93.. https://doi.org/10.4041/kjod.2019.49.6.360. www.e-kjo.org.
(12) Shin et al • Predictors of MARPE in adults. 17. Parcha E, Bitsanis E, Halazonetis DJ. Morphometric covariation between palatal shape and skeletal pattern in children and adolescents: a cross-sectional study. Eur J Orthod 2017;39:377-85. 18. Forster CM, Sunga E, Chung CH. Relationship between dental arch width and vertical facial morphology in untreated adults. Eur J Orthod 2008;30:28894. 19. Franchi L, Baccetti T. Transverse maxillary deficiency in Class II and Class III malocclusions: a cephalometric and morphometric study on postero-anterior films. Orthod Craniofac Res 2005;8:21-8. 20. Angelieri F, Cevidanes LH, Franchi L, Gonçalves JR, Benavides E, McNamara JA Jr. Midpalatal suture maturation: classification method for individual assessment before rapid maxillary expansion. Am J Orthod Dentofacial Orthop 2013;144:759-69. 21. Grünheid T, Larson CE, Larson BE. Midpalatal suture density ratio: a novel predictor of skeletal response to rapid maxillary expansion. Am J Orthod Dentofacial Orthop 2017;151:267-76. 22. Riedel RA. The relation of maxillary structures to cranium in malocclusion and in normal occlusion. Angle Orthod 1952;22:142-5. 23. Schudy FF. The rotation of the mandible resulting from growth: its implications in orthodontic treatment. Angle Orthod 1965;35:36-50.. www.e-kjo.org. https://doi.org/10.4041/kjod.2019.49.6.360. 24. Persson M, Thilander B. Palatal suture closure in man from 15 to 35 years of age. Am J Orthod 1977;72:42-52. 25. Melsen B, Melsen F. The postnatal development of the palatomaxillary region studied on human autopsy material. Am J Orthod 1982;82:329-42. 26. Ladewig VM, Capelozza-Filho L, Almeida-Pedrin RR, Guedes FP, de Almeida Cardoso M, de Castro Ferreira Conti AC. Tomographic evaluation of the maturation stage of the midpalatal suture in postadolescents. Am J Orthod Dentofacial Orthop 2018;153:818-24. 27. Barbosa NMV, Castro AC, Conti F, Capelozza-Filho L, Almeida-Pedrin RR, Cardoso MA. Reliability and reproducibility of the method of assessment of midpalatal suture maturation: a tomographic study. Angle Orthod 2019;89:71-7. 28. Isaacson RJ, Wood JL, Ingram AH. Forces produced by rapid maxillary expansion. Angle Orthod 1964;34:256-60. 29. Isaacson RJ, Ingram AH. Forces produced by rapid maxillary expansion. Angle Orthod 1964;34:261-70. 30. Bouxsein ML, Boyd SK, Christiansen BA, Guldberg RE, Jepsen KJ, Müller R. Guidelines for assessment of bone microstructure in rodents using micro-computed tomography. J Bone Miner Res 2010;25:146886.. 371.
(13)
수치

+4
관련 문서
