Korean Circulation Journal
Introduction
Hypertension or elevated arterial blood pressure is a substantial public health issue in industrialized societies. It is a major risk fac- tor in regards to many common causes of morbidity and mortality including stroke, myocardial infarction, congestive heart failure, and end-stage renal disease.
1)Although hypertension is linked to many diseases, it’s definite causes are still poorly understood. Various fac- tors mediate hypertension. The renin-angiotensin-aldosterone sys-
Print ISSN 1738-5520 • On-line ISSN 1738-5555
Changes of Gene Expressions in Spontaneously Hypertensive Rat Model After Losartan Treatment
Ji Hei Cha, MD 1 , Hye Ryon Lee, MD 1 , Kwan Chang Kim, MD 2 , Min-Sun Cho, MD 3 , and Young Mi Hong, MD 1
1
Departments of Pediatrics,
2Thoracic and Cardiovascular Surgery and
3Pathology, Ewha Womans University School of Medicine, Seoul, Korea
Background and Objectives: The renin angiotensin system seems to play an important role in the development of cardiac and vascular hypertrophy in hypertension. The changes in pathology, and gene expressions of the angiotensin II receptor type 1A (ATIA) and angioten- sin converting enzyme (ACE) were investigated in order to explore the effects of losartan in spontaneously hypertensive rat (SHR) models.
Materials and Methods: Twelve week-old male Wistar rats were grouped as follows: control (C) group, hypertension (H) group, and losartan (L) group in which SHR was treated with losartan (10 mg/kg/day). Western blot and reverse transcription-polymerase chain reaction anal- ysis regarding seven genes such as endothelin-1, ACE, ATIA, neutrophil cytosolic factor, brain natriuretic peptide, troponin I, endothelial nitric oxide synthase were performed.
Results: Systolic blood pressure was significantly decreased in the L group compared with the H group in weeks 3 and 5. ACE and ATIA pro- teins in the L group were lower than H group in week 5.
Conclusion: Losartan reduced blood pressure, cardiac hypertrophy and protein expressions of ACE and ATIA. Changes of protein expressions were more sensitive than changes in pathology. Further study is needed for the differing doses of losartan in SHR models. (Korean Circ J 2012;42:761-768)
KEY WORDS: Hypertension; Receptors, angiotensin; Angiotensin converting enzyme; Gene expression.
Received: April 26, 2012
Revision Received: March 31, 2012 Accepted: June 4, 2012
Correspondence: Young Mi Hong, MD, Department of Pediatrics, Ewha Womans University School of Medicine, 1071 Anyangcheon-ro, Yangcheon- gu, Seoul 158-710, Korea
Tel: 82-2-2650-2841, Fax: 82-2-2653-3778 E-mail: [email protected]
• The authors have no financial conflicts of interest.
This is an Open Access article distributed under the terms of the Creative Commons Attribution Non-Commercial License (http://creativecommons.
org/licenses/by-nc/3.0) which permits unrestricted non-commercial use, distribution, and reproduction in any medium, provided the original work is properly cited.
tem (RAAS) seems to play a key role in the development of hyper- tension.
2)The principle mediator regarding the physiological ac- tions of the RAAS is the octapeptide angiotensin (QAT).
3)There is considerable evidence supporting the involvement for the inappro- priately elevated levels of angiotensin (AT) II in many forms of hy- pertension.
4)Angiotensin II is intimately involved in many regulatory mechani- sms in the cardiovascular system beside blood pressure. It stimu- lates the proliferation of smooth muscle cells (SMCs) in the arterial wall,
5)enhances collagen deposition, influences matrix compo- nents,
6)7)alters structure and thickness of the arterial wall in both resistant as well as conduit arteries, modulates sympathetic activity,
8)stimulates endothelin (ET)-1 release from vascular endothelium and tunica adventitia,
9)and influences bioavailability of nitric oxide and endothelial functions.
10)Pathological alterations in the majority of these regulatory sys- tems were observed in hypertension. Most of the known AT II effects are mediated via the AT II receptor type 1A (ATIA) and therefore ad- ministration of an AT receptor blocker offers the possibility to modify numerous AT II actions within the cardiovascular system.
The spontaneously hypertensive rats (SHR) of the Okamoto-Aoki
strain were developed by the selective breeding of Wistar-Kyoto stock for higher blood pressure.
11)SHRs spontaneously and consis- tently develop moderate-to-severe hypertension between 7 and 15 weeks of age and have served as models of genetic hypertension in humans. Several studies were reported in SHR models.
12-19)Losartan is a highly specific, non-peptide antagonist of the AT II receptor type 1.
4)AT II receptor antagonists are a group of drugs that are used in the treatment of hypertension. Their mechanism of action involves the specific blockade of AT II receptors, which in- hibits vasoconstriction and prevents vascular and cardiac hyper- trophy. There have been several articles concerning the effect of losartan in the SHR model.
12-19)The effects were different depending on the dose of losartan. How- ever, there were rare reports with regards to gene changes.
The purpose of this study was to investigate the changes in pa- thology, and gene expressions of ATIA, and the angiotensin con- verting enzyme (ACE) in SHR models after losartan treatment.
Materials and Methods
Materials
Twelve-week-old male Wister-Kyoto rats, weighing approxima- tely were used for this study. All rats were housed in climate-con- trolled conditions with a 12 hours light: 12 hours dark cycle, and had free access to chow and water.
The rats were grouped as follows: control (C) group (n=18), hy- pertension (H) group (n=18), losartan (L) group (n=18) in which lo- sartan was administrated daily by gavage in a dose of 10 mg/kg/day.
The rats were sacrificed in weeks 3 and 5. The heart and kidney tissues were removed and immediately frozen at -70°C for protein and gene analysis, post-fixed in 10% formalin, and processed rou- tinely for paraffin embedding. All protocols were approved by the Institutional Animal Care and Use Committees of the School of Medicine of Ewha Womans University (approval No. 11-0169).
Methods
Organ weights
The rats were weighed and their general appearance was observ- ed during the study period. The animals were sacrificed at the sch- eduled time and the hearts and kidneys were rapidly removed. The wet weights of the left ventricle (LV) and kidney were measured, and the ratio of organ weight to body weight (BW) was calculated.
Estimation of systemic blood pressure
The animals were placed in the supine position and instrumented with an arterial pressure line (Physiological Pressure Transducer, MLT
1199; AD Instruments, Oxfordshire, UK). Arterial pressures were es- timated using the input from an ambient-pressure reference (APR-1;
Data Sciences) on day 1 in weeks 3 and 5.
Morphometric analysis of the heart tissues
LV including the interventricular septum was weighed after the ri- ght and left atria and the right ventricular free wall was dissected.
The LV mass index was calculated by dividing the LV weight by the BW of each animal. The LV heart tissue was fixed in formaldehyde and embedded as a paraffin section in all three groups. Masson’s Trichrome staining was used in order to observe the degree of fibro- sis (i.e., degree of collagen penetrating the heart tissue). The area with the most and least degree of fibrosis within each group was select- ed and photographed under 200 HPF light microscopy. The photo- graphs were processed through an image analysis program (analySIS) and the area of collagen penetration, i.e., the area stained blue with Masson’s Trichrome staining was measured.
Ribonucleic acid extraction and complementary deoxyribonucleic acid synthesis
Total ribonucleic acid (RNA) was extracted by using TRIzol Reag- ent
TM(Invitrogen, Carlsbad, CA, USA), according to the Trizol meth- od protocol and resuspended in diethyl pyrocarbonate water. The fi- nal RNA amount was spectrophotometrically determined at 260/280 nm. Quality was assessed as the absence of smear for 18S and 28S bands analyzed by means of Bio analyzer 2100 (Agilent technologies, Palo Alto, CA, USA). RNA samples were stored at -70°C prior to usage.
complementary deoxyribonucleic acid (cDNA) synthesis were syn- thesized by 1 μg of total RNA, according to the manufacture’s proto- col (Hight Capacity RNA-to-cDNA kit, Appllied Biosystems, Foster City, CA, USA).
20)Gene expression analysis by a real time reverse transcription-polymerase chain reaction
Real-time quantitative polymerase chain reaction (PCR) was per-
formed in triplicate in 384-well plates. A 384-well high-through-
put analysis was performed by using the ABI Prism 7900 Sequence
Detection System Software (Applied Biosystems, Foster City, CA,
USA) and white colored 384-well plates (ABgene, Hamburg, Ger-
many) for intensification of the fluorescent signals by a factor of
three. The system operated using a thermal cycler and a laser that is
directed via fiber optics to each of the 384 sample wells. Fluores-
cent emissions from each sample were collected by a charge-cou-
pled device-camera and the quantitative data were analyzed using
the Sequence Detection System Software (SDS version 2.0, Applied
Biosystems, Foster City, CA, USA). Reaction mixtures contained 10
pmol/μL of each primer and 2X SYBR Green PCR Master Mix (Applied
Biosystems, Foster City, CA, USA), which included the HotStarTaqt DNA-Polymerase in an optimized buffer, the dNTP mix (with dUTP ad- ditive), the SYBRs Green I fluorescent dye, and ROX dye as a passive reference. Each of the 384-well real-time quantitative PCR plates included serial dilutions (1, 1/2 and 1/4) of cDNA, which were used to generate relative standard curves for genes.
20)The resulting first-strand of cDNA normalized by the glyceralde- hyde 3-phosphate dehydrogenase (GAPDH) gene. The normalized cDNA was used as a template for the PCR process. The specific prim- ers for rat ET-1 were 5’-TCTCGGAGAG CAGAGACACA-3’ (forward) and 5’-TGGACTTTGGA GTTTC TCCCT-3’ (reverse).
The specific primers for ACE were 5’-GCC CAC CGA CTC TAC AAC AT-3’ (forward) and 5’-ATG GGA CAC TCC TCT GTT GG-3’ (reverse).
The specific primers for AT1A were 5’-CTGCGGTGATGTCACTAT GG-3’ (forward) and 5’-AAATGTCCTCGTGGTAGGGT-3’ (reverse).
The specific primers for neurophil cytosolic factor (NCF) 1were 5’- GGC CAA AGA TGG CAA GAA TA-3’ (forward) and 5’-ACC CTT CTC GTA GTC AGC GA-3’ (reverse).
All primers were amplified using the same conditions. Thermal cy- cling conditions included 2 minutes in 50˚C, 10 minutes in 95˚C, followed by 40 cycles at 95˚C for 30 seconds and 60˚C for 30 sec- onds, and 72˚C for 30 seconds. In order to exclude the presence of unspecific products, a melting curve analysis regarding the prod- ucts was performed routinely after finishing amplification through high-resolution data collection during an incremental temperature increase from 60˚C to 95˚C with a ramp rate of 0.21˚C/sec. We then converted real-time PCR cycle numbers to gene amounts (ng) ac- cording to the equation. The real-time PCR analysis was performed on an Applied Biosystems Prism 7900 Sequence Detection System (PE Applied Biosystems, Foster City, CA, USA).
Westernblot analysis
The tissue was homogenized in a 10 mM Tris HCl buffer, pH 7.4 containing 0.5 mM ethylenediaminetetraacetic acid, pH 8.0, 0.25 M sucrose, 1 mM PMSF, 1 mM Na
4VO
3and a protease inhibitor cock- tail (Roche-Boehringer-Mannheim). After centrifugation, the super- natant was subjected to sodium dodecyl sulfate polyacrylamide gel electrophoresis (SDS-PAGE). Samples equivalent to 25 μg of pro- tein content were loaded and separated by size in 10% SDS-PAGE.
The proteins on the acrylamide gel were transferred to a polyvinyl- idene difluoride membrane (Millipore, Bedford, MA, USA) at 400 mA in a transfer buffer containing 25 mM Tris and 192 mM glycine, pH 8.4. The peripheral vascular disease membranes were blocked in TBS with 5% non-fat dry milk at room temperature for 1 hour in 0.1% Tween 20 and incubated with the appropriate primary anti- bodies, including ET-1, ACE, ATIA, NCF, endothelial nitric oxide syn- thase (eNOS), brain natriuretic peptide (BNP), troponin I (Cell Sig-
naling Technology Inc., Danvers, MA, USA) and GAPDH (Santa Cruz Biotechnology, Inc., Santa Cruz, CA, USA) at 4˚C overnight. The mem- brane was incubated with a horseradish peroxidase-conjugated secondary antibody (Cell Signaling Technology Inc., Danvers, MA, USA) for 1 hour at room temperature. After undergoing washing, the membrane was visualized by a chemiluminescent reaction using an enhanced chemiluminescence-detection kit system (Amersham Biosciences, Buckinghamshire, UK).
The cell lysate from the solubilized tissue was mixed with Pierce BCA reagents (Pierce, Rockford, IL, USA) and incubated for 30 min- utes. Moreover, the protein content was quantified with a Molecular Devices enzyme linked immuno sorbent assay reader (Amersham Phar- macia Biotechnology, Sunnyvale, CA, USA) at 562 nm based on the bovine serum albumin standard curve.
Statistical analysis
Results were expressed as the mean±standard deviation. An un- paired two-tailed t-test and Mann-Whitney test were used, and a p of less than 0.05 was considered statistically significant. Statistical Package for the Social Sciences (SPSS) 12.0 for Windows (SPSS, Chi- cago, IL, USA) was used for all statistical analyses.
Results
Systemic blood pressure after losartan treatment
Blood pressure was significantly higher in the H group compared with the C group on day 1 (219.8±10.5 mm Hg vs. 130.7±5.8 mm Hg, p<0.05), in week 3 (211.5±16.1 mm Hg vs. 131.3±7.4 mm Hg, p<
0.05), and week 5 (221.2±14.2 mm Hg vs. 175±6.2 mm Hg, p<0.05).
Blood pressure was significantly lower in the L group compared with the H group in week 3 (147.7±7.5 mm Hg, p<0.05) and week 5 (139.0±16.9 mm Hg, p<0.05) (Fig. 1).
Body weight, left heart, left heart/body weight ratio, kidney weight, kidney/body weight ratio after losartan treatment
Body weight was statistically lower in the H group compared with the C group in week 3 (327.7±24.7 g vs. 474.8±12.9 g, p<0.05) and week 5 (320±10.2 g vs. 480±27.2 g, p<0.05).
Left heart (LH) weight was significantly higher in the H group compared with the C group (0.98±0.08 g vs. 0.84±0.01 g, p<0.05) in week 3 and significantly decreased in the L group compared with the H group in week 3 (0.88±0.01 g vs. 0.98±0.08 g, p<0.05).
Kidney/BW ratio was significantly higher in the H group compared
with the C group in week 5 (0.40±0.02 g vs. 0.32±001 g, p<0.05)
and significantly decreased in the L group compared with H group
in week 5 (0.37±0.01 vs. 0.40±0.02, p<0.05) (Table 1).
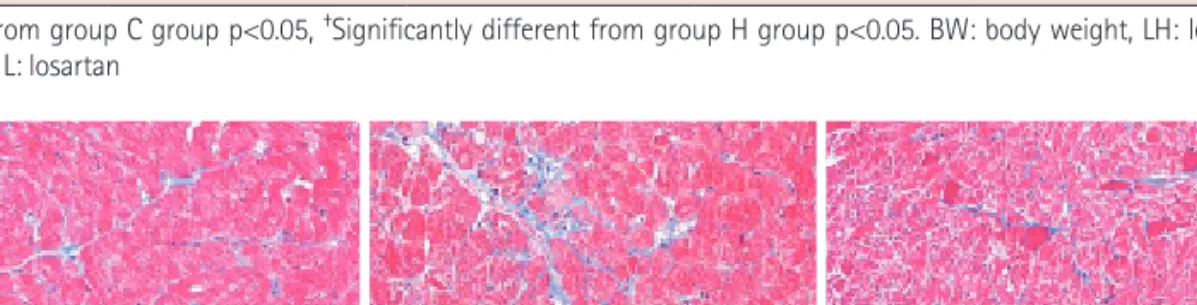
Pathologic finding in heart tissues
Under light microscopy, collagen was observed to penetrate be- tween the LV myocardiocytes, staining blue as noted in Fig. 2. The degree of penetration was not equally dispersed and differed in each area. Most areas presented little collagen infiltration and these
areas were similar in each group. By quantitative analysis, collagen penetration in the H group was significantly higher than that in the C group (1280.8±863.1 vs. 457.1±270.2, p<0.05).
There was no statistically significant difference between the H and the L group but the L group showed a slight decrease in colla- gen (Table 2).
Serum renin levels after losartan treatment
Serum renin levels were significantly higher in the H group com- pared with the C group in week 3 (9.6±2.3 ng/mL/hr vs. 5.4±1.5 ng/
mL/hr, p<0.05) and week 5 (8.0±2.5 ng/mL/hr vs. 4.0±0.9 ng/mL/
hr, p<0.05). Also, there was no significant difference between the L and H group (Fig. 3A).
Serum aldosterone levels after losartan treatment
Serum aldosterone levels were significantly higher in the H group compared with the C group in week 5 (78.5±5.3 pg/mL vs. 36.5±9.0 pg/mL, p<0.05) and significantly lower in the L group (65.2±2.8 pg/
mL, p<0.05) compared with the H group in week 5 (Fig. 3B).
Fig. 1. Systemic blood pressures after losartan treatment. Blood pressure was significantly higher in the H group compared with the C group on day 1, week 3, and week 5. Blood pressure was significantly lower in the L group compared with the H group in weeks 3 and 5. *Significantly different from group C group p<0.05,
†Significantly different from group H group p
<0.05. C: control, H: hypertension, L: losartan.
Bl oo d pr es su re (m m H g)
1 day 3 week 5 week
* * *
† †
C group H group L group 250
200
150
100
50
0
Table 1. Body, weight LH, LH/BW, KD and KD/BW after losartan treatment
Group BW (g) LH (g) LH/BW KD (g) KD/BW
3 week C 474.8±12.9 0.84±0.01 0.18±0.02 1.53±0.1 0.33±0.07
H 327.7±24.7* 0.98±0.08* 0.30±0.06* 1.14±0.07 0.35±0.02
L 340.1±31.6* 0.88±0.01
†0.27±0.07 1.33±0.07 0.36±0.01
5 week C 480±27.2 0.86±0.06 0.18±0.01 1.49±0.06 0.32±0.01
H 320±10.2* 0.93±0.08 0.29±0.08* 1.25±0.01 0.40±0.02*
L 322.8±6.8* 0.88±0.04 0.26±0.07 1.22±0.08 0.37±0.018
†*Significantly different from group C group p<0.05,
†Significantly different from group H group p<0.05. BW: body weight, LH: left heart, KD: kidney, C:
control, H: hypertension, L: losartan
Fig. 2. Change of collagen by Masson’s Trichrome staining in the heart tissues (×200). Collagen penetration in the H group was significantly higher than that in the C group. There was no statistically significant difference between the H and the L group but the L group showed a slight decrease in collagen. C:
control, H: hypertension, L: losartan.
Table 2. Change of collagen by Masson’s Trichrome staining in the heart tissues
C group H group L group
457.1±270.2 1280.8±863.1* 880.1±370.3
*Significantly different from group C group p<0.05. C: control, H: hyper- tension, L: losartan
C group H group L group
Serum angiotensin converting enzyme levels after losartan treatment
Serum ACE level did not significantly differ among the three gr- oups (Fig. 3C).
Serum angiotensin levels after losartan treatment
Serum AT levels were significantly higher in the H group com- pared with the C group on day 1 (1.18±0.23 pg/mL vs. 0.57±0.34 pg/mL, p<0.05), in week 3 (3.66±2.2 pg/mL vs. 0.59±0.18 pg/mL, p<0.05) and week 5 (3.1±1.78 pg/mL vs. 0.52±0.16 pg/mL, p<0.05).
In addition, the serum AT level in the L group was significantly lower than that in the H group on day 1 (0.75±0.08 pg/mL in week 3 (0.60±
0.2 pg/mL, p<0.05) and week 5 (0.9±0.51 pg/mL, p<0.05) (Fig. 3D).
Serum high sensitive C-reactive protein
Serum high sensitive-C reactive protein (hs-CRP) levels were sig-
nificantly decreased in week 3 in the L group compared with the H group (p<0.05) (Table 3).
Gene expressions levels of angiotensin converting enzyme, angiotensin II receptor type IA and the neutrophil cytosolic factor in week 5
Angiotensin II receptor type 1A and NCF gene expressions were significantly higher in the H group (p<0.05) (Table 4). NCF gene ex- pressions were significantly decreased in the L group compared with the H group (p<0.05) (Table 4).
Endothelin-1, angiotensin converting enzyme, angiotensin II receptor type IA and neurophil cytosolic factor 1 protein contents by western blot analysis in the heart tissues
Endothelin-1 protein contents were not different among the three groups (Fig. 4A).
Fig. 3. Serum renin (A), aldosterone (B), ACE (C), angiotensin (D) levels after losartan treatment. *Significantly different from group C group p<0.05,
†Sig- nificantly different from group H group p<0.05. C: control, H: hypertension, L: losartan.
*
*
*
*
*
*
†
†
† †
C group H group L group
C group H group L group
C group H group L group
C group H group L group
Se ru m re ni n le ve l ( ng /m L/ hr ) Se ru m A CE le ve l ( U/ m L)
1 day 3 week 5 week
1 day 3 week 5 week 20
15
10
5
0
80 70 60 50 40 30 20 10 0
Se ru m a ld os te ro ne le ve l ( pg /m L) Se ru m a ng io te ns in le ve l ( pg /m L)
1 day 3 week 5 week
1 day 3 week 5 week 90
80 70 60 50 40 30 20 10 0
7
6
5
4
3
2
1
0
A
C
B
D
Angiotensin converting enzyme protein content was significantly higher in the H group compared with that in the C group in weeks 3 and 5 (p<0.05) and significantly lower in the L group compared with the H group in week 5 (p<0.05) (Fig. 4B).
The ATIA protein level was significantly higher in the H group compared with the C group in weeks 3 and 5 (p<0.05) and signifi- cantly lower in the L group compared with the H group in week 5 (p<0.05) (Fig. 4C). NCF 1 protein contents were significantly higher in the H group compared with the C group in weeks 3 and 5 (p<
0.05) and significantly lower in the L group compared with the H group in week 5 (p<0.05) (Fig. 4D).
Brain natriuretic peptide, troponin I and endothelial nitric oxide synthase protein contents by western blot analysis in the heart tissues
Brain natriuretic peptide and troponin I protein contents were significantly higher in the H group compared with the C group in week 5 (p<0.05) but there was no difference between the H group and the L group. eNOS protein contents were significantly higher in the H group compared with the C group in weeks 3 and 5 (p<0.05), but there was no difference between the H group and the L group (data was not shown).
Discussion
We demonstrated hypertension-related cardiac changes in the Table 4. Gene expression levels of ACE, ATIA and NCF1 in the heart tissues in week 5
ACE C group 1.34±0.24
H group 0.77±0.08
L group 0.80±0.15
AT 1A C group 1.20±0.20
H group 1.74±0.16*
L group 1.49±0.24
NCF1 C group 0.97±0.11
H group 1.89±0.05*
L group 1.30±0.24
†*Significantly different from group C group p<0.05,
†Significantly different from group H group p<0.05. ACE: angiotensin converting enzyme, AT: an- giotensin, NCF: neutrophil cytosolic factor, C: control, H: hypertension, L:
losartan
Fig. 4. Endotehlin-1 (A), ACE (B), angiotensin II receptor type 1A (C), neu- trophil cytosolic factor 1 (D) protein contents by western blot analysis in the heart tissues. *Significantly different from group C group p<0.05,
†sig- nificantly different from group H group p<0.05. ET: endothelin, ACE: angio- tensin converting enzyme, AT: angiotensin, NCF: neutrophil cytosolic factor;
C: control, H: hypertension, L: losartan.
* *
*
*
*
*
*
*
†
†
En do th el in -1 AC E AT IA N CF En do th el in -1 AC E AT IA N CF
C H L C H L
C H L
C H L
C H L
C H L
C H L
C H L
C H L C H L
C H L
C H L
C H L
C H L
C H L
C H L 0.75
0.50
0.25
0.00
0.75
0.50
0.25
0.00
1.5
1.0
0.5
0.0
0.75
0.50
0.25
0.00 3W Gapdh
3W Gapdh
3W Gapdh
3W Gapdh
5W Gapdh
5W Gapdh
5W Gapdh
5W Gapdh 1.00
0.75 0.50 0.25 0.00
1.00 0.75 0.50 0.25 0.00
1.00 0.75 0.50 0.25 0.00
1.00 0.75 0.50 0.25 0.00
A
B
C
D Table 3. Serum hs-CRP level after losartan treatment (mg/L)
Week C group H group L group
3 0.60±0.05 0.6±0.02 0.51±0.23
†5 0.66±0.05 0.62±0.03 0.56±0.02
†
Significantly different from group H group p<0.05. C: control, H: hyperten- sion, L: losartan, hs-CRP: high sensitive-C reactive protein
†