337
Korean Circulation J 2006;36:337-342 ⓒ 2006, The Korean Society of Circulation
Association between the Serum Osteoprotegerin Level and Target Lesion Calcium in Coronary Artery Disease
Chul-Soo Park, MD1,3,4,7, Wook-Sung Chung, MD, PhD1,3,4,7, Ho-Joong Youn, MD, PhD1,3,4,7, Yong-Ju Shin, MD2,3,4,7, Ji-Hoon Kim, MD1,3,4,7, Yong-Seog Oh, MD1,3,4,7, Ki-Bae Seung, MD, PhD1,3,5,7,
Jae-Hyung Kim, MD, PhD1,3,6, Kyu-Bo Choi, MD, PhD1,3,5,7 and Soon-Jo Hong, MD, PhD1,3,4,7
1Division of Cardiology, 2Division of Rheumatology, 3Department of Internal Medicine, 4Saint Mary’s Hospital,
5Kangnam Saint Mary’s Hosipital, 6Saint Paul’s Hospital and 7College of Medicine, The Catholic University of Korea, Seoul, Korea
ABSTRACT
Background and Objectives:Osteoprotegerin (OPG) is a decoy receptor for receptor nuclear factor-kB ligand (RANKL). We sought to evaluate the association between the serum OPG level and the target lesion calcium (TLC) in those patients suffering with coronary artery disease (CAD). Subjects and Methods:We assayed the serum OPG levels in 65 CAD patients (mean age: 62±10 yrs, M:F=46:19) with using enzyme immunoassay, and these patient underwent intravascular ultrasound (IVUS) examinations of their target lesions. The degree of TLC was estimated by the maximum arc of calcium and also the calcified plaque surface area that was calculated from the serial cross-section IVUS images. Results:The median serum OPG levels were greater in the subjects with TLC than in the subjects without TLC (1.36 vs 0.95 ng/mL, respectively, p<0.05). Significant correlation was noted between the serum OPG levels and the maximum arc of calcium (r=0.274, p=0.027). The median serum OPG levels were significantly increased more in the subjects who had a maximum arc of calcium ranging from 90 to 180 degrees than in those subjects who had a maximum arc of calcium less than 90 degrees (1.63 vs 1.14 ng/mL, res- pectively, p<0.05) and the median serum OPG levels were also increased more in the subjects who fell within the second tertile of the calcified plaque surface area than that in those subjects who fell within the first and third tertile (0.96, 1.53, 1.40 ng/mL for the first, second, third tertile, respectively, p<0.05). On the stepwise multiva- riate logistic regression analysis, the serum OPG level remained a risk factor for TLC after adjustment was made for the other risk factors such as age, diabetes mellitus, HbA1C and a smoking history (p=0.019, odds ratio 5.208 [95% confidence interval: 1.308-20.744]). Conclusion:In patients with CAD, an increased serum OPG level is associated with target lesion calcification. (Korean Circulation J 2006;36:337-342)
KEY WORDS:Osteoprotegerin;Coronary artery disease.
Introduction
When performing percutaneous coronary interven- tion(PCI), the presence of coronary calcification is asso- ciated with other unfavorable lesion morphologies, and it is related to procedural complications and failure for successful balloon dilation.1)2) Target lesion calcification is also associated with suboptimal stent expansion3) and stent thrombosis.4) Coronary calcification is associated with the patients’ age and with the presence and severity
of atherosclerosis.5-9) In addition, endochondral bone formation in coronary arteries has been suggested as a possible mechanism of coronary calcification,10) and many bone regulatory factors have been identified in calcified atherosclerotic lesion, which suggests a regu- latory role of the osteogenic factors for vascular calcifi- cation.11)12)
Osteoprotegerin(OPG) and receptor activator of nu- clear factor-κB ligand(RANKL) are both novel mem- bers of the tumor necrosis factor(TNF) receptor signa- ling family, and this family constitutes the final effectors of osteoclast function. Therefore, they represent the essential regulators of bone mass and bone homeo- stasis.13)
Even though OPG deficient mice developed both severe osteoporosis and medial arterial calcification of the aorta and renal arteries,14) the association between
Received:August 26, 2005
Revision Received:December 5, 2005 Accepted:December 21, 2005
Correspondence:Chul-Soo Park, MD,Saint Mary’s Hospital, Yeouido- dong, Yeongdeungpo-gu, Seoul 150-713, Korea
Tel: 82-2-3779-1325, Fax: 82-2-3779-1374 E-mail: [email protected]
coronary calcification in humans and OPG remains unclear. Therefore, we evaluated the relationship bet- ween the serum OPG level and target lesion calcium in those patients with coronary artery disease(CAD) by assessing the lesions with intravascular ultrasound (IVUS) while we were performing PCI.
Subjects and Methods
From March 2003 to August 2004, we recruited 65 sequential patients, including 7 cases of acute myocar- dial infarction, 11 cases of unstable angina and 47 cases of stable angina, and all these patients underwent in- travascular ultrasound(IVUS) examination before their PCI procedures. 59 lesions were de novo and 6 were restenosis lesions. The patients’ blood pressure, body mass index(BMI) and their hematological and bioche- mical profile were determined at the time of their phy- sical examination. The patients with a past history or present illness of thyroid disease, parathyroid disease, a nephropathy condition with a serum creatinine level
>2.0 mg/dl or a tumor involving bone, and also those patients with abnormal serum calcium and phospho- rous levels were excluded from the present study.
The patients were considered as having type 2 dia- betes mellitus(DM) if they were being treated with insulin or oral hypoglycemic agents, or if they had a fasting glucose level ≥126 mg/dL. The subjects with persistent elevated blood pressure(≥140/90 mmHg) or those subjects who were taking antihypertensive medica- tions were classified as hypertensive. This study was appro- ved by our institutional review committee; the subjects were informed of the investigative nature of this study and a written consent was obtained before study entry.
Evaluation of target lesion calcium(TLC) with using intravascular ultrasound(IVUS)
IVUS was performed with a standard 3.2 Fr, 30-MHz ultrasound catheter(Cardiovascular Imaging Systems, SciMed/Boston Scientific, Minneapolis, Minnesota) that was advanced over a 0.014-inch guidewire. The IVUS
catheter uses a movable transducer within the catheter sheath that allowed accurate, reproducible translation of the transducer at the tip of the catheter when this was used in conjunction with a motorized pullback device (Cardiovascular Imaging Systems, SciMed/Boston Scien- tific).
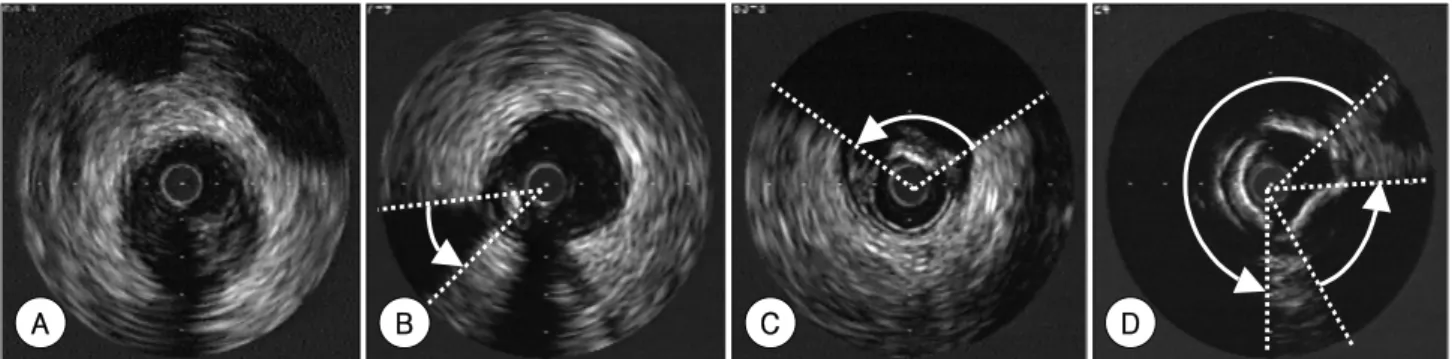
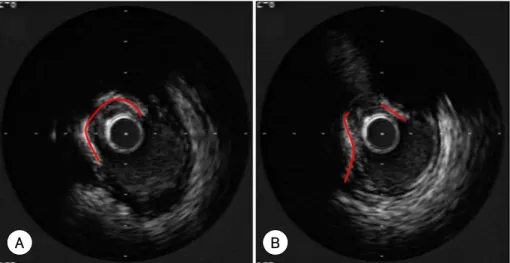
For the patients suffering with acute myocardial in- farction, the target lesion was the infarct-related lesion that was identified by the combination of left ventricular wall motion abnormality, the ECG findings and the angiographically determined lesion morphology. For the patients with multivessel disease, the lesions with a more severe diameter stenosis that were eligible for PCI were selected as the target lesions, but any chronic total occlu- sions were excluded. The lesion site selected for analysis was that lesion-image slice having the largest arc of cal- cium. Calcium was identified by its distinctly bright echo- genic appearance with the corresponding acoustic sha- dowing(Fig. 1B, C). The degree of TLC was estimated by measuring the largest arc of calcium with a protrac- tor that was centered on the lumen. When multiple calcium deposits were observed and/or the arcs of cal- cium were interrupted, all the arc angles were summed (Fig. 1D). To quantify the TLC, we also measured the calcified plaque surface area as reported by Scott et al.15) The calcified plaque-lumen circumferential lengths were measured from the digitalized serial IVUS images that were taken 1.0 mm apart; with using Simpson’s method, the calcified plaque surface area was then calculated (Fig. 2).
Serum OPG measurement
Blood samples were collected and stored at -80℃ un- til use. The serum OPG levels were determined by using a sandwich ELISA(DuoSet ELISA, R & D system, Min- neapolis, Minnesota). Mouse anti-human OPG was used to capture the OPG from the serum. The captured OPG was then detected with biotinylated goat antihuman OPG monoclonal antibody and a tetramethylbenzidine substrate. All the samples were measured in duplicate and the results were averaged.
Fig. 1. Measurement of the maximum arc of calcium on the most severely calcified image slices of the target lesions with using a protractor centered on the lumen. Fig. A shows the non calcified soft plaque. In Figs. B and C, the maximum arcs of calcium were 15°and 115°, respectively. If multiple calcium deposits were found, all the arcs were summed, as is shown in Fig. D and the summed arc of calcium was 295°.
A B C D
Statistical analysis
The results were expressed as means±SDs or as me- dians with inter-quartile ranges(IQR), according to the characteristics of the continuous variables. Comparisons between the groups for the study variables were done with using unpaired Student’s t tests or the Mann-Whit- ney test. The relationships between the largest arcs of TLC and serum OPG levels were evaluated by bivariated correlation analysis, and Pearson’s correlation coeffi- cient was then calculated. According to the maximum arc of the TLC(≤90°, >90°and ≤180°, >180°) and also the calcified plaque surface area(first, second or third tertile), the lesions were subdivided and analyzed by performing Kruskal-Wallis test. Finally, stepwise lo- gistic regression analysis was used to compute the odds ratios(OR) and the 95% confidence intervals(CI) with the presence of TLC as the dependent variable and the serum OPG levels as the explanatory variable. All the statistical analyses were conducted using SPSS 13.0 for the Windows package.
Results
The study group included 46 men and 19 women, and their ages ranged from 28 to 84 years(mean age:
62±10 years). The mean value of the BMI was 25.0±
2.6 kg/m2. On the basis of the IVUS evaluation, 16 pa- tients were categorized as being subjects without TLCs, and 49 patients were with TLCs. The characteristics of the 2 groups are given in Table 1. The patients with mul- tivessel disease had a higher prevalence of TLC than those patients with one vessel disease(51% vs 19%, res- pectively, p<0.05). However, there were no significant differences in the other risk factors, including age, BMI, DM, hypertension, a smoking history, the lipid profile and the hemoglobin A1c(HbA1c) levels between the two groups.
The median serum OPG levels were significantly hig- her in the patients with TLCs than in those patients without TLCs(median-IQR [ng/mL]: 0.95-0.67 to 1.25 vs. 1.36-0.89 to 1.81, respectively, p<0.05)(Fig. 3). The serum OPG levels were significantly positively correlated with the target lesions’ maximum arcs of calcium(r=
0.274, p<0.05)(Fig. 4). However, according to the sub- division of the maximum arcs of calcium(≤90°, >90°
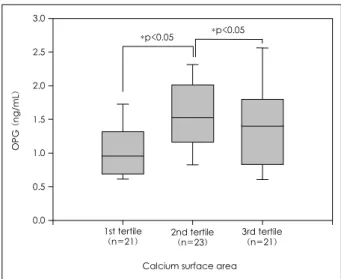
and ≤180°, >180°), the difference was only signifi- cant between the group having arcs less than 90°and those patients with arcs more than 90°and less than 180°(median-IQR [ng/mL]: 1.14-0.84 to 1.44 vs. 1.63- 1.12 to 2.07, respectively, p<0.05)(Fig. 5). According to the subdivision of the calcified plaque surface area, the serum OPG level was significantly increased in the second tertile group more than that of first or third ter- tile groups(median-IQR [ng/mL]: 0.96-0.69 to 1.32 in
Table 1. Patients’ characteristics according to target lesion calcium Variables No TLC (n=16) TLC (n=49) p
Age (yrs) 057±13 63±9 0.093*
Female gender (%) 4 (25) 15 (31) 0.361*
BMI (Kg/m2) 25.5±2.3 24.8±2.8 0.381*
DM (%) 1 (06) 14 (29) 0.091*
HTN (%) 9 (56) 25 (51) 0.779*
Smoking history (%) 9 (56) 15 (31) 0.080*
TC (mg/dL) 188±55 183±42 0.699*
TG (mg/dL) 115±80 124±58 0.664*
HDL (mg/dL) 34±6 038±10 0.187*
HbA1c (%) 05.7±1.0 06.3±1.2 0.099*
LAD (%) 14 (88) 46 (94) 0.509*
Left main disease (%) 02 (13) 09 (18) 0.718*
Multivessel disease (%) 03 (19) 25 (51) 0.022*
Data are means±SDs. BMI: body mass index, DM: diabetes mellitus, HTN: hypertension, TC: total cholesterol, TG: triglyceride, HDL:
high density lipoprotein cholesterol, LAD: left anterior descending coronary artery, TLC: target lesion calcium
Fig. 2. Measurement of calcified plaque surface area. Fig. A and B are serial IVUS image slices 1.0 mm apart. The red lines represent the calcified plaque-lumen circumference. The calcium surface area is measured with the sum of the calcified plaque-lumen circumference length in the target lesion. IVUS: intravascular ultrasound.
A B
the first tertile group vs 1.53-1.16 to 2.02 in second ter- tile group vs 1.40-0.83 to 1.80 in the third tertile group, p<0.05)(Fig. 6). On the stepwise multiple regression analysis, the serum OPG levels were independently asso- ciated with TLC, and with an OR of 5.21(95% CI: 1.31 to 20.74; p=0.019), after adjusting for age, type 2 DM, HbA1c and a smoking history(Table 2).
Discussion
The OPG and RANKL system plays an important role in bone homeostasis, and its role in vascular biology has recently received more attention. OPG is produced by a variety of tissues, including the cardiovascular system (heart, arteries and veins), lung, kidney, immune tis- sues and bone,13)16) and elevated serum OPG levels have been associated with cardiovascular death in elderly wo- men,17) the presence and severity of CAD18)19) and the progression of vascular calcification in hemodialysis pa- tients.20)21) The major finding of the present study is that the serum OPG levels were independently associated
Table 2. Stepwise multiple regression analysis for the variables asso- ciated with TLC
Odds ratio (95% CI) p Independent variables
OPG 5.208 (1.308-20.744) 0.019
Excluded variables
Age 0.142
DM 0.124
HbA1C 0.153
Smoking history 0.098
CI: confidence interval, OPG: osteoprotegerin, DM: diabetes mellitus, HbA1C: glycosylated hemoglobin, TLC: target lesion calcium
Calcium surface area
OPG (ng/mL)
0.0 0.5 1.0 1.5 2.0 2.5 3.0
1st tertile
(n=21) 2nd tertile
(n=23) 3rd tertile (n=21)
*p<0.05 *p<0.05
Fig. 6. The serum osteoprotegerin levels according to the subdivision by the calcified plaque surface area of the target lesions. The central line represents the distribution median, the boxes span from the 25th to the 75th percentiles, and the error bars extend from the 10th to the 90th percentiles. OPG: osteoprotegerin.
No calcium (n=16) Calcium (n=49)
OPG (ng/mL)
0.0 0.5 1.0 1.5 2.0 2.5 3.0
*p<0.05
Fig. 3. The serum levels of osteoprotegerin according to the presence or absence of target lesion calcium. The central line represents the dis- tribution median, the boxes span from the 25th to the 75th percen- tiles, and the error bars extend from the 10th to the 90th percentiles.
OPG: osteoprotegerin.
Maximum arc of calcium (degrees)
0 100 200 300 400
OPG (ng/mL)
0 1 2 3 4
p=0.027 r=0.274
Fig. 4. The correlation between the maximum arcs of calcium in the target lesions and serum osteoprotegerin levels. OPG: osteoprotegerin.
≤90 (n=31) 90< ≤180 (n=18) >180 (n=16) Maxium arc of calcium (degrees)
OPG (ng/mL)
0.0 0.5 1.0 1.5 2.0 2.5
3.0 *p<0.05
Fig. 5. The serum osteoprotegerin levels subdivided by the maximum arcs of calcium (≤90°, 90°and ≤180°, >180°) of the target lesions.
The central line represents the distribution median, the boxes span from the 25th to the 75th percentiles, and the error bars extend from the 10th to the 90th percentiles. OPG: osteoprotegerin.
with TLC after adjusting for age, which is known to be a strong predictor of coronary calcification.
Even though the serum level of OPG is often increa- sed with vascular disease, the tissue level of OPG seems to be quite different. The expression of OPG has been reported to be decreased in calcific arotic valves22) and in human calcified atheroslcerotic arteries;12)23) further, OPG and TRAIL(TNF related apoptosis inducing li- gand) have recently been concurrently detected in the calcified regions of atherosclerotic arteries.24)
Until now, it is unclear why the serum and tissue le- vels of OPG are different, and it is also unclear how OPG is associated with the vascular calcification. In the present study, the serum OPG levels were not increased more in those patients having a TLC greater than 180 degrees compared with those patients having a TLC between 90 and 180 degrees, and a similar finding was also noted when the TLCs were analyzed by the calci- fied plaque surface area. This bimodal distribution is consistent with the nonlinear sigmoidal progression of arterial calcification that has been proposed by Yoon et al,25) and it suggests that OPG production is dynamic rather than constant in the course of vascular calcifica- tion. Furthermore, it might suggest that OPG can be a protective factor for vascular calcification, and the ele- vation of the serum OPG concentration is only a ref- lection of incomplete compensation of the OPG for vascular calcification.
In this study, the LDL cholesterol level and the HDL cholesterol level were not associated with the TLC, which is different from previous reports,26)27) and this is because calcification would be expected to correlate with the duration of exposure to hyperlipidemia, as measured in cholesterol-years.28)
This is the first study that has shown the relationship between coronary calcification and the serum OPG le- vel with performing direct visualization of the coronary arteries by using IVUS. However, there are some limi- tations in our study. First, because we performed IVUS evaluation only in the targeted PCI vessels, we could not estimate the calcification that might exist in the other coronary arteries in the same patient, and this makes it difficult to extend our results to the relation- ship between the total amount of coronary artery cal- cium and the serum OPG level. Second, even though IVUS is the most sensitive in vivo imaging modality to detect coronary calcium because it uses a high frequency transducer in close proximity to the high echogenic calcium,29) the current IVUS method that is used to quantify calcium typically measures the arc of calcium in only a single plane at the target lesion and/or at the reference site.8) Thus, it does not assess the calcium along the vessel and it may be an insufficient measure of the total calcium. In addition, even within a single slice of the artery, the depth-wise thickness of the calcium from
a deposit within the lumen is difficult to ascertain due to acoustic shadowing.
In conclusion, an elevated serum OPG level is a strong predictor of TLC in the patients suffering with CAD, but further investigation is needed to reveal whether OPG plays an active role or if the increment of serum OPG concentration is only an incomplete counterregu- latory mechanism of vascular calcification.
REFERENCES
1) Iliadis EA, Zaacks SM, Calvin JE, Allen J, Parrillo JE, Klein LW.
The relative influence of lesion length and other stenosis morpho- logies on procedural success of coronary intervention. Angiology 2000;51:39-52.
2) Budde T, Haude M, Hopp HW, et al. A prognostic computer model to predict individual outcome in interventional cardiology. Eur Heart J 1997;18:1611-9.
3) Hong MK, Park SW, Lee CW, et al. Intravascular ultrasound ana- lysis of factors associated with suboptimal stent expansion after high pressure balloon inflation. Korean Cir J 1997;27:979-87.
4) Park SH, Hong GR, Seo HS, Tahk SJ. Stent thrombosis after successful drug-eluting stent implantation. Korean Circ J 2005;
35:163-71.
5) Rumberger JA, Simons DB, Fitzpatrick LA, Sheedy PF, Schwartz RS. Coronary artery calcium area by electron-beam computed tomography and coronary atherosclerotic plaque area: a histo- pathologic correlative study. Circulation 1995;92:2157-62.
6) Mautner GC, Mautner SL, Froehlich J, et al. Coronary artery calcification: assessment with electron beam CT and histomor- phometric correlation. Radiology 1994;192:619-23.
7) Gertz SD, Malekzadeh S, Dollar AL, Kragel AH, Roberts WC.
Composition of atherosclerotic plaques in the four major epicar- dial coronary arteries in patients greater than or equal to 90 years of age. Am J Cardiol 1991;67:1228-33.
8) Fitzgerald PJ, Ports TA, Yock PG. Contribution of localized calcium deposits to dissection after angioplasty: an observatio- nal study using intravascular ultrasound. Circulation 1992;86:
64-70.
9) Lee YG, Park KS, Song KS, et al. Coronary artery calcification its incidence and significance in patients detected by cineangio- graphy. Korean Circ J 1994;24:646-52.
10) Fitzpatrick LA, Turner RT, Ritman ER. Endochondral bone for- mation in the heart: a possible mechanism of coronary calcifica- tion. Endocrinology 2003;144:2214-9.
11) Tintut Y, Demer LL. Recent advances in multifactorial regulation of vascular calcification. Curr Opin Lipidol 2001;12:555-60.
12) Tyson KL, Reynolds JL, McNair R, Zhang Q, Weissberg PL, Shanahan CM. Osteo/chondrocytic transcription factors and their target genes exhibit distinct patterns of expression in human arterial calcification. Arterioscler Thromb Vasc Biol 2003;23:
489-94.
13) Simonet WS, Lacey DL, Dunstan CR, et al. Osteoprotegerin: a novel secreted protein involved in the regulation of bone density.
Cell 1997;89:309-19.
14) Bucay N, Sarosi I, Dunstan CR, et al. Osteoprotegerin-deficient mice develop early onset osteoporosis and arterial calcification.
Genes Dev 1998;12:1260-8.
15) Scott DS, Arora UK, Farb A, Virmani R, Weissman NJ. Patholo- gic validation of a new method to quantify coronary calcific deposits in vivo using intravascular ultrasound. Am J Cardiol 2000;85:37-40.
16) Yun TJ, Chaudhary PM, Shu GL, et al. OPG/FDCR-1, a TNF re-
ceptor family member, is expressed in lymphoid cells and is up- regulated by ligating CD40. J Immunol 1998;161:6113-21.
17) Browner WS, Lui LY, Cummings SR. Associations of serum osteoprotegerin levels with diabetes, stroke, bone density, fractures, and mortality in elderly women. J Clin Endocrinol Metab 2001;
86:631-7.
18) Jono S, Ikari Y, Shioi A, et al. Serum osteoprotegerin levels are associated with the presence and severity of coronary artery disease. Circulation 2002;106:1192-4.
19) Schoppet M, Sattler AM, Schaefer JR, Herzum M, Maisch B, Hofbauer LC. Increased osteoprotegerin serum levels in men with coronary artery disease. J Clin Endocrinol Metab 2003;88:
1024-8.
20) Nitta K, Akiba T, Uchida K, et al. The progression of vascular calcification and serum osteoprotegerin levels in patients on long- term hemodialysis. Am J Kidney Dis 2003;42:303-9.
21) Haas M, Leko-Mohr Z, Roschger P, et al. Osteoprotegerin and parathyroid hormone as markers of high-turnover osteodystrophy and decreased bone mineralization in hemodialysis patients. Am J Kidney Dis 2002;39:580-6.
22) Kaden JJ, Bickelhaupt S, Grobholz R, et al. Receptor activator of nuclear factor kappaB ligand and osteoprotegerin regulate aortic valve calcification. J Mol Cell Cardiol 2004;36:57-66.
23) Dhore CR, Cleutjens JP, Lutgens E, et al. Differential expression
of bone matrix regulatory proteins in human atherosclerotic pla- ques. Arterioscler Thromb Vasc Biol 2001;21:1998-2003.
24) Schoppet M, Al-Fakhri N, Franke FE, et al. Localization of osteo- protegerin, tumor necrosis factor-related apoptosis-inducing li- gand, and receptor activator of nuclear factor-kappaB ligand in Monckeberg’s sclerosis and atherosclerosis. J Clin Endocrinol Metab 2004;89:4104-12.
25) Yoon HC, Emerick AM, Hill JA, Gjertson DW, Goldin JG. Cal- cium begets calcium: progression of coronary artery calcifica- tion in asymptomatic subjects. Radiology 2002;224:236-41.
26) Bild DE, Folsom AR, Lowe LP, et al. Prevalence and correlates of coronary calcification in black and white young adults. Arte- rioscler Thromb Vasc Biol 2001;21:852-7.
27) Pohle K, Maffert R, Ropers D, et al. Progression of aortic valve calcification: association with coronary atherosclerosis and car- diovascular risk factors. Circulation 2001;104:1927-32.
28) Schmidt HH, Hill S, Makariou EV, Feuerstein IM, Dugi KA, Hoeg JM. Relation of cholesterol-year score to severity of calcific atherosclerosis and tissue deposition in homozygous familial hy- percholesterolemia. Am J Cardiol 1996;77:575-80.
29) Tuzcu EM, Berkalp B, de Franco AC, et al. The dilemma of diag- nosing coronary calcification: angiography versus intravascular ultrasound. J Am Coll Cardiol 1996;27:832-8.