Quantitative Evaluation of the Hepatic Parenchymal Change in Patients with Chronic Liver Disease Using Gd-
EOB-DTPA-enhanced MRI: Comparison with Normal Liver1
Woo Jin Lee, M.D., Sang Hoon Cha, M.D., Min Yeong Kim, M.D., Hwan Hoon Chung, M.D., Seung Wha Lee, M.D., Ann Yi, M.D., Bo Kyung Je, M.D., Baek Hyun Kim, M.D.
1Department of Diagnostic Radiology, Korea University Ansan Hospital Received July 6, 2010; Accepted October 14, 2010
Address reprint requests to : Sang Hoon Cha, M.D., Department of Diagnostic Radiology, Korea University Ansan Hospital, 516, Gojan-dong, Ansan-city, Gyeonggi-do 425-707, Korea.
Tel. 82-31-412-5227 Fax. 82-31-412-5224 E-mail: [email protected]
Purpose: We wanted to evaluate the capability of Gd-EOB-DTPA-enhanced MRI for diagnosing chronic liver disease by comparing the signal intensity change (SIC) of the hepatic parenchyma of patients with chronic liver disease with that of patients with a normal liver.
Materials and Methods: This retrospective study included 50 patients who were patho- logically confirmed as having liver cirrhosis (n=41) or chronic hepatitis (n=9) by surgery (n=9) or biopsy (n=41), and they all underwent Gd-EOB-DTPA-enhanced MRI between June 2008 and May 2010 (i.e., the patient group). We also analyzed 30 patients with normal livers as the control group. Quantitative image analysis was per- formed by measuring the signal-to-noise ratios for the pre-contrast images and the post-contrast 2-, 3-, 10-, 20-min delay images and then calculating the SIC of the pre- contrast and post-contrast images. We performed a detailed analysis of the collected data, which was transformed into a logarithmic form. The SICs of the two groups were compared by Greenhouse-Geisser sphericity correction.
Results: Comparison of the SIC between the two groups showed a significant differ- ence on the hepatocyte-phase 20-min image (p<0.0001). The mean SICs with log transformation for the patient and normal groups were 1.90 ± 0.10 and 2.23 ± 0.13, respectively, and the optimal cut-off value of the SIC with log transformation on the 20-min delay hepatocyte-phase image was 2.17 (sensitivity: 66.7%, specificity: 84.0%, positive predictive value: 71.4%, negative predictive value: 80.8%).
Conclusion: Quantitative measurement of the SIC on the hepatocyte-phase image by Gd-EOB-DTPA-enhanced MRI could provide a convenient method to noninvasively di- agnose chronic liver disease.
Index words :Liver
Magnetic Resonance Imaging Gadolinium DTPA
Liver Cirrhosis Hepatitis, Chronic
Chronic liver diseases such as chronic hepatitis and liver cirrhosis are important causes of morbidity, mor- tality and increased health care costs for patients with chronic viral hepatitis. Therefore, the early detection of liver fibrosis and cirrhosis has important clinical impli- cations for determining the antiviral treatment options and a patient’s prognosis. Liver biopsy is the current ref- erence standard for making the diagnosis of chronic liv- er disease; however, this is an invasive procedure, and 40% and 0.5% of the patients who undergo liver biopsy experience associated pain and major complications, re- spectively (1, 2).
The morphologic criteria used to diagnose early and advanced cirrhosis by conventional MRI have been de- scribed in several reports, and most of these reports were written by the same investigative group. These criteria have a sensitivity of 68-93% and a specificity of 77.4- 98%, depending on the criterion used (3, 4). However, there is limited data on the quantitative analysis of ad- vanced liver fibrosis and cirrhosis. Moreover, although some quantitative analyses of chronic liver disease or fo- cal liver lesions based on MRI and using various contrast materials have been reported, there are few studies about quantitative evaluation for the detection of chronic liver disease using hepatocyte-specific contrast media.
Gadolinium-ethoxybenzyl-diethylenetriamine penta- acetic acid (Gd-EOB-DTPA) (Primovist; Bayer Schering Parma AG, Berlin, Germany) has been recently ap- proved as a hepatocyte-specific MR contrast agent. Gd- EOB-DTPA allows for both dynamic imaging and liver- specific static MRI of hepatocytes, along with the accu- rate delineation, classification and characterization of liver tumors (5, 6). Approximately half of the injected Gd-EOB-DTPA is taken-up by hepatocytes and this reaches a plateau after approximately 20 min and it last for approximately 2 hour. A few preclinical studies have reported that the MRI obtained using a hepatocyte-spe- cific contrast agent such as Gd-EOB-DTPA allows moni- toring of the excretory function of hepatocytes on the hepatocyte-phase image with a 20-min delay and this represents the liver function (5, 7). The purpose of our study was to evaluate the capability of Gd-EOB-DTPA- enhanced MRI to diagnose chronic liver disease by com- paring the signal intensity changes (SICs) of the hepatic parenchyma of patients with chronic liver disease with that of patients with a normal liver, and particularly by analyzing the cut-off values of the SIC on the hepato- cyte-phase images for making the diagnosis of chronic liver disease.
Materials and Methods
Patients
During a 23-month period (June 2008 to May 2010), 50 adult patients (36 men and 14 women, mean age: 53.9 years, range: 28-77 years) with chronic liver disease and who underwent Gd-EOB-DTPA-enhanced MRI were enrolled in this retrospective study (i.e., the patient group). Of these 50 patients, 41 (31 men and 10 women, mean age: 55.2 years) had a known diagnosis of liver cir- rhosis and nine (five men and four women, mean age:
47.9 years) had chronic hepatitis. The underlying causes of the chronic liver disease were associated with hepati- tis B (41 patients), hepatitis C (three patients), alcohol abuse (three patients) and idiopathic causes (three pa- tients). All of these histological diagnoses were con- firmed by surgery (n=9) or biopsy (n=41). The mean in- terval between MRI and the histological diagnosis was 17.5 days.
Another 30 adult patients (15 men and 15 women, mean age: 49.9 years, range: 27-73 years) with a normal liver underwent Gd-EOB-DTPA-enhanced MRI for vari- ous clinical reasons during the study period. They were included in the control group since they had no clinical history, clinical signs, imaging findings or laboratory pa- rameters of liver dysfunction (i.e., normal serum values for the blood coagulation parameters, liver enzymes and total bilirubin).
Gd-EOB-DTPA-enhanced MRI Technique
The MR data was obtained on a 3.0-Tesla scanner (Achieva; Philips, Netherlands). All the individuals un- derwent MRI of the liver using the hepatocyte-specific contrast agent gadoxetic acid (Gd-EOB-DTPA; Primovist, Bayer-Schering Pharma AG, Berlin, Germany). The Gd- EOB-DTPA was administered intravenously as a bolus dose at a rate of 2~3 mL/sec through an intravenous cu- bital line at a dosage of 10.0 ml irrespective of the body weight. We obtained the pre-contrast and post-contrast 2-, 3-, 10- and 20-min delay images in the transverse plane using the fat-suppressed T1-weighted gradient- echo technique with a 4-mm section thickness and a 2- mm overlap (i.e., a 2-mm interval).
Quantitative analysis
The relative signal intensity of the hepatic parenchy- ma measured on the post-contrast 2-, 3-, 10-, and 20-min delay images was compared quantitatively with that of
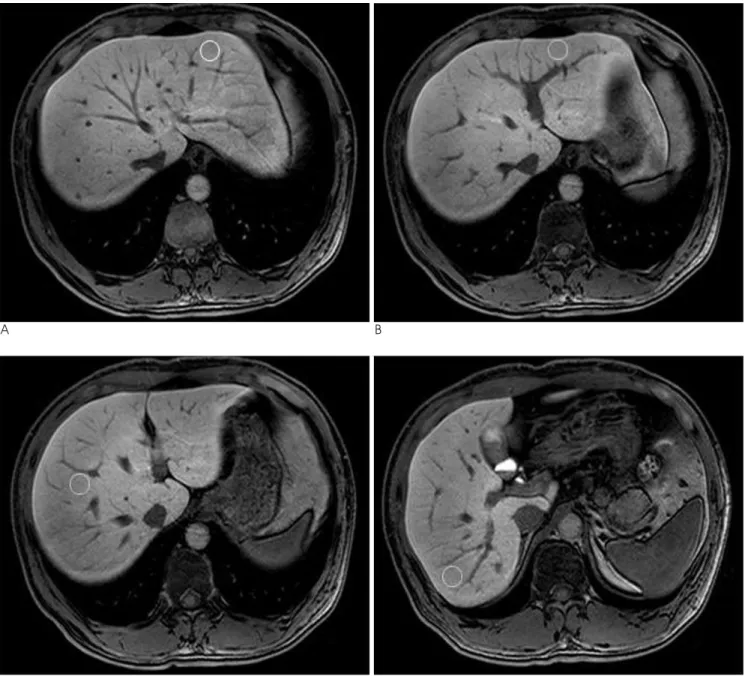
the pre-contrast images as follows. Measurement of the signal intensity was performed using a circular region of interest (ROI) placed over four points of the liver parenchyma, and these included the right and left lobes of the liver. Each of the four ROIs was drawn on the same axial image at each phase with a size of 10-15 mm in diameter (Fig. 1). These ROIs were positioned to avoid signals from vessels, bile ducts, focal lesions and artifacts. We calculated the mean signal intensity of the four ROIs at each phase in each individual. The noise was measured using ROIs located just lateral to the ab- dominal wall. Areas with the most prominent ghost arti- facts were not included. The signal intensity values
were corrected to the standard deviation of the back- ground noise and the values were expressed as the sig- nal-to-noise ratio (SNR) according to the following for- mula (8, 9):
SNR = Signal intensity liver / Standard deviation noise
The signal intensity change (SIC) between the pre-con- trast and post-contrast images was calculated as a per- centage at each phase according to the following formu- la:
SIC (%) = (SIpost- SIpre) / SIpre× 100
A B
C D
Fig. 1. A-D. The method for measuring the regions of interest at four points of the hepatic parenchyma in the right and left lobes of the liver.
SIpreand SIpostare the corrected signal intensity using the SNR on the pre-contrast and post-contrast images at the corresponding location, respectively (9).
Statistical analysis
All the data was analyzed after logarithmic transfor- mation because the initial data was not normally distrib- uted and it was difficult to interpret statistically.
Therefore, it was necessary to transform the data set to resemble a normal distribution (10). Statistical analysis was performed using SPSS 12.0.1 for Windows (SPSS, Chicago, IL, USA). Comparisons of the SICs between the patient group and control group were performed us- ing the Greenhouse-Geisser sphericity correction with repeated measures of ANOVA, and comparison of the SICs at each phase between the two groups was per- formed using a least squares method after natural log transformation. The cut-off values of the SIC on the 20-
min delay hepatocyte-phase were determined using re- ceiver operating characteristic (ROC) curves. The ROC curves and graphs were plotted using MedCalc 9.3.0.0 for Windows (MedCalc Software, Mariakerke, Belgium). A p-value less than 0.05 was considered statis- tically significant.
Results
The SICs of the liver parenchyma in the patient group and control group at each phase are shown in Table 1.
There was a statistically significant difference between the two groups on the 10- and 20-min delay images (p=0.003 and p<0.0001, respectively) with the most sig- nificant difference being noted on the 20-min delay he- patocyte-phase image. The mean SIC after log transfor- mation on the 20-min delay hepatocyte-phase image was 1.90 0.10 and 2.23 0.13 for the chronic liver
Table 1. Comparison of the Signal Intensity Changes of the Hepatic Parenchyma between the Patient Group with Chronic Liver Disease and the Control Group at Each Phase
Time Patient Group (n=50) Control Group (n=30)
p value
Mean LogSIC S.D. S.E. Mean LogSIC S.D. S.E.
02 min 1.84 0.11 0.053 1.96 0.14 0.069 0.203
03 min 1.93 0.10 0.048 2.03 0.12 0.062 0.249
10 min 1.92 0.08 0.045 2.15 0.11 0.057 0.003
20 min 1.90 0.10 0.053 2.23 0.13 0.068 <0.0001
LogSIC = SIC after Log transtormation, S.D. = standard deviation, S.E. = standard error
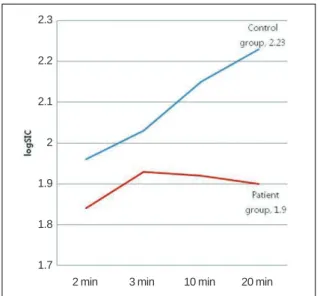
Fig. 2. The temporal profiles of the signal intensity change af- ter log transformation illustrate the relationship between the patient group with chronic liver disease and the control group at each phase.
Fig. 3. The receiver operating characteristic curves of the sig- nal intensity change after log transformation between the pre- contrast images and the 20-min delay hepatocyte-phase im- ages. Since the area under the receiver operating characteristic curve and the calculated p-value were 0.759 and 0.0001, re- spectively, this can be interpreted as there was a significant difference between the patient group with chronic liver dis- ease and the control group.
2 min 2.3
2.2
2.1
2
1.9
1.8
1.7
3 min 10 min 20 min
disease group and the normal liver group, respectively.
The temporal profiles of the SICs after log transforma- tion showed a difference between the two groups. The mean SICs of the control group showed a continuous in- crease and the mean SICs were significantly higher at 10 and 20 min after the administration of Gd-EOB-DTPA.
In contrast, the mean SICs of the patient group in- creased up to 3 min and they were slightly decreased af- ter 10 and 20 min (Fig. 2). The optimal cut-off value of the SIC on the 20-min delay hepatocyte-phase was 2.17 (area under the ROC: 0.759, sensitivity: 66.7%, specifici- ty: 84.0%, positive predictive value: 71.4%, negative predictive value: 80.8%). The positive likelihood ratio was 4.17, which means that the patient group was four times more likely to have an optimal cut-off SIC of 2.17 than was the control group (Fig. 3).
Discussion
Many methods have been used for quantitatively ana- lyzing chronic liver disease or focal liver lesions on MRI with various contrast materials (1, 8, 11). The previously published studies of MR elastography demonstrated that patients with liver fibrosis had higher MR elasto- graphic liver stiffness measurements than that of the healthy volunteers, suggesting that the MR elastograph- ic technique might be useful for diagnosing and evaluat- ing diffuse liver fibrosis (11). Whole-liver 3D perfusion MR imaging and MR spectroscopy are also feasible and non-invasive imaging modalities (1); however, these studies need additional equipment and they are compli- cated processes. For 3D perfusion MR imaging, the ex- tensive post-processing required to obtain the perfusion parameters is a substantial barrier to the widespread clinical use of this technique. Moreover, post-processing entails multiple data transfers, with each transfer requir- ing its own data conversion. MR elastography requires a new MR sequence and apparatus and it involves com- plex steps. In contrast, by using the method described here, we can measure the signal intensity of the hepatic parenchyma at ROIs and easily calculate the SIC at a personal PACS monitor as a daily practice. Thus, our method could provide a convenient single-step tech- nique to noninvasively estimate chronic liver disease.
Gd-EOB-DTPA is one of the liver-specific MR contrast agents with preferential uptake by hepatocytes, in which gadolinium-diethylenetriaminepentaacetic-acid (Gd-DTPA) is covalently linked to the lipophilic ethoxy- benzyl (EOB) moiety ([4S]-4-[4-ethoxybenzyl] -3,6,9-
tris[carboxylatomethyl] -3,6,9-triazaundecandioic acid) (12). Gd-EOB-DTPA is taken up into the hepatocytes through passive transport using the receptors on the cell surface and it is excreted into the biliary tract.
Approximately half of the injected Gd-EOB-DTPA is taken-up by the hepatocytes and this reaches a plateau after approximately 20 min, and the hepatocyte-phase of Gd-EOB-DTPA-enhanced MRI visualizes the focal he- patic lesion with great contrast. But some patients show limited hepatic enhancement because their hepatic function is reduced. In the liver with impaired function, the receptors on the cell surface might not work as well as those on the normal hepatocytes. Some preclinical studies have reported that the MRI obtained with Gd- EOB-DTPA allowed monitoring of the excretory func- tion of hepatocytes (5, 7, 13-15). These characteristics mean that Gd-EOB-DTPA can be used not only for he- patic imaging, but also for the measurement of hepatic function (7, 12, 16). It is also known that that the signal intensity of the hepatic parenchyma increases when a certain amount of the hepatocyte-specific contrast agent is taken up by the hepatocytes. Moreover, the hepato- cyte-phase image obtained approximately 20 minutes af- ter contrast injection allows additional information on the signal intensity changes of the hepatic parenchyma in the normal liver and the liver with chronic disease (17, 18). In this study, we quantified the SICs of the he- patic parenchyma of the normal liver and the liver with chronic disease on both the pre-contrast and post-con- trast images using the hepatocyte-specific contrast agent Gd-EOB-DTPA. As shown in this study, insufficient liv- er enhancement on the hepatocyte-phase image is relat- ed to liver dysfunction (5).
In this study, the SICs of the 10- and 20-min delay he- patocyte-phase images were significantly different be- tween the patient and control groups (p=0.003 and p<0.0001, respectively) and the SICs exhibited high specificity (84.0%), but relatively low sensitivity (66.7%). This may be due to the small number of sub- jects, the various degree of fibrosis and the different Child-Pugh class in the patient group. This study includ- ed nine patients with chronic hepatitis and several pa- tients with cirrhosis of Child-Pugh class A, which corre- sponded to the early stage of liver cirrhosis. It was possi- ble that they had normal liver function, which could lead to an increased false negative rate. Thus, a large- scale confirmation study is needed to validate the signif- icant correlation between estimated SICs in each group.
There were some limitations in this study. First, the
study population in both groups was relatively small.
Second, we did not attempt to subclassify the patient group into several subgroups according to the grade of fibrosis or the activity of inflammation because of the number of non-cirrhotic patients was relatively small and a considerable number of cirrhotic patients were of Child-Pugh A. Therefore, this study did not provide helpful information for differentiating chronic liver dis- ease according to degree of fibrosis such as hepatitis and cirrhosis. Third, we used the same dosage of contrast agent irrespective of body weight. Fourth, the control group had no histological proof that the liver parenchy- ma was normal. Fifth, we did not consider there might be a sample selection bias when measuring the ROIs of the four areas in each image, and especially in the cases of advanced liver cirrhosis with heterogeneous parenchymal signal intensity.
In conclusion, this study revealed that patients with chronic liver disease showed significantly lower SICs on the hepatocyte-phase image using Gd-EOB-DTPA as compared with those SICs of the normal livers.
Therefore, MRI using Gd-EOB-DTPA could provide a convenient single-step method to noninvasively diag- nose chronic liver disease, although further studies on this are needed.
References
1. Hagiwara M, Rusinek H, Lee VS, Losada M, Bannan MA, Krinsky GA, et al. Advanced liver fibrosis: diagnosis with 3D whole-liver perfusion MR imaging-initial experience. Radiology 2008;246:926- 934
2. Afdhal NH, Nunes D. Evaluation of liver fibrosis: a concise re- view. Am J Gastroenterol 2004;99:1160-1174
3. Ito K, Mitchell DG. Hepatic morphologic changes in cirrhosis: MR imaging findings. Abdom Imaging 2000;25:456-461
4. Ito K, Mitchell DG. Imaging diagnosis of cirrhosis and chronic he- patitis. Intervirology 2004;47:134-143
5. Motosugi U, Ichikawa T, Sou H, Sano K, Tominaga L, Kitamura T, et al. Liver parenchymal enhancement of hepatocyte-phase images in Gd-EOB-DTPA-enhanced MR imaging: which biological mark- ers of the liver function affect the enhancement? J Magn Reson Imaging 2009;30:1042-1046
6. Bluemke DA, Sahani D, Amendola M, Balzer T, Breuer J, Brown JJ, et al. Efficacy and safety of MR imaging with liver-specific con- trast agent: U.S. multicenter phase III study. Radiology 2005;237:
89-98
7. Ryeom HK, Kim SH, Kim JY, Kim HJ, Lee JM, Chang YM, et al.
Quantitative evaluation of liver function with MRI using Gd-EOB- DTPA. Korean J Radiol 2004;5:231-239
8. Yamashita Y, Yamamoto H, Hirai A, Yoshimatsu S, Baba Y, Takahashi M. MR imaging enhancement with superparamagnetic iron oxide in chronic liver disease: influence of liver dysfunction and parenchymal pathology. Abdom Imaging 1996;21:318-323 9. Filippone A, Blakeborough A, Breuer J, Grazioli L, Gschwend S,
Hammerstingl R, et al. Enhancement of liver parenchyma after in- jection of hepatocyte-specific MRI contrast media: a comparison of gadoxetic acid and gadobenate dimeglumine. J Magn Reson Imaging 2010;31:356-364
10. Murphy EA. Evaluation of clinical data: improvement of efficiency by simple transformation. J Chronic Dis 1962;15:795-809
11. Rouviere O, Yin M, Dresner MA, Rossman PJ, Burgart LJ, Fidler JL, et al. MR elastography of the liver: preliminary results.
Radiology 2006;240:440-448
12. Schuhmann-Giampieri G, Mahler M, Roll G, Maibauer R, Schmitz S. Pharmacokinetics of the liver-specific contrast agent Gd-EOB- DTPA in relation to contrast-enhanced liver imaging in humans. J Clin Pharmacol 1997;37:587-596
13. Hamm B, Staks T, Muhler A, Bollow M, Taupitz M, Frenzel T, et al. Phase I clinical evaluation of Gd-EOB-DTPA as a hepatobiliary MR contrast agent: safety, pharmacokinetics, and MR imaging.
Radiology 1995;195:785-792
14. Muhler A, Freise CE, Kuwatsuru R, Rosenau W, Liu T, Mintorovitch J, et al. Acute liver rejection: evaluation with cell-di- rected MR contrast agents in a rat transplantation model. Radiology 1993;186:139-146
15. Tschirch FT, Struwe A, Petrowsky H, Kakales I, Marincek B, Weishaupt D. Contrast-enhanced MR cholangiography with Gd- EOB-DTPA in patients with liver cirrhosis: visualization of the bil- iary ducts in comparison with patients with normal liver parenchyma. Eur Radiol 2008;18:1577-1586
16. Schuhmann-Giampieri G, Schmitt-Willich H, Press WR, Negishi C, Weinmann HJ, Speck U. Preclinical evaluation of Gd-EOB-DT- PA as a contrast agent in MR imaging of the hepatobiliary system.
Radiology 1992;183:59-64
17. Asbach P, Warmuth C, Stemmer A, Rief M, Huppertz A, Hamm B, et al. High spatial resolution T1-weighted MR imaging of liver and biliary tract during uptake phase of a hepatocyte-specific con- trast medium. Invest Radiol 2008;43:809-815
18. Gandhi SN, Brown MA, Wong JG, Aguirre DA, Sirlin CB. MR con- trast agents for liver imaging: what, when, how. Radiographics 2006;26:1621-1636
대한영상의학회지 2011;64:49-55
Gd-EOB-DTPA MRI를 이용한 만성간질환의 간실질에 대한 정량적 평가:
정상간과 비교11고려대학교 의과대학 고려대학교병원 영상의학과
이우진∙차상훈∙김민영∙정환훈∙이승화∙이 안∙제보경∙김백현
목적: Gd-EOB-DTPA MRI에서 만성간질환 환자군과 정상군의 간실질의 조영증강률을 비교하여 만성간질환을 진단할 수 있는지를 평가하고자 한다.
대상과 방법: Gd-EOB-DTPA MRI를 시행한 환자 중 수술(n=9) 또는 조직 생검(n=41)을 통해 간경변증 (n=41) 또는 만성 간염(n=9)으로 병리학적 진단을 받은 50명의 환자를 대상으로 하였다(환자군). Gd-EOB- DTPA MRI를 시행한 정상 간을 가진 30명을 대조군으로 하여 비교하였다. 조영증강 전 영상과 2분, 3분, 10분, 20분 지연 조영증강 후 영상에서 간실질의 신호대잡음비를 측정하였으며 조영증강 전 영상과 비교하여 각각의 조영 증강 후 영상에서의 조영증강률을 구하였다. 모든 측정값은 로그 변환 후 분석하였으며 각 군의 조영증강률의 비교 는 Greenhouse-Geisser sphericity correction을 이용하였다.
결과: 두 군간의 조영증강률은 20분 간세포시기영상에서 가장 유의한 차이를 나타내었다(p < 0.0001). 평균조영증 강률은 환자군과 정상군에서 각각 1.90 ± 0.10과 2.23 ± 0.13으로 측정되었으며, 20분 지연 간세포시기영상에서 의 최적 판별 수치는 2.17로 측정되었다(민감도, 특이도, 양성예측도, 음성예측도는 각각 66.7%, 84.0%, 71.4%, 80.8%).
결론: Gd-EOB-DTPA MRI의 간세포시기영상에서 조영증강률의 측정은 만성간질환을 진단하는데 편리하고 비침 습적인 방법으로 유용하게 이용될 수 있다.