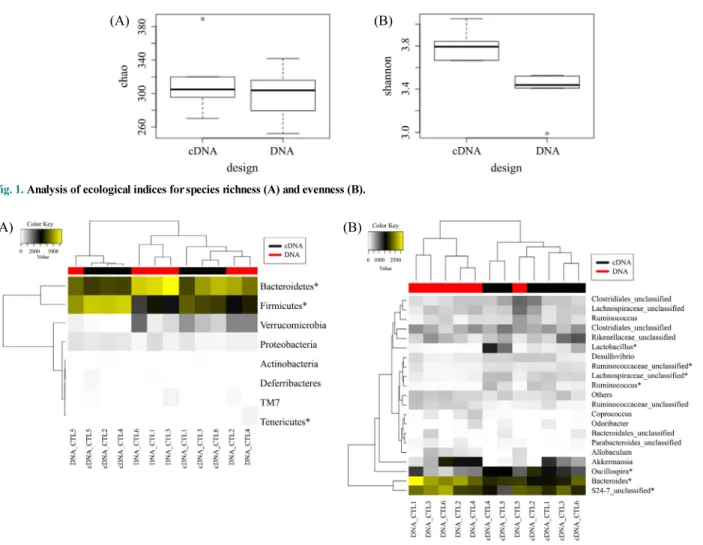
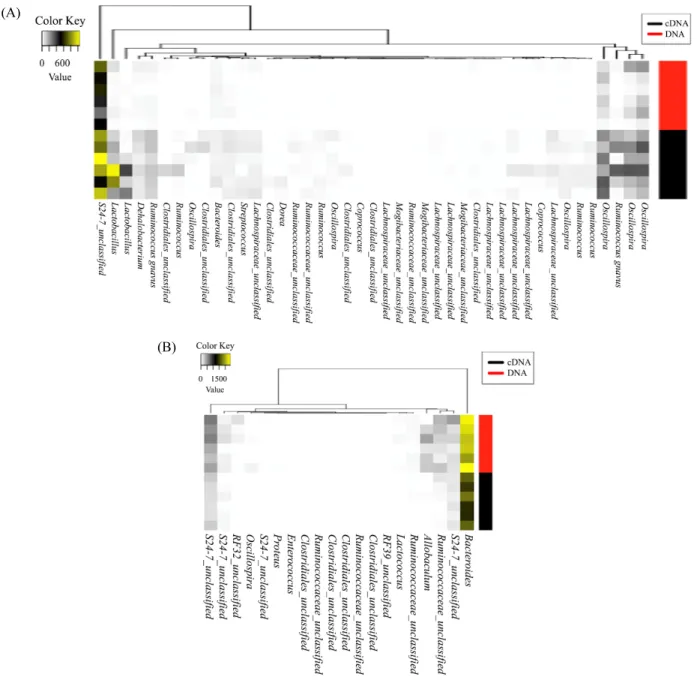
Comparison between DNA- and cDNA-based gut microbial community analyses using 16S rRNA gene sequences §
Hyejun Jo
†, Jiwan Hong
†, and Tatsuya Unno*
Faculty of Biotechnology, College of Applied Life Sciences, Jeju National University, Jeju 63243, Republic of Korea
16S rRNA 유전자 서열 분석을 이용한 DNA 및 cDNA 기반 장내 미생물 군집 분석의 비교 §
조혜준
†・ 홍지완
†・ 운노타쯔야*
제주대학교 생명자원과학대학 생명공학부
(Received June 14, 2019; Revised July 3, 2019; Accepted July 5, 2019)
†
These authors contributed equally to the study.
*For correspondence. E-mail: [email protected];
Tel.: +82-64-754-3354; Fax: +82-64-756-3351
§