Transl Clin Pharmacol
TCP
123 Vol. 27, No.4, Dec 30, 2019
Copyright © 2019 Nick Holford
It is identical to the Creative Commons Attribution Non-Commercial License (http://creativecommons.org/licenses/by-nc/3.0/).
This paper meets the requirement of KS X ISO 9706, ISO 9706-1994 and ANSI/NISO Z.39.48-1992 (Permanence of Paper).
Objectives
1) Understand the concept of disease progression.
2) Appreciate the difference between a symptomatic drug re- sponse and a disease-modifying drug response.
3) Learn examples of symptomatic and disease-modifying effects.
4) Know how to distinguish placebo and nocebo responses.
The components of a model for disease progress
Clinical pharmacology can be described as the science of understanding disease progression (clinical) and drug action (pharmacology). Disease progression implies that the disease changes with time. Drug action refers to the time course of drug effect and includes pharmacokinetics, pharmacodynamics, and a link model to account for delays in effect and clinical response
in relation to drug concentration.[1]
Clinical pharmacology is not a static description of the use of a drug but includes the time course of the disease, drug con- centration, and response (Figure 1). This figure expresses these ideas in a mathematical form. The progression of the disease is summed with drug action to describe the clinical pharmacol- ogy. Note that drug action encompasses the action of the drug, usually at a receptor, the subsequence effect following receptor activation, and the observable clinical response. Both disease progression and drug action have their own time course.[2-4]
The figure is colour coded to show that disease (red) is usually bad, drug (green) is usually good and clinical pharmacology (gold) is the light that illuminates and leads to understanding of the interaction between disease and drug.
Disease status may be defined in terms of clinical outcomes such as survival and symptoms or in terms of a biomarker. Bio- markers are also known as clinical signs when used by clinicians as diagnostic or prognostic variables. Symptoms are measures of what a patient feels or how they function, which are used to describe the clinical outcome. Survival is another kind of pa- tient outcome. While this term is usually used to refer to being still alive it may also be used to describe the time to other events than death, such as the time to myocardial infarction, stroke, or epileptic seizure.
A symbol to describe disease progress is 'S,' i.e., the disease sta- tus. Disease status is expected to vary with time, S(t) (Equation 1). The components of disease status are the baseline, the natu- ral history over time, the response to an active drug treatment and the response to a control treatment (usually inactive).
S(t) = Baseline + Natural History + Treatment + Inactive Response Equation 1
Reviewer
This article was invited and reviewed by the editors of TCP.
Treatment response and disease progression
Nick Holford*
Department of Pharmacology & Clinical Pharmacology, University of Auckland, Auckland, New Zealand
*Correspondence: Nick Holford; Tel: +64-9-923-6730, E-mail: n.holford@auckland.ac.nz
This tutorial defines the concepts of disease progression in the context of clinical pharmacology.
Disease progression describes the natural history of disease, such as pain, or biomarker of drug response, such as blood pressure. The action of a drug, such as inhibiting an enzyme or activating a receptor, leads to a change in disease status over time. Two main types of drug response can be de- fined based on the pattern of the time course of disease status. The most common is a symptomatic effect equivalent to a shift up or down of the natural history curve. Less common but quite clinically important is a disease-modifying effect equivalent to a change in the rate of disease progression.
Received 2 Dec 2019 Accepted 4 Dec 2019
Keywords
Disease-modifying, Disease progression, Drug action, Symptomatic pISSN: 2289-0882 eISSN: 2383-5427
TCP
Transl Clin PharmacolTUTORIAL
2019;27(4):123-126 https://doi.org/10.12793/tcp.2019.27.4.123
Figure 1. Clinical pharmacology is the sum of disease progress and drug action.
Vol. 27, No.4, Dec 30, 2019 124
TCP
Transl Clin PharmacolClinical pharmacology and disease progression
The time course of the natural history of disease progression based on bone mineral density is shown in Figure 2. The two curves show bone density relative to the maximum in men which occurs around 30 years of age. Bone density increases from birth and reaches a peak around the same time in men and women. It decreases in both sexes but more rapidly in women following the menopause. This is thought to be due to a drop in oestrogen and consequent increased rate of bone loss.
The curves are drawn as a series of line segments but this should not be interpreted to mean that disease progression is linear.
Indeed, if bone density in women were to be extrapolated using the line segment from 45 to 60 y, the density would become zero around 65 y and then negative at 70 y! Biology is usually curved, and straight lines should be avoided for extrapolation. Note that the curve for women has a final segment which is slower than in men which leads to a more plausible extrapolation at 100 y.
The graph appeared on the reverse of a packet of Swiss müesli where it was used to support advertising of müesli with cal-
cium and vitamin D. The marketing concept was to suggest that eating these 3 ingredients would strengthen bone density.
The implied health claim was that this would reduce the risk of bone fractures, especially in post-menopausal women. Dietary supplementation with calcium and vitamin D has some small benefit in improving bone density but little effect in reducing fracture risk and an enhanced risk of cardiovascular disease.[5]
The simplest model to describe changing disease status with time is linear. In general, if the change is relatively small in rela- tion to the time scale of observation, then any disease progress curve will be reasonably described by a linear function.
An example of linear disease progression is shown in Figure 3.
The disease status curve, S(t), decreases linearly from a baseline, S0, with slope ∝, as a function of time, t. The change is not large (25%) over 52 time units (e.g., weeks), so a linear model is rea- sonable for description over this period.
With any disease progress model, it is possible to imagine a drug action that is equivalent to a change in the baseline param- eter of the model. This kind of effect on disease produces a tem- porary offset. When treatment is stopped the response to the drug washes out and the status returns to the baseline. In many cases it is reasonable to suppose that the processes governing a delay in onset of drug effect will also affect the loss of effect.
The offset effects of levodopa treatment in Parkinson’s disease are one exception to this assumption [6] because they are more rapid (weeks) compared with onset (years).[7]
The effect of drug treatment on disease progression is shown in Figure 4. The natural history progression line (blue) is shown for reference. The drug effect is delayed in onset but reaches a constant offset from the natural history line around 12 weeks.
Drug treatment is stopped at 40 weeks and the drug effect wash- es out and eventually rejoins the natural history line. There are two hallmarks of this pattern that indicate a symptomatic drug response. The first is the slope of the line is the same in both the natural history curve and the drug treatment curve once the delay in onset of effect has reached equilibrium. The second is
Figure 2. Disease progression across the human life span. This graph shows the change in bone mineral density (Knochenmesse) in men (Männer) and women (Frauen) from age (Alter) 0 to 90 years.
Figure 3. Linear natural history model of disease progression. Figure 4. Linear natural history model of disease progression with a symptomatic offset drug effect.
Vol. 27, No.4, Dec 30, 2019 125
TCP
Transl Clin Pharmacol
Nick Holford
the washout of drug effect which eventually joins the natural history line and shows the improvement in disease status is just temporary without any lasting modification. The mathemati- cal model for disease status is equivalent to a drug effect on the baseline with no effect on the underlying rate of progression.
The second type of drug effect on disease progression is to modify the rate of progress. This is illustrated in Figure 5.
In this example, there is no obvious delay in the onset of the drug effect, but the slope of the disease status curve is reduced compared with the natural history curve. When treatment is stopped at 40 weeks, the disease resumes its original rate but remains parallel to the natural history curve. The change in the rate of progression is the hallmark of a disease-modifying effect.
The model for disease progression is more complicated because the slope changes with the time course of drug effect, E(t). This requires the integration of the rate of disease progression in or- der to describe the time course of disease status.
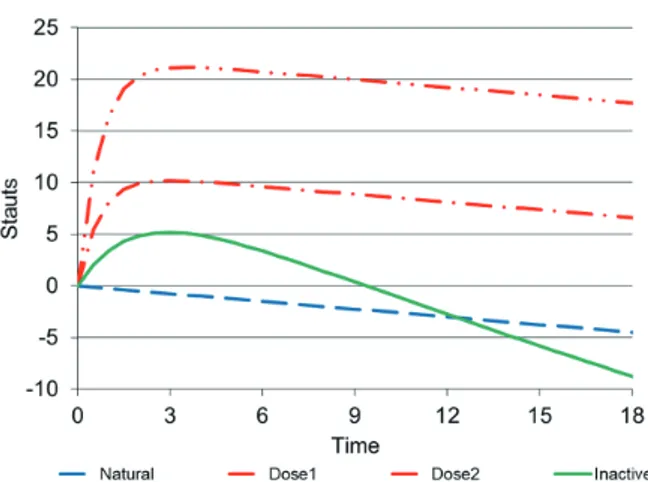
The final component of a disease progress model (Equation 1) – the response to an inactive (control) treatment – is shown in Figure 6. A linear natural progression line is shown for refer- ence. The response to two different drug doses shows a slow delayed onset of effect with a similar final rate to the natural progression. The response to inactive treatment shows an initial placebo response (same direction as improvement in disease status as that produced by active treatment), but later the re- sponse drops below the expected natural progression suggesting a nocebo response. This biphasic response can be understood in terms of an initial positive expectation of response in this double-blind controlled trial. But as time passes, the patient be- comes aware that there is no real improvement and feels worse than if no treatment had been given. This pattern of response to active and inactive treatment has been observed in a study of two dose rates of prednisone in young boys with Duchenne muscular dystrophy.[8]
Clinical applications
The distinction between symptomatic and disease-modifying response to treatment is important, especially in long term degenerative diseases like Alzheimer's disease, Parkinson's disease, chronic obstructive airway disease. To date, there are no effective disease-modifying treatments for Alzheimer's dis- ease. The pattern of response shown in Figure 4 is typical of the response to treatment. After a delay in onset of response, the progress of the disease remains the same as the natural history indicating the benefit is symptomatic, and after a brief period of benefit, the disease progresses and is no better than at baseline.
[9-11] On the other hand, the treatment of Parkinson's disease with deprenyl slows the rate of progression.[7] This disease- modifying effect was subsequently confirmed and shown to be enhanced by co-treatment with levodopa.[6,12] A major effort was made to determine if tiotropium, a muscarinic antagonist bronchodilator, would modify the progression of chronic ob- structive airway disease, but the results showed only a symp- tomatic benefit, which was less than the symptomatic benefit of a beta-agonist bronchodilator, salbutamol.[13]
Acknowledgments
None.
Conflict of interest
- Authors: The author has no conflict of interest.
- Reviewers: Nothing to declare - Editors: Nothing to declare
References
1. Holford N. Pharmacodynamic principles and the time course of immediate drug effects. Transl Clin Pharmacol 2017;25:157-161.
2. Holford N. Absorption and Half-Life. Transl Clin Pharmacol 2016;24:157- 160.
3. Holford N, Yim D-S. Clearance. Transl Clin Pharmacol 2015;23:42-45.
Figure 5. Linear natural history model of disease progression with a
disease-modifying drug effect. Figure 6. Linear natural history (blue) with delayed offset drug response at 2 active doses (red) with early placebo and late nocebo response (green).
Vol. 27, No.4, Dec 30, 2019 126
TCP
Transl Clin PharmacolClinical pharmacology and disease progression
4. Holford N, Yim D-S. Volume of distribution. Transl Clin Pharmacol 2016;
24:74-77.
5. Bolland MJ, Grey A, Reid IR. Should we prescribe calcium or vitamin D supplements to treat or prevent osteoporosis? Climacteric 2015;18 Suppl 2:22-31. doi: 10.3109/13697137.2015.1098266.
6. Holford NH, Chan PL, Nutt JG, Kieburtz K, Shoulson I. Disease progres- sion and pharmacodynamics in Parkinson disease - evidence for func- tional protection with levodopa and other treatments. J Pharmacokinet Pharmacodyn 2006;33:281-311.
7. Parkinson Study Group. Effect of deprenyl on the progression of disability in early Parkinson's disease. N Engl J Med 1989;321:1364-1371.
8. Griggs RC, Moxley RT 3rd, Mendell JR, Fenichel GM, Brooke MH, Pestronk A, et al. Prednisone in Duchenne Dystrophy: A randomized, con- trolled trial defining the time course and dose response. Arch Neurol 1991;48:383-388.
9. Holford NH, Peace K. The effect of tacrine and lecithin in Alzheimer's dis- ease. A population pharmacodynamic analysis of five clinical trials. Eur J Clin Pharmacol 1994;47:17-23.
10. Holford NH, Peace KE. Results and validation of a population pharmaco- dynamic model for cognitive effects in Alzheimer patients treated with ta- crine. Proc Natl Acad Sci U S A 1992;89:11471-11475.
11. Imbimbo BP, Verdelli G, Martelli P, Marchesini D. Two-year treatment of Alzheimer's disease with eptastigmine. The Eptastigmine Study Group.
Dement Geriatr Cogn Disord 1999;10:139-147.
12. Vu TC, Nutt JG, Holford NH. Progression of motor and nonmotor features of Parkinson's disease and their response to treatment. Br J Clin Pharma- col 2012;74:267-283. doi: 10.1111/j.1365-2125.2012.04192.x.
13. Tashkin DP, Celli B, Senn S, Burkhart D, Kesten S, Menjoge S, et al. A 4-Year Trial of Tiotropium in Chronic Obstructive Pulmonary Disease. N Engl J Med 2008;359:1543-1554. doi: 10.1056/NEJMoa0805800.