기존의 통상적인 자기공명영상은 대부분의 신경계 병변을 검사하는데 유용하게 쓰이지만, 급성기 뇌경색의 진단에는 한 계가 있으며, 특히 초기 8시간 이내의 병변은 잘 감지하지 못 하는 것으로 알려져 있다 (1, 2). 최근 자기공명 영상기법의 발달과 함께 등장한 확산 강조영상은 초기의 허혈성 뇌경색의 발견에 상당히 민감하다는 것이 입증되었으며 (3, 4), 관류 자 기공명영상도 허혈성 뇌경색의 조기 발견뿐만 아니라 뇌의 혈 류역학적 정보도 얻을 수 있기 때문에 임상적인 연구가 활발 히 이루어 지고 있다 (5-8). 특히 급성 뇌경색 환자에서 관류
자기공명영상과 확산 강조영상을 같이 시행할 경우 허혈성 경 계부위(penum-bra)의 평가에 도움을 주어 가역성 괴사와 비 가역성 괴사의 감별에 도움을 주고 (9), 또한 허혈성 경계부 위를 영상으로 나타내게 될 경우 뇌혈전 용해술같은 적극적인 치료의 대상이 되는 환자를 선별하고, 그 치료 효과를 평가하 는데 유용하게 쓰일 수 있다는 연구가 보고되고 있다 (10).
우리나라에서도 확산 강조 영상은 현재 여러 병원에서 뇌 경색의 조기 진단에 임상적으로 유용하게 쓰이고 있지만, 관 류 자기공명영상은 신호강도의 변화를 측정하고 정량적인 데 이터를 분석할 수 있는 후처리 프로그램의 부족으로 널리 활 용되고 있지 않은 실정이다. 최근에 저자들은 관류 자기공명 영상의 후처리 프로그램을 자체 개발하였고, 뇌혈용적(rCBV, relative cerebral blood volume), 뇌혈류량(rCVF, relative cerebral blood flow), 평균 통과시간(MTT, mean transit
급성 뇌경색 환자에서 관류 MR 영상:
T2강조영상과 확산강조영상과의 비교
1제환준・장기현1,2・송인찬1,2・박선원・김윤희・김홍대3・김형석4・최준일・한문희1,2
목적: 급성 뇌경색 환자에서 관류 자기공명영상을 T2강조영상 및 확산강조영상 소견과 비교하 여 관류영상의 임상적 유용성을 평가하고자 하였다.
대상과 방법:증상 발현 후 1주일 이내에 내원한 급성 뇌경색 환자 14명을 대상으로 고식적 자
기공명영상과 확산 강조영상, 관류 자기공명영상을 모두 시행하였다. 관류 자기공명영상은 Gradient Echo EPI기법으로 조영제 15 cc를 정맥주사하고 연속적인 영상을 얻어, 상대적 뇌 혈용적(rCBV), 상대적 뇌혈류(rCBF), 평균통과시간(MTT), 최대농도도달시간(TTP)의 네 가 지 후처리 영상을 만들었다. 각 환자의 T2 강조영상과 확산 강조영상, 네 가지 관류영상에서 병변의 개수와 신호강도, 크기에 중점을 두고 후향적으로 분석하였다.
결과: 14명의 환자에서 모두 21개의 급성 뇌경색 병변이 있었고, T2 강조영상과 확산강조영 상에서는 병변의 개수와 크기는 같았다. 병변의 크기는 장경 3 cm이하가 15개, 3 cm이상이 6 개였다. T2 강조 영상에서 17개 병변은 매우 높은 고신호강도를 보였고, 4개 병변은 경미한 고신호강도를 보였다. 확산 강조영상에서 병변은 모두 매우 높은 고신호강도를 보였다. 관류 자기공명영상에서는 3 cm이상 크기의 병변은 모두 보였으나, 3 cm이하 크기의 병변은 rCBV 영상과 rCBF영상에서 15개중 4개의 병변 (26.7%)만이 보였고, MTT영상에서는 5개 (33.3%) 만, TTP영상에서는 6개 (40%)만 보였다. T2 강조영상이나 확산 강조영상과 병변의 크기를 비교했을 때, rCBV영상과 rCBF영상에서는 병변의 크기가 더 작은 경우가 4개, 같은 경우가 6 개였고, MTT영상에서는 큰 경우가 3개, 작은 경우가 4개, 같은 경우가 4개였다. TTP영상에 서는 병변의 크기가 큰 경우가 7개, 같은 경우가 5개였다.
결론: 확산 강조영상은 급성 뇌경색 병변을 크기에 관계없이 기존의 T2 강조영상보다 분명하 게 나타내었으나, 관류 자기공명영상에서는 장경 3 cm 이하의 작은 병변은 보이는 경우가 적 었다. 관류 자기공명영상 중에서는 TTP와 MTT영상이 향후 허혈성 경계부위를 알아내기 위 한 관류영상기법으로 임상이용의 가치가 클 것으로 기대된다.
1서울대학교 의과대학 방사선과학교실
2의학연구원 방사선의학연구소
3강남성심병원 방사선과
4제주의료원 방사선과
이 논문은 1999년 9월 28일 접수하여 2000년 5월 2일에 채택되었음.
time), 최대 농도 도달시간(TTP, time to peak contrast con- centration)의 혈역학적 지표를 사용한 4 가지의 관류 자기공 명영상이 가능하게 되었다.
본 연구에서는 급성 뇌경색 환자를 대상으로 통상적인 자기 공명영상과 관류 자기공명영상, 그리고 확산 강조영상을 함께 시행하여 이들을 비교 분석하여 관류 자기공명영상의 유용성 을 평가하고자 하였다.
대상과 방법
뇌 신경학적 증상을 주소로 내원한 환자 중 임상적으로 급 성 뇌경색으로 진단 받은 14명을 대상으로 하였다. 환자의 연 령분포는 56세에서 81세였고,평균 연령은 57.8세였으며, 남자 는 8명, 여자는 6명이었다.
자기공명영상은 증상 발현 후 1주일 이내에 (평균 3.4일), 고식적 자기공명영상과 확산 강조영상, 관류 자기공명영상을 모두 시행하였다. MR영상기기는 1.5 T unit (Signa, GE Medi- cal System, Milwaukee, Wisconsin, U.S.A.)를 사용하여 먼저 통상적인 횡단면 T2와 T1 강조영상을 얻고, 추가로 확산 강 조영상과 관류 자기공명영상을 얻었다. T2 강조 영상은 TR/TE:
4000/9 msec, matrix 256×224, FOV 210×180 mm, 절편두께 5 mm, 절편간격 2.5 mm로 하여 시행하였다.
확산 강조영상은 Spin Echo EPI기법으로, TR 6500 ms, TE 107 ms, matrix 128×128, FOV 240×240 mm, 절편두께 7 mm, 절편간격 3 mm, b factor=1000 sec/mm2의 영상변수를 사용하였다. 관류 자기공명영상은 Gradient Echo EPI기법으로 TR 2000 ms, TE 50 ms, flip angle 90°, matrix 128×128, FOV 240×240 mm의 영상변수를 사용하였다. 확산강조영상 에서 고신호강도를 보이는곳을 중심으로 하여 전 촬영 (Pre- scan)에서 6개의 절편 위치를 정한 후, 기준 스캔 (baseline scan) 10초 후부터 gadopentetate dimeglumine (Mag-nevist, Schering AG, Germany) 15 cc 정맥주사를 초당 2 cc의 속도 로 주입하였다. 조영제가 처음으로 뇌조직을 통과하는 160초 동안 한 환자에서 6개의 단면당 각각 80개씩, 총 480개의 영 상을 얻었다. 이렇게 얻은 기초 데이터를 GE workstation으로 전송한 뒤 영상처리 소프트웨어인 IDL (Inter-active data lan- guage, Research Systems Inc. Co, U.S.A.)을 사용하여 서울 대학교 병원 진단방사선과 송인찬 박사팀이 제작한 후영상 처 리 프로그램을 이용하여 rCBV, rCBF, MTT, TTP의 혈류역학 적 지표에 의한 4가지 후처리 영상을 만들었다.
이 후 두 명의 방사선과 의사가 각 환자의 T2 강조영상과 확산 강조영상, 4가지 관류 자기공명영상에서 병변의 개수와 신호강도, 크기에 중점을 두고 후향적으로 분석하였다. 관류영 상에서 병변의 크기는 3 cm를 기준으로 분석하였다.
결 과
T2 강조영상에서는 14명의 환자에서 모두 21개의 급성 뇌 경색 병변이 발견되었다. 그 중 17개 병변은 매우 높은 고신
호강도를 보였고, 증상 발현 후 18시간 이내에 자기공명영상 을 시행한 4개의 병변은 경미한 고신호강도를 보였다. 병변의 크기는 장경 3 cm이하가 15개, 3 cm이상이 6개였다.
확산 강조영상에서도 21개의 병변이 전부 보였고, T2 강조 영상에서 경미한 고신호강도를 보였던 병변을 포함한 모든 병 변이 매우 높은 고신호강도를 보였다 (Fig. 1-4). 병변의 크 기는 모두 T2 강조영상에서와 같았다.
관류 자기공명영상에서 3 cm이상 크기의 병변 6개는 네 가 지의 관류영상에서 모두 다 보였다 (Fig.1-3). 3 cm이하의 병 변은 15개중 4개 (26.7%) 만이 네 가지의 관류영상에서 모두 보였다. 네 가지의 각각의 관류영상별로 보면, rCBV영상과 rCBF영상에서는 15개 병변중 4개의 병변 (26.7%)만이 보였 고 (Fig. 4), MTT영상에서는 5개 (33.3%), TTP영상에서는 6개 (40%)만 보였다 (Fig. 4). 각 영상에서 보인 병변의 개수 는 Table 1에 요약하였다.
확산 강조영상과 병변의 크기를 비교했을 때, rCBV영상과 rCBF영상에서는 병변의 크기가 확산 강조영상에서와 같은 경 우가 각각 6개씩 (Fig. 3), 확산 강조영상에서보다 작은 경우 가 4개씩 (Fig. 1, 2)이었다. MTT영상에서는 확산강조영상에 서보다 큰 경우 (Fig. 1)가 3개, 작은 경우가 4개, 같은 경우 가 4개였다. TTP영상에서는 확산 강조영상에서보다 큰 경우 가 7개 (Fig. 1, 2), 같은 경우가 5개 (Fig. 3)였으며, 작은 경 우는 없었다 (Table 2).
Table 1. Number of the Lesions Delineated on T2-Weighted, Diffu- sion Weighted, and Perfusion MR Images
>3 cm (n = 6) <3 cm (n = 15) Total (n = 21)
T2WI 6 15 21
DWI 6 15 21
Perfusion-Images
rCBV 6 4 10
rCBF 6 4 10
MTT 6 5 11
TTP 6 6 12
DWI : Diffusion weighted Image T2WI : T2 weighted Image
Table 2. Comparison of the Lesion Size between Diffusion- Weighted and Perfusion MR Images
rCBV rCBF MTT TTP
Perfusion > Diffusion 0 0 3 7
Perfusion = Diffusion 6 6 4 5
Perfusion < Diffusion 4 4 4 0
The total number of 10 10 11 12
delineated lesions
DWI : Diffusion weighted Image
Perfusion > Diffusion : Perfusion image shows larger lesion than DWI
Perfusion = Diffusion : Perfusion MR image shows same sized le- sion with DWI
Perfusion < Diffusion : Perfusion MR image shows smaller lesion than DWI
고 찰
초급성 또는 급성 뇌경색 환자에서, 혈전용해제를 이용한 적 극적인 치료를 통하여 환자의 예후와 신경학적 후유증을 개선 하려는 노력은 최근까지 꾸준히 계속되었다 (11, 12). 일반적 으로 비교적 초기 (증상발현 4-6시간)의 급성 뇌경색에 적극 적인 치료를 하면 회생 가능한 가역성의 뇌 허혈조직을 구할 수 있으나, 일부 약물에서는 치명적 부작용이나 합병증이 생 길 수 있고, 같은 조기에 치료를 하더라도 환자마다 치료효과
가 다를 수 있기 때문에, 모든 환자에서 효과적인 치료를 하 기 위해서는 환자마다 허혈성 뇌경색의 정확한 조기 진단과 회생 가능한 가역성 병변의 유무와 정도를 초기에 판별해 내 는 것이 매우 중요하다 (10, 13).
여러 허혈성 뇌경색의 동물 실험과 임상연구에서, T2 강조 영상에서는 나타나지 않는 몇 분 이내의 초급성 뇌경색이 확산 강조영상에서는 고신호강도로 관찰되었고, 겉보기 확산계수 (ADC) 지도상 확산계수의 감소를 확인 할 수 있었다 (14- 17).
관류 자기공명영상은, gadolinum 같은 상자성의 조영제가 혈 류를 통해 뇌실질의 모세혈관대를 통과할 때 국소적인 자기장
A B C
D E F
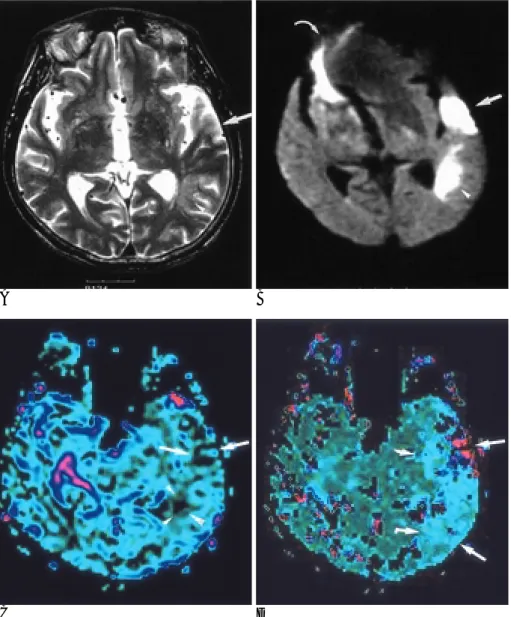
Fig. 1. A 76-year old woman with acute infarction. MR images were obtained 4 days after symptom onset.
A. T2-weighted MR image shows a slightly high signal intensity in the right basal ganglia and periventricular white matter (arrow).
B. Diffusion-weighted MR image shows much brighter signal intensity of the same sized lesion as that of A. Some image distortion and an artifact of high signal (arrowhead) are seen in the right frontal lobe.
C, D. Perfusion MR images of rCBV (C) and rCBF (D) maps show that the perfusion defect appears to be slightly smaller than that of A and B (arrow). However, MTT (E) and TTP (F) maps show that the delayed perfusion area is much larger than that of C and D, involving both frontal lobes corresponding to both anterior cerebral artery territories (arrows).
의 불균질성이 발생하고, 이로 인해 그 조직의 실질적인 횡 이 완시간 (T2*)이 감소하는 자화율 효과(susceptibility effect) 를 원리로 이용한다 (18, 19). 이러한 자화율 효과는 혈관내 의 조영제 농도가 높을수록 커지며, 혈류량에 비례해서 커진 다. 이 효과를 조영제가 뇌 조직을 일차 통과하는 동안 연속 해서 촬영하는 일련의 rapid T2*-weighted gradient echo image에 의해서 영상화 할 수 있으며, 이렇게 얻어진 관류 영 상의 원 데이터를 rCBV, rCVF, MTT, TTP 등의 혈역학적인 지표로 색조 처리한(color-coding) 후처리 영상을 얻을 수 있 다. 본 연구에서는 저자들이 개발한 후처리 프로그램을 이용 하여 관류 자기공명영상을 얻을 수 있었다.
최근 Sorensem 등 (9)은 급성 뇌경색 환자에서 관류 자기 공명영상과 확산강조영상을 같이 시행할 경우, 병변의 조기 발 견 뿐만 아니라 허혈성 경계부위(penumbra)의 평가에 도움을 주어, 가역성 괴사 부위와 비가역성 괴사 부위를 구별할 수 있 다고 하였다. 허혈성 경계부위는 뇌 혈류의 감소에 의하여 정 상 뇌기능은 상실되었으나, 최소한의 대사에 필요한 혈류량이
유지되어 있어 구조적인 손상까지는 일어나지 않은 가역적인 손상부위를 시사한다 (10). Sorensen등 (9)의 연구에 따르면 허혈성 경계부위는 관류영상에서는 관류결손으로 나타나고, 확 산 강조 영상에서는 정상으로 보이기 때문에 허혈성 경계부위 를 가진 초급성 또는 급성 뇌경색 환자에서는 확산 강조영상 보다 관류 영상에서 병변의 크기가 크다고 기술하고 있다. 본 연구 결과에서는 확산 강조 영상은 병변의 크기에 관계없이 모든 급성 뇌경색 병변을 분명한 고신호강도로 잘 나타낸 반 면, 관류 영상은3 cm 이상 크기의 병변은 잘 보였으나 3 cm 이하의 병변은 절반이상이 보이지 않았다. 특히 관류 자기공 명영상 중 rCBV 와 rCBF 영상은 확산강조 영상과 병변의 크 기를 비교했을 때 오히려 같거나 작게 나타나는 경향을 보였 다. 본 연구결과가 Sorensen등 (9)의 연구결과와 부분적으로 차이를 보인 이유는 첫째, 본 연구에서 병변의 크기가 작은 경 우가 많았고 (21개 병변중 15개가 장경3 cm 이하), 둘째, Sorensen등 (9)은 증상 발현 후 10시간이내의 초 급성기 환 자를 대상으로 한 반면, 본 연구에서는 증상 발현 후 1 주일
A B
C D
Fig. 2. A 71-year old man with acute in- farction. MR images were obtained 18 hours after symptom onset.
A. T2-weighted MR image shows a subtle high signal intensity in the left temporal cortex (arrow) and periven- tricular area (arrowhead).
B. Diffusion-weighted MR image show much brighter high signal intensity of the two lesions (arrow and arrowhead).
Susceptibility artifact (curved arrow) and image distortion are noted in the frontal area.
C. Perfusion MR image of rCBV map reveals smaller size of the perfusion de- fects (arrows and arrowheads). The le- sion size as seen on rCBF map (not shown) appeared to be similar to that of C.
D. Perfusion MR image of TTP map shows that the perfusion defect ap- pears to be much larger than that of C, extending to the insula and posterior temporal cortex (arrows). MTT map (not shown) also showed the lesion size similar to D.
이내 (평균 3.4일)의 환자들을 대상으로 해 급성 뇌경색 후의 변연부 재관류(marginal reperfusion)의 영향을 받았을 가능성 이 크고, 셋째, 후처리(postprocessing)를 위한 소프트웨어의 차이 때문일 것으로 생각된다.
3 cm이하의 병변이 관류영상에서 잘 나타나지 않았던 이유는 명확하게 밝힐 수는 없으나 여러가지로 추정할 수 있다. 그 주 요한 이유중의 하나는 관류 자기공명영상은 기본적으로 각 단면 당 80개정도의 영상데이터로부터 후처리 과정을 거치므로 확산 강조영상에 비해 해상도가 떨어지기 때문인 것으로 해석된다. 또 한 관류 자기공명영상은 고속 영상기법을 사용하기는 하지만, 스 캔 시간의 제한 때문에 한번에 얻을 수 있는 절편의 숫자가 6개 로 한정되어 있어 병변이 여러 개인 경우 일부 병변이 관류 영 상에 포함되지 않은 것도 이유중의 하나로 생각할 수 있다. 또 한 관류상태를 나타내는 네 가지 종류의 파라미터가 정상조직과 혈류감소부위의 대조도에 큰 차이를 보이지 않을 정도로 매우 미약했을 것으로도 추정되는데 이것은 후처리 과정에서 소프트 웨어의 개선으로 어느 정도 해결될 수 있다고 생각한다.
이번 연구에서 관류 자기공영영상 중 rCBV와 rCBF영상에 서는 병변이 확산강조영상에서보다 더 크게 보인 경우가 없었 던 반면, MTT와 TTP영상에서는 T2강조영상이나 확산강조 영상보다 병변의 크기가 크게 나타난 경우가 각각 3예 및 7예 에서 나타났다는 사실은 매우 의미 있고 중요한 결과로 생각 된다. 이것은 관류영상 중 MTT와 TTP영상, 특히 후자가 rCBV 또는 rCBF보다 허혈성 경계부위를 잘 나타내는 영상기 법으로 앞으로 임상적 이용가치가 클 것이라는 것을 시사한다.
확산 강조영상이나 rCBV 또는 rCBF영상에서는 정상처럼 보 이나 MTT 또는 TTP영상에서 관류지연으로 나타나는 경우는 조영제의 평균 통과시간이나 최대농도 도달시간이 지연되어 있지만, 측부순환의 발달로 인하여 정상부위와 비슷한 정도의 뇌혈류량을 갖고 있는, 아직 경색에까지 이르지는 않은 부위 로 해석할 수 있다. 또한 정상적인 피질회백질과 심부백질사 이의 MTT나 TTP값 차이가 적어 후처리 영상에서 정상 뇌조 직이 비교적 균일하게 보이고, 이에 따라 rCBV 와 rCBF영상 에서보다 병변-정상조직의 대조도가 상대적으로 높았을 가능
A B
C D
Fig. 3. A 74-year old woman with large cortical infarction. MR images were obtained 2 days after symptom onset.
A. T2-weighted MR image shows a high signal intensity in the left parietal lobe (arrow).
B. Diffusion-weighted MR image shows a bright high signal intensity in the same area as that of A (arrow).
C, D. Perfusion MR images of rCBF (C) and TTP (D) maps also show similar size of the perfusion defect in the same area (arrows). Size of the lesion on rCBV and MTT maps also appeared al- most same as that of C and D (not shown).
성도 있을 것으로 추정되나 정확한 원인은 분명하지 않다. 확 산 강조영상과 MTT, TTP영상 사이의 병변의 크기 차이가 반 드시 허혈성 경계를 의미하는지에 대해서는 저자들이 확인한 바에 의하면 아직 보고한 문헌이 없어 앞으로 더 많은 연구가 필요하다고 생각한다.
일반적으로 관류영상에서 심부백질 병변이 비록 같은 크기 일지라도 피질회백질병변보다 낮은 빈도로 관찰되었는데, 이것 은 심부 백질은 뇌혈류량이 상대적으로 적고, 피질회백질은 뇌 혈류량이 많아 허혈병변 부위와의 대조도가 다르기 때문으로 생각된다. 즉 관류 결손으로 나타나는 작은 허혈성 병변이 혈 류량이 적은 심부 백질에 있을 때는 병변과 정상조직의 대조 도가 피질에 있는 병변-정상조직의 대조도보다 낮기 때문에 심부백질에 있는 병변이 잘 관찰되지 않았을 것으로 생각된다.
결론적으로 급성 뇌경색 환자를 대상으로 관류 자기공명영 상과 확산 강조영상을 기존 자기공명영상과 함께 시행하였을 때, 확산 강조영상은 급성 뇌경색 병변을 크기에 관계없이 기 존의 T2 강조영상보다 분명하게 나타내었으나, 관류 자기공명 영상에서는 장경 3 cm이하 크기의 작은 병변은 보이지 않는
경우가 많았다. 관류 자기공명영상 중에서는 TTP와 MTT영 상에서 관류 지연 부위가 T2강조영상, 확산강조영상, rCBV와 rCBF영상에서보다 더 크게 보이는 경향을 보였다. 특히 TTP 영상에서 허혈부위가 확산강조영상에서보다 더 크게 보이는 경우가 많아, TTP영상이 허혈성 경계부위를 가장 잘 나타내 는 영상기법으로서 앞으로 임상이용가치가 클 것으로 예상되 나 이에 대하여 더 많은 임상연구가 필요할 것으로 생각한다.
참 고 문 헌
1. Bryan RN, Levy LM, Whitlow WD, Killian JM, Preziosi TJ, Rosario JA. Diagnosis of acute cerebral infarction: comparison of CT and MR imaging. AJNR Am J Neuroradiol 1991;12:611-620 2. Yuh WT, Crain MR, Loes DJ, Greene GM, Ryals TJ, Sato Y. MR
imaging of cerebral ischemia: findings in the first 24 hours. AJNR Am J Neuroradiol 1991;12:621-629
3. Warach S, Chien D, Li W, Ronthal M, Edelman RR. Fast magnetic resonance diffusion-weighted imaging of acute human stroke.
Neurology 1992 Sep;42 (9):1717-1723
4. Chien D, Buxton RB, Kwong KK, Brady TJ, Rosen BR. MR diffu- sion imaging of the human brain. J Comput Assist Tomogr 1990;14:
A B
C D
Fig. 4. A 71-year old woman with small periventricular infarction. MR images were obtained 36 hours after symptom onset.
A. T2-weighted image shows a small high signal intensity lesion in the periventricular white matter of left frontal lobe (arrow).
B. Diffusion-weighted MR image shows a bright high signal intensity in the same area (arrow). Size of the lesion appears to be same as that seen on A.
Susceptibility artifact is noted in the right frontal area.
C, D. Perfusion MR images of rCBF (C) and MTT maps (D) do not show the le- sion. Perfusion MR images of rCBV and TTP maps (not shown) also did not show the lesion.
514-520
5. Edelman RR, Manttle HP, Atkinson DJ, et al. Cerebral blood flow:
assessment with dynamic contrast enhanced T2*-weighted MR imaging at 1.5 T. Radiology 1990;176:211-220
6. Runge VM, Kirsch JE, Wells JW, Woolfolk CE. Assessment of cere- bral perfusion by first-pass, dynamic, contrast-enhanced, steady-s- tate free-precessional MR imaging:an animal study. AJR Am J Roentgenol 1993;160:593-600
7. Warach S, Li W, Rosenthal M, Edelman R. Acute cerebral is- chemia: evaluation of dynamic contrast-enhanced MR imaging nd MR angiography. Radiology 1992;182:41-47
8. Rempp KA, Brix G, Wenz F, Becker CR, Guckel F, Lorenz WJ.
Quantification of regional cerebral blood flow and volume with dynamic susceptibility contrast-enhanced MR imaging. Radiology 1994;193:637-641
9. Sorensen AG, Buonanno FS, Gonzalez RG, et al. Hyperacute stroke: evaluation with combined multisection diffusion-weighted and hemodynamically weighted echo-planar MR imaging.
Radiology 1996;199:391-401
10. Beauchamp NJ Jr, Bryan RN Acute cerebral ischemic infarction: a pathophysiologic review and radiologic perspective. AJR Am J Roentgenol 1998;171:73-84
11. Cerebral embolism study group. Cardioembolic stroke, early anti- coagulation, and brain hemorrhage. Arch Intern Med 1987;147:636- 640
12. Cerebral embolism study group. Immediate anticoagulation of em-
bolic stroke: brain hemorrage and management options. Stroke 1984;15:779-789
13. Brott TG, Haley EC, Levy DE, et al. Urgent theraphy for stroke.
Part I. Pilot study of tissue plsminogen activator administerd with- in 90 minutes. Stroke 1992;23:632-640
14. Yuh WTC, Crain MR, Loes DJ, Green GM, Ryals TS, Sato Y. MR imaging of cerebral ischemia : findings in the 24 hours. AJNR Am J Neuroradiol 1991;12:621-629
15. M intorovitch J, Moseley ME, Chileuitt L, Shimizu H, Cohen Y, Weistein PR. Comparison of diffusion and T2 weighted MRI for the early detection of cerebral ischemia and reperfusion in rats.
Magn Reson Med 1991;18:39-50
16. Moseley ME, Kucharczyk J, Mintrovitch J, et al. Diffusion weight- ed MR imaging of acute stroke: correlation with T2 weighted and magnetic susceptibility enhanced MR imaging in cats. AJNR Am J Neuroradiol 1990;11:423-429
17. Maeda M, Itoh S, Ide H, et al. Acute stroke in cats: comparison of dynamic susceptibility-contrast MR imaging. Radiology 1993;189:
227-232
18. Villafana T. Physics and instrumentation magnetic resonance imaging.
In Lee HL, Rao KCVG, Zimmerman RA, eds. Cranial MRI and CT.
3rd ed. McGRAW-Hill 1992:39-62
19. Belliveau JW, Rosen BR, Kentor HL, et al. Functional cerebral imaging by susceptibility-contrast NMR. Magn Reson Med 1990;
14:538-546
J Korean Radiol Soc 2000;43:1-8
Address reprint requests to : Kee-Hyun Chang, M.D., Department of Radiology, Seoul National University Hospital, 28, Yongon-Dong, Chongno-Gu, Seoul 110-744, Korea.
Tel. 82-2-760-2516 Fax. 82-2-743-6385 E-mail: [email protected]
Perfusion MR Imaging in Patients with Acute Cerebral Infarction:
Comparison with T2-Weighted and Diffusion-Weighted MR Imaging
1Hwan Jun Jae, M.D., Kee-Hyun Chang, M.D.1,2, In Chan Song, M.D.1,2, Sun-Won Park, M.D., Yoon Hee Kim, M.D., Hong Dae Kim, M.D.3, Hyung Seok Kim, M.D.4, Joon-Il Choi, M.D., Moon Hee Han, M.D.1,2
1Department of Radiology, Seoul National University College of Medicine,
2Institute of Radiation Medicine ,SNUMRU,
3Department of Radiology, Kang Nam Sacred Heart Hospital,
4Department of Radiology, Cheju Medical Center
Purpose: To evaluate the clinical usefulness of perfusion MR imaging by comparing with T2-weighted and dif- fusion weighted MR imaging in patients with acute cerebral ischemic infarction.
Materials and Methods: Conventional, diffusion weighted, and perfusion MR images were obtained within one week of clinical onset in 14 cases of acute ischemic infarction. For perfusion MRI, the gradient-echo EPI technique after IV bolus injection of 15 cc of contrast media was used. Four kinds of perfusion MR images (rCBV, rCBF, mean transit time[MTT], time to peak concentration [TTP]) were generated by home-made soft- ware from the raw data. T2-weighted, diffusion-weighted, and perfusion images of each patient were retro- spectively analyzed, with attention to the number, signal intensity, and size of lesions.
Results: T2-weighted and diffusion-weighted images demonstrated 21 acute ischemic lesions in 14 patients.
Six lesions had a long diameter of more than 3 cm, while the other 15 were smaller than 3 cm. On T2-weighted images, 17 lesions showed high signal intensity and four showed subtle high signal intensity. On diffusion- weighted images, all lesions showed bright high signal intensity. The six lesions larger than 3 cm were all delin- eated by all four kinds of perfusion MR imaging, but among the 15 smaller than 3 cm, only four (26.7%), five (33.3%) and six (40%) were delineated on rCBV and rCBF maps, the MTT map, and the TTP map, respective- ly. As compared with T2-weighted and diffusion-weighted imaging, the rCBV and rCBF maps showed that four lesions were smaller and six were the same size. On the MTT map, three lesions were seen to be larger, four were smaller, and the other four were the same size as they appeared on diffusion-weighted images, while on the In TTP map, seven were larger and five were smaller than they appeared on these images.
Conclusion: In all cases, diffusion-weighted images most clearly delineated acute ischemic lesions, regardless of lesion size. Many such lesions smaller than 3 cm were not apparent on perfusion MR images. Among the four kinds of perfusion MR imaging, TTP and MTT maps may be clinically useful for evaluation of the penum- bral zone in cases of acute cerebral ischemic infarct.
Index words :Brain, infarction
Magnetic resonance (MR), diffusion study Magnetic resonance (MR), perfusion study