ABSTRACT
Background: Causes of weight change after tocilizumab treatment are unclear. We aimed to investigate the effects of tocilizumab treatment on body weight and serum adipokine levels in patients with rheumatoid arthritis (RA).
Methods: In this retrospective cohort study, we evaluated weight changes in patients with RA who received methotrexate (Cohort I) or tocilizumab with methotrexate (Cohorts II and III) for 24 weeks. Adipokine concentrations at baseline and 24 weeks were analyzed in Cohorts I and III. Cohorts I and II received tocilizumab therapy for an additional 48 weeks, during which weight changes were monitored (24–72 weeks).
Results: No significant weight change occurred after 24 weeks of methotrexate treatment (mean difference, −0.2 kg; P = 0.630), but was observed after 24 weeks of tocilizumab treatment (mean difference, +0.9 kg; P = 0.010). Weight changed regardless of the treatment response in both treatment groups. The leptin–adiponectin ratio (P = 0.015) and levels of adiponectin (P < 0.001), leptin (P < 0.001), and resistin (P = 0.003) increased significantly after 24 weeks of tocilizumab, but not methotrexate treatment. After 24, 48 and 72 weeks of tocilizumab treatment in Cohort II, mean (95% confidence interval [CI]) weight changes from baseline were +0.7 (0.0–1.4), +1.2 (0.4–2.0) and +1.1 (0.2–2.0) kg, respectively, and mean (95% CI) percent weight changes from baseline were +1.3% (0.1%–2.6%), +2.2%
(0.7%–3.6%), and +2.0% (0.4%–3.7%) at 24, 48, and 72 weeks, respectively.
Conclusion: Weight and the leptin–adiponectin ratio increased after tocilizumab treatment.
Given that cardiovascular (CV) risk factors may deteriorate in patients with RA who receive tocilizumab, further studies are required to determine the effects of weight gain on CV outcomes in these patients.
Keywords: Adipokine; Interleukin-6 Receptor Inhibition; Rheumatoid Arthritis; Weight Gain
Original Article
Received: Dec 17, 2019 Accepted: Mar 27, 2020 Address for Correspondence:
Yeong Wook Song, MD, PhD Department of Internal Medicine, Seoul National University, College of Medicine, 101 Daehak-ro, Jongno-gu, Seoul 03087, Korea.
E-mail: [email protected]
© 2020 The Korean Academy of Medical Sciences.
This is an Open Access article distributed under the terms of the Creative Commons Attribution Non-Commercial License (https://
creativecommons.org/licenses/by-nc/4.0/) which permits unrestricted non-commercial use, distribution, and reproduction in any medium, provided the original work is properly cited.
ORCID iDs In Ah Choi
https://orcid.org/0000-0003-4662-4065 Akira Sagawa
https://orcid.org/0000-0002-7308-8264 Eun Young Lee
https://orcid.org/0000-0001-6975-8627 Eun Bong Lee
https://orcid.org/0000-0003-0703-1208 Yeong Wook Song
https://orcid.org/0000-0002-5384-3437 Funding
This research was supported by a research grant from Chungbuk National University Hospital in 2018 and it was partly supported by grants from the Ministry of Science, ICT and Future planning (NRF-2015M3A9B6052011)
In Ah Choi ,1 Akira Sagawa ,2 Eun Young Lee ,3 Eun Bong Lee ,3 and Yeong Wook Song 3,4
1 Division of Rheumatology, Department of Internal Medicine, Chungbuk National University Hospital, Cheongju, Korea
2Sagawa Akira Rheumatology Clinic, Sapporo, Japan
3Division of Rheumatology, Department of Internal Medicine, Seoul National University Hospital, Seoul, Korea
4 Department of Molecular Medicine and Biopharmaceutical Sciences, Graduate School of Convergence Science and Technology and College of Medicine, Seoul National University, Seoul, Korea.
Tocilizumab Increases Body Weight and Serum Adipokine Levels in Patients with Rheumatoid Arthritis Independently of Their Treatment Response:
a Retrospective Cohort Study
Immunology, Allergic
Disorders & Rheumatology
and (2019M3A9A8065574) and partly supported by a grant of the Korea Health Technology R&D Project through the Korea Health Industry Development Institute (KHIDI), funded by the Ministry of Health &
Welfare, Republic of Korea (HI14C1277).
Disclosure
IA Choi received a research grant from Chungbuk National University Hospital in 2018. She received a research grant from LG Chem and AbbVie Korea, which is not relevant to this study. EY Lee received the grants from the Ministry of Science, ICT and Future planning (NRF-2019M3A9A8065574).
EB Lee has received research grants from Pfizer Korea, and has been a consultant for Pfizer. YW Song received a research grant from JW Pharmaceuticals during the clinical trials (NCT01211834 and NCT01256736).
The use of clinical data and serum samples in this study were supported by JW Pharmaceuticals. The present study received grants from the Ministry of Science, ICT and Future planning (NRF-2015M3A9B6052011, 2019M3A9A8065574) and a grant from the Korea Health Technology R&D Project through the Korea Health Industry Development Institute (KHIDI), funded by the Ministry of Health & Welfare, Republic of Korea (HI14C1277).
Author Contributions
Conceptualization: Choi IA, Song YW. Data curation: Choi IA, Sagawa A, Song YW. Formal analysis: Choi IA. Methodology: Choi IA, Sagawa A, Lee EY, Lee EB, Song YW. Writing - original draft: Choi IA, Song YW. Writing - review & editing: Choi IA, Sagawa A, Lee EY, Lee EB, Song YW.
INTRODUCTION
Rheumatoid arthritis (RA) is a chronic inflammatory disease with enhanced cardiovascular (CV) morbidity and mortality. Patients with RA have an approximately 70% higher risk of myocardial infarction than the general population, which is comparable to the risk in diabetic patients.1 Pooled analysis of CV mortality in 91,916 patients with RA demonstrated a 60%
increase in CV mortality in these patients, who were compared with the general population2 and these rates did not change over time.3
In addition to the traditional risk factors such as obesity, insulin resistance, and
dyslipidemia, the systemic inflammation that accelerates atherogenesis can contribute to the higher risk in RA patients.4-6 Several lines of evidence suggest that a high number of inflamed joints, elevated erythrocyte sedimentation rate, elevated C-reactive protein, and interleukin (IL)-6 confound the development of CV complications in RA,7,8 and the recommendations of a European League Against Rheumatism (EULAR) task force emphasize adequate control of disease activity to lower the CV risk in patients with RA.9
Methotrexate is the first-line disease modifying anti-rheumatic drug (DMARD), and is widely used for monotherapy and combination therapy for RA. It effectively controls immune inflammation in the joint and vascular walls, thereby improving CV and total mortality in RA.10-12 Moreover, other DMARDs to control disease activity in RA patients could have significant effects on patient metabolic profiles,13 although controversy persists with regard to the effects of such therapies on lipids, adipokines, and insulin resistance.14
Inflammatory cytokines, including tumor necrosis factor (TNF)-alpha and IL-6 play central roles in RA pathogenesis; therefore, medications that inhibit TNF-alpha or block IL-6 receptors that are widely used to treat patients with RA refractory to conventional DMARDs include methotrexate. The use of TNF inhibitors is known to reduce the overall incidence of CV events.12,15 However, as TNF-alpha is involved in weight loss,16 weight gain is reported after administering TNF-alpha inhibitors. In addition, increases in fat mass, and inconsistent correlations with serum adipokine level changes have been described.17-19
With regard to IL-6 receptor inhibition by tocilizumab, another biologic DMARD that blocks an inflammatory cytokine pathway, there has been controversy for a long time on its CV safety. Tocilizumab increased cholesterol level,20 more severely than did adalimumab, a TNF inhibitor.21 Therefore, tocilizumab has been used with caution in patients with high CV risk, particularly patients with dyslipidemia. Following several reassuring data reports on major adverse CV events with tocilizumab compared to other biologic DMARDs,22-26 a recent report of a postmarketing randomized controlled trial (RCT) upon the request of the US Food and Drug Administration showed that the risk of major adverse CV events of tocilizumab was comparable to etanercept, with a hazard ratio (HR) of 1.05.26
We investigated the effects of tocilizumab on traditional CV risk factors in patients with RA.
Among the metabolic changes associated with tocilizumab use, the evidence for dyslipidemia is considered sufficient. Therefore, we focused on changes in body weight and adipokines—
the protein mediators released by adipose tissue. A complex relationship between
adipokines, RA, and CV diseases has been described, and the best-characterized adipokines are adiponectin, resistin, and leptin.27 Especially, the leptin-to-adiponectin ratio has been reported as an insulin-resistance proxy or arthrogenic index in many studies.28-30
In view of all the above mentioned considerations, this study investigated changes in body weight after 24-week treatment with or without tocilizumab in patients with RA. Associations between body-weight changes and treatment responses or baseline body mass indexes (BMIs) were investigated. Finally, we investigated changes in levels of serum adiponectin, leptin, and resistin, as well as their association with weight change.
METHODS
Study design and patients
This retrospective study comprised three patient cohorts (Fig. 1). Cohorts I and II were derived from patients with active RA who participated in a RCT and the extension study of tocilizumab treatment (NCT01211834 and NCT01256736) from October 2009 to November 2013,31 excluding patients without 0- and 24-week weight records. Patients were eligible for the RCT if they had been diagnosed with RA according to the 1987 American College of Rheumatology criteria and had active disease refractory to methotrexate with or without other conventional DMARDs. Active RA was defined by a swollen joint count ≥ 6 from the total of 66, tender joint count ≥ 8 from the total of 68, and serum C-reactive protein level ≥ 1 mg/dL or erythrocyte sedimentation rate (ESR) ≥ 28 mm/h. Cohort I comprised 45 participants who received a placebo and methotrexate for the first 24 weeks, excluding patients who had no serum remaining for further adipokine analysis. Cohort II consisted of 46 participants who were administered tocilizumab (8 mg/kg) and methotrexate for 24 weeks.
Cohort III is an independent cohort of 41 patients with active RA who received tocilizumab therapy from January 2009 to December 2018 and were refractory or intolerable to
methotrexate and/or conventional TNF-inhibitor treatment. Active RA was defined as DAS28
≥ 5.1, or DAS28 ≥ 3.2 and the presence of new bone erosion after 6 months of treatment. All patients had weight data and serum samples for further adipokine analysis at 0 and 24 weeks.
Patients in Cohorts I and II received fixed daily doses of corticosteroids, non-steroidal anti- inflammatory agents, and methotrexate during the initial 24-week RCT. Thereafter, these
Cohort I
24 weeks
(fixed dose of daily corticosteroids, NSAIDs, and
methotrexate) (flexible dose of daily corticosteroids, NSAIDs, and methotrexate) Cohort II
Methotrexate
(n = 44) Tocilizumab +
Methotrexate (n = 46)
48 weeks
(flexible dose of daily corticosteroids, NSAIDs, and methotrexate)
Cohort III Tocilizumab ± Methotrexate (n = 41)
Tocilizumab + Methotrexate
Fig. 1. Study population and design. Cohorts I and II were extracted from clinical trial data of tocilizumab in patients with active rheumatoid arthritis. Cohort I comprised 44 patients who received methotrexate for 24 weeks, followed by tocilizumab for 48 weeks. Cohort II comprised 46 patients who received tocilizumab for 72 weeks. Cohort III comprised 41 patients who received tocilizumab with or without methotrexate for 24 weeks on clinical practice.
NSAIDs = nonsteroidal anti-inflammatory drugs.
patients participated in an open extension phase during which they received tocilizumab treatment for 48 weeks, and changes in the doses of corticosteroids, non-steroidal anti- inflammatory agents, and methotrexate were permitted during weeks 24–72 of the study.
Therefore, we could evaluate weight changes among patients in Cohort I during the initial 24-week period of methotrexate treatment and the subsequent 48-week period of tocilizumab treatment. In Cohort III, doses of corticosteroids, non-steroidal anti-inflammatory agents, and methotrexate were not fixed.
Study variables
Data describing each patient's age, gender, body weight, height, BMI, disease activity score in 28 joints, prednisolone use, and concomitant DMARD use were collected at baseline and at 24 weeks. The patients' nutritional status was classified by their baseline BMIs as normal weight (< 25 kg/m2) and overweight (≥ 25 kg/m2), based on the World Health Organization's criteria. Weight gain was defined as an increase in weight of ≥ 0.1 kg, and weight loss was defined as a decrease in weight of ≥ 0.1 kg. Patient responses to treatment were assessed by the American College of Rheumatology 20 response criteria (ACR20).
We evaluated levels of adiponectin, leptin, and resistin before and 24 weeks after treatment by using a Magnetic Luminex Multiplex Assay kit (R&D Systems, Inc., Minneapolis, MN, USA) in serum samples from patients in Cohorts I (methotrexate-treated) and III (tocilizumab-treated); serum samples from the patients in Cohort II were not available. We compared pre- and post-treatment body weight and adipokine levels in Cohorts I and III, and analyzed correlations between the adipokine levels and changes in body weight.
Statistical analyses
Data distribution was assessed by Kolmogorov-Smirnov tests. Continuous variables are presented as the mean and standard deviation (SD) when they accept normality, and as median with 25th and 75th percentiles when they reject normality. Proportions are presented as numbers with percentages. The independent t-test or Mann-Whitney test was used to compare the two groups depending on the distribution of the data. Paired comparison was undertaken by the paired t-test or Wilcoxon test, as appropriate. Changes in body weight and adipokine levels from baseline are expressed as mean or median differences with 95%
confidence intervals (CIs). The correlation of continuous variables was analyzed by Pearson's or Spearman's correlation coefficient, as appropriate.
Statistical analyses were undertaken in MedCalc Statistical Software, version 18.6 (MedCalc Software bvba, Ostend, Belgium). The graphs were plotted using GraphPad Prism software, version 7.00 for Windows (GraphPad Software, La Jolla, CA, USA). The temporal trends in body weight were examined using the Joinpoint Regression Program, Desktop version 4.7.0.0 (National Cancer Institute; Bethesda, Maryland, USA; http://surveillance.cancer.gov/
joinpoint/),32 which uses the Bayesian information criterion to generate different numbers of joinpoints that indicate time points at which the rate of occurrence of, or the hazard associated with, an event changes significantly, and it fits separate linear trends in each time segment. For all statistical tests, a value of P < 0.05 was considered statistically significant.
Ethics statement
The present study protocol was reviewed and approved by the Institutional Review Board (IRB) of the relevant hospitals (CBNUH IRB approval No., 2018-03-012; SNUH IRB approval No., 1711-085-901). All patients provided written informed consent prior to study enrollment.
RESULTS
Demographic characteristics and clinical variables
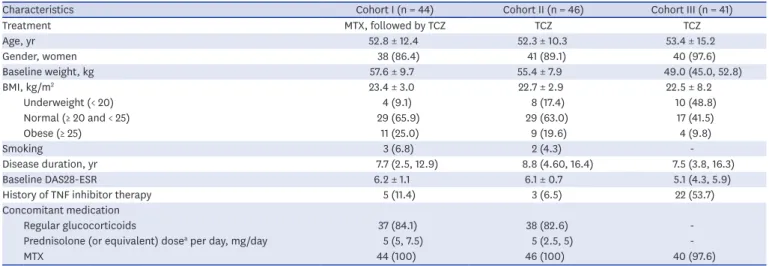
Table 1 summarizes the participants' demographic characteristics and clinical variables.
Weight changes between baseline and 24th week
Table 2 summarizes the mean weight changes during 24 weeks of treatment in three cohorts.
There was no significant weight change in Cohort I, whereas mean weight gain of 0.9 kg (95%
CI, 0.2–1.5 kg) was observed in Cohorts II+III (P = 0.010). Fig. 2A compares the percentages of patients who gained or lost weight after 24 weeks of treatment in the 3 cohorts. In Cohort I, 40.9% (18/44) of patients gained weight, 15.9% (7/44) of patients maintained their weight, and 43.2% (19/44) of patients lost weight. In Cohorts II and III, 63.0% (29/46) and 61.0%
(25/41) gained weight and 28.3% (13/46) and 36.6% (15/41) lost weight, respectively.
The weight difference before and after the 24-week treatment period did not differ between EULAR responders and non-responders in Cohort I (P = 0.747) and Cohorts II+III (P = 0.373, independent t-test). Furthermore, there was no significant difference in the proportion of weight gained between EULAR responders and non-responders, both in Cohort I (P = 0.319, Fisher exact test) and Cohorts II+III (P = 0.108, χ2 test) (Table 3).
In Cohort I, there was no linear correlation between baseline BMI and weight changes (r = 0.135, P = 0.384), although there was a weakly negative correlation in the combined Table 1. Baseline demographic data and clinical parameters in the patients in the 3 study cohorts
Characteristics Cohort I (n = 44) Cohort II (n = 46) Cohort III (n = 41)
Treatment MTX, followed by TCZ TCZ TCZ
Age, yr 52.8 ± 12.4 52.3 ± 10.3 53.4 ± 15.2
Gender, women 38 (86.4) 41 (89.1) 40 (97.6)
Baseline weight, kg 57.6 ± 9.7 55.4 ± 7.9 49.0 (45.0, 52.8)
BMI, kg/m2 23.4 ± 3.0 22.7 ± 2.9 22.5 ± 8.2
Underweight (< 20) 4 (9.1) 8 (17.4) 10 (48.8)
Normal (≥ 20 and < 25) 29 (65.9) 29 (63.0) 17 (41.5)
Obese (≥ 25) 11 (25.0) 9 (19.6) 4 (9.8)
Smoking 3 (6.8) 2 (4.3) -
Disease duration, yr 7.7 (2.5, 12.9) 8.8 (4.60, 16.4) 7.5 (3.8, 16.3)
Baseline DAS28-ESR 6.2 ± 1.1 6.1 ± 0.7 5.1 (4.3, 5.9)
History of TNF inhibitor therapy 5 (11.4) 3 (6.5) 22 (53.7)
Concomitant medication
Regular glucocorticoids 37 (84.1) 38 (82.6) -
Prednisolone (or equivalent) dosea per day, mg/day 5 (5, 7.5) 5 (2.5, 5) -
MTX 44 (100) 46 (100) 40 (97.6)
Data are presented as mean ± standard deviation or median (25th and 75th percentiles), as appropriate. Proportion was presented as number (%).
MTX = methotrexate, TCZ = tocilizumab, BMI = body mass index, DAS28 = disease activity score in 28 joints, ESR = erythrocyte sedimentation rate, RA = rheumatoid arthritis, TNF = tumor necrosis factor.
aAmong the patients who used glucocorticoids regularly.
Table 2. Weight changes during 24 weeks of treatment in three cohorts
Variables Cohort I (MTX) Cohort II and III (TCZ)
Baseline weight, kg 57.6 ± 9.7 53.4 ± 8.6
Weight after 24 weeks 57.4 ± 10.0 54.3 ± 8.4
Difference −0.2 (−0.8 to 0.5) +0.9 (0.2 to 1.5)
P values 0.630 0.010
Data are presented as mean with standard deviation and the difference were presented as mean with 95%
confidence interval.
MTX = methotrexate-treated group, TCZ = tocilizumab-treated group.
analysis of Cohorts II and III (r = −0.278, P = 0.010). There was no significant difference in the proportion of weight gained between those who were underweight and overweight at baseline in Cohort I (P = 0. 812) or in Cohort II+III (P = 0.089) (Table 4).
Serial weight changes for 72 weeks
In Cohort II, mean changes in patient body weight after 24, 48, and 72 weeks of tocilizumab treatment were +0.7 kg (95% CI, 0.0–1.4 kg), +1.2 kg (95% CI, 0.4–2.0 kg), and +1.1 kg (95% CI, 0.2–2.0 kg), respectively, compared with their weight at baseline. In addition, we investigated the overall percent changes in body weight in Cohort II after 24, 48, and 72 weeks of tocilizumab treatment compared with that at the baseline (Fig. 2B). The mean percent changes in the patient body weight from baseline were +1.3% (0.1%–2.6%) at 24 weeks, +2.2% (0.7%–3.6%) at 48 weeks, and +2.0% (0.4%–3.7%) at 72 weeks.
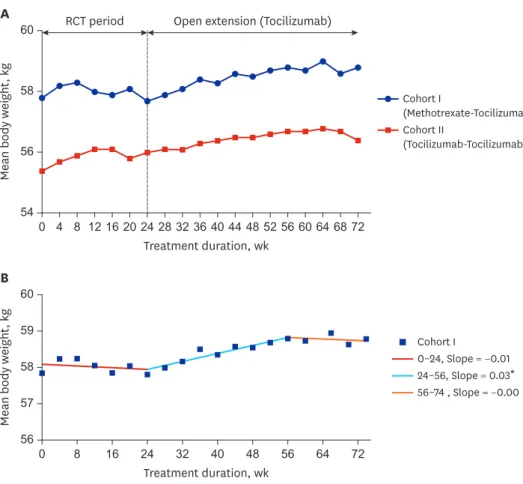
We analyzed the patients' serial weight changes during the initial 24-week treatment period as well as during subsequent treatment with tocilizumab for 48 weeks in Cohorts I and II (Fig. 3A).
Patients in Cohort I who received methotrexate only during the initial 24-week treatment period followed by tocilizumab treatment for 48 weeks during the open extension phase of the clinical
40
0 80
20 60
Cohort I (MTX) Cohort II (TCZ) Cohort III (TCZ)
Weight gain Stable Weight loss
Percent, %
A
Time, wk 2
0 4
1 3
Percent change in body weight
B
24 48 72
Fig. 2. Weight changes in the study's cohorts. (A) Percentage of patients whose weights changed after 24 weeks of treatment in the 3 cohorts. In cohort I, 40.9% of the patients gained weight, 15.9% of the patients' weights remained stable, and 43.2% of the patients lost weight following methotrexate treatment. In cohort II, 63.0% of the patients gained weight and 28.3% of the patients lost weight following tocilizumab treatment. In cohort III, 61.0% of the patients gained weight and 36.6% of the patients lost weight following tocilizumab treatment. (B) Overall percent changes in body weight in cohort II after 24, 48, and 72 weeks of tocilizumab treatment compared with baseline. The mean (95% confidence interval) percent changes in body weight were 1.3% (0.1%–2.6%) at 24 weeks, 2.2% (0.7%–3.6%) at 48 weeks, and 2.0% (0.4%–3.7%) at 72 weeks.
MTX = methotrexate, TCZ = tocilizumab.
Table 3. Subgroup analysis of weight changes according to the treatment response
Variables Cohort I (MTX) Cohort II and III (TCZ)
EULAR treatment response, moderate or good Yes (n = 8) No (n = 36) Yes (n = 75) No (n = 11)
Those who gain weight, No. (proportion) 2 (25%) 16 (44.4%) 35 (47.7%) 8 (72.7%)
P value 0.319a 0.108
MTX = methotrexate-treated group, TCZ = tocilizumab-treated group, EULAR = European League Against Rheumatism.
aFisher exact test, otherwise analyzed by χ2 test.
Table 4. Subgroup analysis of weight changes according to the baseline BMI
Variables Cohort I (MTX) Cohort II and III (TCZ)
Baseline BMI category Underweight (n = 4) Obese (n = 11) Underweight (n = 28) Obese (n = 13)
Those who gain weight, No. (proportion) 2 (50%) 3 (27.3%) 17 (60.7%) 4 (30.8%)
P value 0.812a 0.089
MTX = methotrexate-treated group, TCZ = tocilizumab-treated group, BMI = body mass index.
aFisher exact test, otherwise analyzed by χ2 test.
trial, showed significant weight gain during tocilizumab treatment (mean difference between week 24 and week 72: +1.1 kg; 95% CI, 0.4–1.7 kg; P = 0.004). Joinpoint regression analysis of Cohort I showed that the mean body weight started to increase at 24 weeks and plateaued at 56 weeks, thereby creating a significant joinpoint at the 24th week and 56th week (Fig. 3B).
Serum adipokine levels
Levels of adiponectin, leptin, and resistin in serum samples from patients in Cohort I did not change after methotrexate treatment (adiponectin, P = 0.081; leptin, P = 0.682; and resistin, P = 0.070) (Fig. 4), whereas these levels increased significantly in Cohort III following tocilizumab treatment (adiponectin, P < 0.001; leptin, P < 0.001; and resistin, P < 0.01), with median differences of +1,257.2 ng/mL (95% CI, 801.8–1,753.5 ng/mL) for adiponectin, +3,890.0 pg/mL (95% CI, 2,709.7–6,076.1 pg/mL) for leptin, and +826.5 pg/mL (95% CI, 268.7–1,544.1 pg/mL) for resistin (Fig. 5). After tocilizumab treatment, the leptin-adiponectin ratio increased significantly (P = 0.015) with a median difference of +2.1 pg/ng (95% CI, 0.42–
2.97 pg/ng). The leptin–adiponectin ratio did not increase significantly (P = 0.918) following methotrexate treatment (median difference, +0.1 ng/μg; 95% CI, −0.2 to 0.2 ng/μg).
The change in adipokine concentration did not showed the correlation with the weight change in adiponectin (rho = −0.014, P = 0.923 and rho = −0.040, P = 0.803), leptin (rho =
A 60
540 4 8 12 16 20 24 28 32 36 40 44 48 52 56 60 64 68 72
Mean body weight, kg
Treatment duration, wk
RCT period Open extension (Tocilizumab)
58
56
Cohort I
(Methotrexate-Tocilizumab) Cohort II
(Tocilizumab-Tocilizumab)
B
60
560 8 16 24 32 40 48 56 64 72
Mean body weight, kg
Treatment duration, wk 58
59
57
Cohort I
0–24, Slope = −0.01 24–56, Slope = 0.03* 56–74 , Slope = −0.00
Fig. 3. Patients' body weight changes during treatment. (A) Weight changes in cohorts I and II over 72 weeks.
Body weight was assessed every 4 weeks in the 2 cohorts. (B) Joinpoint regression analysis of Cohort I showed that the mean body weight started to increase at 24 weeks when tocilizumab treatment was introduced, and it plateaued at 56 weeks, creating a significant joinpoint at weeks 24 and 56. *Indicates that the slope is significantly different from zero at the alpha = 0.05 level.
−0.282, P = 0.052 and rho = −0.284, P = 0.069) and resistin (rho = −0.121, P = 0.411 and rho
= −0.107, P = 0.501) in both Cohorts I and III, respectively. In addition, in the pooled analysis of Cohorts I and III, levels of serum adiponectin, leptin, and resistin not differ between the patients who gained weight (n = 43) and those who lost weight (n = 34) (adiponectin, P = 0.308;
leptin, P = 0.321; and resistin, P = 0.170).
Regarding disease activity (DAS28ESR) and adipokine concentrations at baseline in pooled cohort of I and III (n = 85), adiponectin (correlation coefficient r = −0.183, P = 0.094) or leptin (r = 0.074, P = 0.500) concentration did not show a specific correlation with DAS28ESR, but a correlation was observed in resistin concentration (r = 0.278, P = 0.010). In the subgroup analysis based on treatment response, the difference of adipokine concentrations between the EULAR responder and the non-responder was not significant in both Cohorts I and III (Table 5).
DISCUSSION
In this study, we investigated changes in body weight and the adipokine levels in patients with active RA who were or were not treated with tocilizumab; tocilizumab inhibits the binding of IL-6 to its receptor. The patients' body weights increased after tocilizumab therapy, even 1.5 × 10⁷
1.0 × 10⁷
5.0 × 10⁶
0 Week 0 Week 24
Adiponectin, pg/mL
A
300,000
200,000
100,000
0 Week 0 Week 24
Leptin, pg/mL
B
50,000
0 Week 0 Week 24
Resistin, pg/mL
40,000
30,000
20,000
10,000
C
Fig. 4. Serum adipokine levels after methotrexate treatment. Levels of (A) adiponectin, (B) leptin, and (C) resistin at baseline (0 weeks) and after 24 weeks of methotrexate treatment (cohort I). The serum adiponectin, leptin, and resistin levels did not change significantly (P = 0.081 for adiponectin, P = 0.682 for leptin, and P = 0.070 for resistin). The data presented are the medians with their 25th and 75th percentiles.
2.5 × 10⁷
2.0 × 10⁷
1.5 × 10⁷
1.0 × 10⁷
5.0 × 10⁶
0 Week 0 Week 24
Adiponectin, pg/mL
A ***
30,000
20,000
10,000
0 Week 0 Week 24
Leptin, pg/mL
B ***
150,000
100,000
50,000
0 Week 0 Week 24
Resistin, pg/mL
C **
Fig. 5. Serum adipokine levels after tocilizumab treatment. Serum levels of (A) adiponectin, (B) leptin, and (C) resistin at baseline (0 weeks) and after 24 weeks of tocilizumab treatment (cohort III). The serum adiponectin, leptin, and resistin levels increased significantly (**P < 0.01; ***P < 0.001). The data presented are the medians with their 25th and 75th percentiles.
among the non-responders, but no weight gains were observed among the patients who were treated with methotrexate. Therefore, weight gain appeared to be a drug-specific effect. As weight gain after treatment with TNF-alpha inhibitors has not been related to the therapeutic response,33 and weight gain after tocilizumab treatment did not appear to be associated with the therapeutic response in this study.
When we looked at the relationship between disease activity and adipokine concentrations at baseline, resistin concentration showed the positive correlation with DAS28ESR in pooled cohort of I and III. However, there was no significant decrease in resistin concentrations even when disease activity declined after tocilizumab therapy. Adipokine levels are affected by several individual characteristics of patients, such as body weight, fat mass, and insulin resistance, as well as RA. Therefore, we investigated the paired data to correct the individual characteristics of the patients that could act as a confounder, and analyzed the correlation of adipokines with EULAR response.
Obesity and rheumatoid cachexia have been associated with RA.6 However, the metabolic profile observed in patients with RA does not reflect what has been previously observed in the general population. A lipid paradox has been described, wherein low cholesterol and LDL cholesterol levels in patients with RA are associated with increased CV risks.34,35 In addition, a low BMI has been associated with accelerated mortality in patients with RA, namely, the obesity paradox. Weight loss is a strong predictor of death in patients with RA, because RA cachexia rather than obesity has been associated with increased CV mortality in RA.36,37 Therefore, it is probable that the weight gain observed after tocilizumab therapy is an additional beneficial effect in RA patients.
In this regard, adipokine profiles of RA patients differ from the general population in non- inflammatory conditions. Adiponectin is a protein produced by the adipose tissue. In general, low adiponectin levels have been associated with obesity, type 2 diabetes, and atherosclerosis and the role of adiponectin in the metabolic syndrome is clearly anti-inflammatory.13,27,38 On the other hand, serum adiponectin concentrations are higher among patients with RA compared with those in healthy individuals, and were associated with increased radiographic damage and low amount of visceral fat.33,39,40 Data on the effects of anti-TNF treatments on adiponectin levels are conflicting, for which the reasons are yet to be explained and might include differences by demographics or ethnicities of patients in those studies.17,41-43. Leptin is produced in the adipose tissue, and it is a product of the OB gene.44 Moreover, leptin is a major determinant of obesity and is associated with the development of obesity or Table 5. Subgroup analysis of adipokine changes according to the treatment response
Variables Cohort I (MTX) Cohort III (TCZ)
EULAR treatment response,
moderate or good Yes (n = 8) No (n = 36) Yes (n = 36) No (n = 5)
Adiponectin, median change
(interquartile range), ng/mL −555.6 (−1,016.2 to 52.6) −171.2 (−941.7 to 380.1) 1,243.6 (626.7 to 2003.3) 2,677.5 (−103.8 to 2,803.1)
P value 0.533 0.750
Leptin, median change
(interquartile range), pg/mL −934.9 (−1,321.0 to 5.6) −202.5 (−3,530.6 to 3,325.8) 3,745.8 (1,287.3 to 7,864.2) 3,972.0 (734.0 to 7,591.4)
P value 0.593 0.780
Resistin, median change
(interquartile range) pg/mL −771.6 (−3,531.2 to 2,054.1) −1,084.6 (−5,378.6 to 619.4) 1,009.4 (−97.9 to 4,082.7) 39.4 (−396.5 to 1,363.1)
P value 0.573 0.248
MTX = methotrexate-treated group, TCZ = tocilizumab-treated group, EULAR = European League Against Rheumatism, Mann-Whitney test (independent samples).
CV disease in RA.27,33,45 Leptin is generally higher in patients with RA than in patients with degenerative arthritis and healthy individuals,46,47 and high leptin levels are associated with high RA activity and more aggressive disease course.48,49 Thus, leptin might be involved in the RA-related atherosclerosis. Date regarding the effects of anti-TNF treatments on leptin levels are also conflicting,41,42 and does not seems to directly modulate leptin levels.27 Resistin was initially implicated in the development of insulin resistance. Although resistin concentrations do not differ between healthy individuals and patients with RA, resistin levels correlated positively with C-reactive protein levels, suggesting a pro-inflammatory role.33,47 There is minimal information exists on the vascular effects of resistin and its relationship to CV risk in RA.
Recently, increased adiponectin levels, but not leptin or resistin levels, have been described after tocilizumab therapy,50 although differences in body weight after the administration of tocilizumab were unclear. The study did not limit the use of other RA medications, including steroids; therefore, any changes in weight or the adipokine levels may have been caused by dose reductions of other medications following a good response to tocilizumab therapy. In addition, the study involved European participants, and there may be ethnic differences in Asian populations.
In this study, the serum adiponectin, leptin, and resistin levels increased after tocilizumab treatment, although they did not increase after methotrexate treatment. The leptin–
adiponectin ratio, which is an insulin-resistance proxy,28,29 increased after tocilizumab therapy in our study, which led to concerns that CV disease risk factors, including insulin resistance, may deteriorate as the body weight increases following tocilizumab treatment. As with the interpretation of weight gain, the interpretation of the adipokine change should be interpreted differently in patients with RA to general population. The leptin–adiponectin ratio is known to decrease in highly active, therapy-resistant RA and to increase in early or obese RA.6 Therefore, the increase in leptin–adiponectin ratio may reflect a positive situation as opposed to RA cachexia. These findings disagree with findings from a recent study that showed that the use of tocilizumab contributed to a reduction in the leptin–adiponectin ratio in patients with RA in whom TNF inhibitors had failed compared with that in patients who switched to other TNF inhibitors.51 While the patients in that study had already failed to respond to TNF inhibitor treatment, and the investigators compared the effects of tocilizumab and other TNF inhibitors after switching, only half of the patients in our study were exposed to the effects of a TNF inhibitor; therefore, the study populations appear to differ.
As the changes in the adipokine levels did not differ between the patients who lost or gained weight, we could not attribute the weight gain observed after tocilizumab therapy to increases in the adipokine levels. Indeed, the number of patients was too small to detect statistical differences between subgroups and this is a major limitation of this study. In addition, we do not have information on diet peculiarities and physical activity of participants during the tocilizumab treatment periods, which is another important limitation. Lastly, information on comorbidities such as dyslipidemia, hypertension, and diabetes, which may affect adipokine levels, was not available. To correct individual characteristics of patients that can act as confounders, we used paired data and analyzed the association between changes in disease activity and changes in adipokine concentrations.
As far as we know, this is the first study to investigate the long-term effects of tocilizumab treatment on body weight among patients with RA. In Cohorts I and II, patients received
fixed doses of glucocorticoids and methotrexate, and changes in their body weights were evaluated every 4 weeks, which minimized the risk of influencing weight changes as the steroid doses were reduced in good responders. We could also observe the increases in body weight immediately after the initiation of tocilizumab treatment in Cohort I. In Cohort III, we could observe the change of on body weight in real practice setting, such as adjusted dose of glucocorticoid glucocorticoids and methotrexate if they shows satisfactory response to the tocilizumab treatment. The results of this study, such as the proportion of patients who gained weight in each subgroup, the scale of weight gain, and lack of correlation to treatment effects, could provide the basis to explain drug characteristics to patients when selecting subsequent therapy.
In conclusion, a statistically significant weight gain occurred among the patients with RA after tocilizumab treatment, which was sustained over the 72-week treatment period. As the tendency to gain weight was not related to the therapeutic response, the changes may have been a feature of IL-6 inhibition itself. Further studies are required to determine the effects of this weight gain on CV outcomes.
ACKNOWLEDGMENTS
The results of Cohorts I and II on the efficacy and safety of tocilizumab therapy (NCT01211834 and NCT01256736) were published in a separate paper,31 which did not address the changes in weight or adipokine concentration among participants. No parts of the current manuscript have been copied or published elsewhere. There is a difference in the composition of cohorts, but the contents of the interim analysis of this study were presented as a poster at the 21st Asia Pacific League of Associations for Rheumatology Congress (APLAR) in conjunction with the Australian Rheumatology Association, 8–11 April 2019, Brisbane, QLD, Australia, which can be accessed from https://doi.org/10.1111/1756- 185X.13545 and International Journal of Rheumatic Diseases, Volume 22, Issue S3, Pages 110 (2- 084). Some biospecimens for this study were provided by the Chungbuk National University Hospital, a member of the National Biobank of Korea.
REFERENCES
1. Lindhardsen J, Ahlehoff O, Gislason GH, Madsen OR, Olesen JB, Torp-Pedersen C, et al. The risk of myocardial infarction in rheumatoid arthritis and diabetes mellitus: a Danish nationwide cohort study.
Ann Rheum Dis 2011;70(6):929-34.
PUBMED | CROSSREF
2. Meune C, Touzé E, Trinquart L, Allanore Y. Trends in cardiovascular mortality in patients with rheumatoid arthritis over 50 years: a systematic review and meta-analysis of cohort studies. Rheumatology (Oxford) 2009;48(10):1309-13.
PUBMED | CROSSREF
3. Humphreys JH, Warner A, Chipping J, Marshall T, Lunt M, Symmons DP, et al. Mortality trends in patients with early rheumatoid arthritis over 20 years: results from the Norfolk Arthritis Register. Arthritis Care Res (Hoboken) 2014;66(9):1296-301.
PUBMED | CROSSREF
4. Solomon DH, Kremer J, Curtis JR, Hochberg MC, Reed G, Tsao P, et al. Explaining the cardiovascular risk associated with rheumatoid arthritis: traditional risk factors versus markers of rheumatoid arthritis severity. Ann Rheum Dis 2010;69(11):1920-5.
PUBMED | CROSSREF
5. Summers GD, Metsios GS, Stavropoulos-Kalinoglou A, Kitas GD. Rheumatoid cachexia and cardiovascular disease. Nat Rev Rheumatol 2010;6(8):445-51.
PUBMED | CROSSREF
6. Kerekes G, Nurmohamed MT, González-Gay MA, Seres I, Paragh G, Kardos Z, et al. Rheumatoid arthritis and metabolic syndrome. Nat Rev Rheumatol 2014;10(11):691-6.
PUBMED | CROSSREF
7. Jacobsson LT, Turesson C, Hanson RL, Pillemer S, Sievers ML, Pettitt DJ, et al. Joint swelling as a predictor of death from cardiovascular disease in a population study of Pima Indians. Arthritis Rheum 2001;44(5):1170-6.
PUBMED | CROSSREF
8. Poole CD, Conway P, Currie CJ. An evaluation of the association between C-reactive protein, the change in C-reactive protein over one year, and all-cause mortality in chronic immune-mediated inflammatory disease managed in UK general practice. Rheumatology (Oxford) 2009;48(1):78-82.
PUBMED | CROSSREF
9. Agca R, Heslinga SC, Rollefstad S, Heslinga M, McInnes IB, Peters MJ, et al. EULAR recommendations for cardiovascular disease risk management in patients with rheumatoid arthritis and other forms of inflammatory joint disorders: 2015/2016 update. Ann Rheum Dis 2017;76(1):17-28.
PUBMED | CROSSREF
10. Popkova TV, Novikova DS, Gasparyan AY, Nasonov EL. Cardiovascular effects of methotrexate in rheumatoid arthritis revisited. Curr Med Chem 2015;22(16):1903-10.
PUBMED | CROSSREF
11. Micha R, Imamura F, Wyler von Ballmoos M, Solomon DH, Hernán MA, Ridker PM, et al. Systematic review and meta-analysis of methotrexate use and risk of cardiovascular disease. Am J Cardiol 2011;108(9):1362-70.
PUBMED | CROSSREF
12. Roubille C, Richer V, Starnino T, McCourt C, McFarlane A, Fleming P, et al. The effects of tumour necrosis factor inhibitors, methotrexate, non-steroidal anti-inflammatory drugs and corticosteroids on cardiovascular events in rheumatoid arthritis, psoriasis and psoriatic arthritis: a systematic review and meta-analysis. Ann Rheum Dis 2015;74(3):480-9.
PUBMED | CROSSREF
13. Ferraz-Amaro I, González-Juanatey C, López-Mejias R, Riancho-Zarrabeitia L, González-Gay MA.
Metabolic syndrome in rheumatoid arthritis. Mediators Inflamm 2013;2013:710928.
PUBMED | CROSSREF
14. Szekanecz Z, Kerekes G, Soltész P. Vascular effects of biologic agents in RA and spondyloarthropathies.
Nat Rev Rheumatol 2009;5(12):677-84.
PUBMED | CROSSREF
15. Lee JL, Sinnathurai P, Buchbinder R, Hill C, Lassere M, March L. Biologics and cardiovascular events in inflammatory arthritis: a prospective national cohort study. Arthritis Res Ther 2018;20(1):171.
PUBMED | CROSSREF
16. Rajbhandary R, Khezri A, Panush RS. Rheumatoid cachexia: what is it and why is it important? J Rheumatol 2011;38(3):406-8.
PUBMED | CROSSREF
17. Engvall IL, Tengstrand B, Brismar K, Hafström I. Infliximab therapy increases body fat mass in early rheumatoid arthritis independently of changes in disease activity and levels of leptin and adiponectin: a randomised study over 21 months. Arthritis Res Ther 2010;12(5):R197.
PUBMED | CROSSREF
18. Peters MJ, Watt P, Cherry L, Welsh P, Henninger E, Dijkmans BA, et al. Lack of effect of TNFalpha blockade therapy on circulating adiponectin levels in patients with autoimmune disease: results from two independent prospective studies. Ann Rheum Dis 2010;69(9):1687-90.
PUBMED | CROSSREF
19. Gonzalez-Gay MA, Garcia-Unzueta MT, Berja A, Gonzalez-Juanatey C, Miranda-Filloy JA, Vazquez- Rodriguez TR, et al. Anti-TNF-alpha therapy does not modulate leptin in patients with severe rheumatoid arthritis. Clin Exp Rheumatol 2009;27(2):222-8.
PUBMED
20. McInnes IB, Thompson L, Giles JT, Bathon JM, Salmon JE, Beaulieu AD, et al. Effect of interleukin-6 receptor blockade on surrogates of vascular risk in rheumatoid arthritis: MEASURE, a randomised, placebo-controlled study. Ann Rheum Dis 2015;74(4):694-702.
PUBMED | CROSSREF
21. Gabay C, McInnes IB, Kavanaugh A, Tuckwell K, Klearman M, Pulley J, et al. Comparison of lipid and lipid-associated cardiovascular risk marker changes after treatment with tocilizumab or adalimumab in patients with rheumatoid arthritis. Ann Rheum Dis 2016;75(10):1806-12.
PUBMED | CROSSREF
22. Zhang J, Xie F, Yun H, Chen L, Muntner P, Levitan EB, et al. Comparative effects of biologics on cardiovascular risk among older patients with rheumatoid arthritis. Ann Rheum Dis 2016;75(10):1813-8.
PUBMED | CROSSREF
23. Kim SC, Solomon DH, Rogers JR, Gale S, Klearman M, Sarsour K, et al. Cardiovascular safety of tocilizumab versus tumor necrosis factor inhibitors in patients with rheumatoid arthritis: a multi- database cohort study. Arthritis Rheumatol 2017;69(6):1154-64.
PUBMED | CROSSREF
24. Curtis JR, Perez-Gutthann S, Suissa S, Napalkov P, Singh N, Thompson L, et al. Tocilizumab in rheumatoid arthritis: a case study of safety evaluations of a large postmarketing data set from multiple data sources. Semin Arthritis Rheum 2015;44(4):381-8.
PUBMED | CROSSREF
25. Gottenberg JE, Morel J, Constantino A, Bardin T, Cantagrel A, Combe B, et al. Similar rates of death, serious infections, cancers, major cardiovascular events in patients treated with abatacept, rituximab and tocilizumab: long-term registry data in 4498 patients with rheumatoid arthritis. Arthritis Rheumatol 2016;(Suppl 10):2614.
26. Giles JT, Sattar N, Gabriel S, Ridker PM, Gay S, Warne C, et al. Cardiovascular safety of tocilizumab versus etanercept in rheumatoid arthritis: a randomized controlled trial. Arthritis Rheumatol 2020;72(1):31-40.
PUBMED | CROSSREF
27. Gómez R, Conde J, Scotece M, Gómez-Reino JJ, Lago F, Gualillo O. What's new in our understanding of the role of adipokines in rheumatic diseases? Nat Rev Rheumatol 2011;7(9):528-36.
PUBMED | CROSSREF
28. Inoue M, Maehata E, Yano M, Taniyama M, Suzuki S. Correlation between the adiponectin-leptin ratio and parameters of insulin resistance in patients with type 2 diabetes. Metabolism 2005;54(3):281-6.
PUBMED | CROSSREF
29. Inoue M, Yano M, Yamakado M, Maehata E, Suzuki S. Relationship between the adiponectin-leptin ratio and parameters of insulin resistance in subjects without hyperglycemia. Metabolism 2006;55(9):1248-54.
PUBMED | CROSSREF
30. Frühbeck G, Catalán V, Rodríguez A, Gómez-Ambrosi J. Adiponectin-leptin ratio: a promising index to estimate adipose tissue dysfunction. Relation with obesity-associated cardiometabolic risk. Adipocyte 2018;7(1):57-62.
PUBMED | CROSSREF
31. Baek HJ, Lim MJ, Park W, Park SH, Shim SC, Yoo DH, et al. Efficacy and safety of tocilizumab in Korean patients with active rheumatoid arthritis. Korean J Intern Med 2019;34(4):917-31.
PUBMED | CROSSREF
32. Yu B, Barrett M, Kim HJ, Feuer E. Estimating joinpoints in continuous time scale for multiple change- point models. Comput Stat Data Anal 2007;51(5):2420-7.
CROSSREF
33. Otero M, Lago R, Gomez R, Lago F, Dieguez C, Gómez-Reino JJ, et al. Changes in plasma levels of fat- derived hormones adiponectin, leptin, resistin and visfatin in patients with rheumatoid arthritis. Ann Rheum Dis 2006;65(9):1198-201.
PUBMED | CROSSREF
34. Myasoedova E, Crowson CS, Kremers HM, Roger VL, Fitz-Gibbon PD, Therneau TM, et al. Lipid paradox in rheumatoid arthritis: the impact of serum lipid measures and systemic inflammation on the risk of cardiovascular disease. Ann Rheum Dis 2011;70(3):482-7.
PUBMED | CROSSREF
35. Robertson J, Peters MJ, McInnes IB, Sattar N. Changes in lipid levels with inflammation and therapy in RA: a maturing paradigm. Nat Rev Rheumatol 2013;9(9):513-23.
PUBMED | CROSSREF
36. Baker JF, Billig E, Michaud K, Ibrahim S, Caplan L, Cannon GW, et al. Weight loss, the obesity paradox, and the risk of death in rheumatoid arthritis. Arthritis Rheumatol 2015;67(7):1711-7.
PUBMED | CROSSREF
37. Challal S, Minichiello E, Boissier MC, Semerano L. Cachexia and adiposity in rheumatoid arthritis.
Relevance for disease management and clinical outcomes. Joint Bone Spine 2016;83(2):127-33.
PUBMED | CROSSREF
38. Kadowaki T, Yamauchi T. Adiponectin and adiponectin receptors. Endocr Rev 2005;26(3):439-51.
PUBMED | CROSSREF
39. Ebina K, Fukuhara A, Ando W, Hirao M, Koga T, Oshima K, et al. Serum adiponectin concentrations correlate with severity of rheumatoid arthritis evaluated by extent of joint destruction. Clin Rheumatol 2009;28(4):445-51.
PUBMED | CROSSREF
40. Giles JT, van der Heijde DM, Bathon JM. Association of circulating adiponectin levels with progression of radiographic joint destruction in rheumatoid arthritis. Ann Rheum Dis 2011;70(9):1562-8.
PUBMED | CROSSREF
41. Popa C, Netea MG, de Graaf J, van den Hoogen FH, Radstake TR, Toenhake-Dijkstra H, et al. Circulating leptin and adiponectin concentrations during tumor necrosis factor blockade in patients with active rheumatoid arthritis. J Rheumatol 2009;36(4):724-30.
PUBMED | CROSSREF
42. Derdemezis CS, Filippatos TD, Voulgari PV, Tselepis AD, Drosos AA, Kiortsis DN. Effects of a 6-month infliximab treatment on plasma levels of leptin and adiponectin in patients with rheumatoid arthritis.
Fundam Clin Pharmacol 2009;23(5):595-600.
PUBMED | CROSSREF
43. Nagashima T, Okubo-Fornbacher H, Aoki Y, Kamata Y, Kimura H, Kamimura T, et al. Increase in plasma levels of adiponectin after administration of anti-tumor necrosis factor agents in patients with rheumatoid arthritis. J Rheumatol 2008;35(5):936-8.
PUBMED
44. Maffei M, Halaas J, Ravussin E, Pratley RE, Lee GH, Zhang Y, et al. Leptin levels in human and rodent: measurement of plasma leptin and ob RNA in obese and weight-reduced subjects. Nat Med 1995;1(11):1155-61.
PUBMED | CROSSREF
45. Tilg H, Moschen AR. Adipocytokines: mediators linking adipose tissue, inflammation and immunity. Nat Rev Immunol 2006;6(10):772-83.
PUBMED | CROSSREF
46. Tian G, Liang JN, Pan HF, Zhou D. Increased leptin levels in patients with rheumatoid arthritis: a meta- analysis. Ir J Med Sci 2014;183(4):659-66.
PUBMED | CROSSREF
47. Yoshino T, Kusunoki N, Tanaka N, Kaneko K, Kusunoki Y, Endo H, et al. Elevated serum levels of resistin, leptin, and adiponectin are associated with C-reactive protein and also other clinical conditions in rheumatoid arthritis. Intern Med 2011;50(4):269-75.
PUBMED | CROSSREF
48. Lee YH, Bae SC. Circulating leptin level in rheumatoid arthritis and its correlation with disease activity: a meta-analysis. Z Rheumatol 2016;75(10):1021-7.
PUBMED | CROSSREF
49. Cao H, Lin J, Chen W, Xu G, Sun C. Baseline adiponectin and leptin levels in predicting an increased risk of disease activity in rheumatoid arthritis: a meta-analysis and systematic review. Autoimmunity 2016;49(8):547-53.
PUBMED | CROSSREF
50. Fioravanti A, Tenti S, Bacarelli MR, Damiani A, Li Gobbi F, Bandinelli F, et al. Tocilizumab modulates serum levels of adiponectin and chemerin in patients with rheumatoid arthritis: potential cardiovascular protective role of IL-6 inhibition. Clin Exp Rheumatol 2019;37(2):293-300.
PUBMED
51. Virone A, Bastard JP, Fellahi S, Capeau J, Rouanet S, Sibilia J, et al. Comparative effect of tumour necrosis factor inhibitors versus other biological agents on cardiovascular risk-associated biomarkers in patients with rheumatoid arthritis. RMD Open 2019;5(2):e000897.
PUBMED | CROSSREF