A Definition of Korean Heat Waves and Their Spatio-temporal Patterns
Gwangyong Choi*
우리나라에 적합한 열파의 정의와 그 시·공간적 발생패턴
최광용*
Abstract:This study provides a definition of heat waves, which indicate the conditions of strong sultriness in summer, appropriate to Korea and intends to clarify long term(1973-2006) averaged spatial and temporal patterns of annual frequency of heat waves with respect to their intensity. Based on examination of the Korean mortality rate changes due to increase of apparent temperature under hot and humid summer conditions, three consecutive days with at least 32.5℃, 35.5℃, 38.5℃, and 41.5℃ of daily maximum Heat Index are defined as the Hot Spell(HS), the Heat Wave(HW), the Strong Heat Wave(SHW), and the Extreme Heat Wave(EHW), respectively. The annual frequency of all categories of heat waves is relatively low in high-elevated regions or on islands adjacent to seas. In contrast, the maximum annual frequency of heat waves during the study period as well as annual average frequency are highest in interior, low-elevated regions along major rivers in South Korea, particularly during the Changma Break period(between late July and mid-August). There is no obvious increasing or decreasing trend in the annual total frequency of all categories of heat waves for the study period. However, the maximum annual frequencies of HS days at each weather station were recorded mainly in the 1970s, while most of maximum frequency records of both the HW and the SHW at individual weather stations were observed in the 1990s. It is also revealed that when heat waves occur in South Korea high humidity as well as high temperature contributes to increasing the heat wave intensity by 4.3-9.5℃. These results provide a useful basis to help develop a heat wave warning system appropriate to Korea.
Key words: heat wave, heat index, mortality, humidity, Korea
요약:본 연구는 우리나라 실정에 맞는 여름철 강한 무더위인 열파(Heat Wave)를 정의하고, 각 강도별 장기간(1973-2006) 평균적 인 열파 발생빈도의 시·공간적 분포 특징을 밝히고자 하였다. 고온다습한 한반도 여름몬순 기후하에서 체감온도와 사망자의 관계 를 분석하여, 최소 32.5℃ 및 35.5℃, 38.5℃, 41.5℃의 일최고 열지수(Heat Index)가 3일간 지속되었을 때를 더운기간(Hot Spell) 및 열파(Heat Wave), 강한열파(Strong Heat Wave), 매우강한열파(Extreme Heat Wave) 발생일로 정의하였다. 이를 바탕으로 모든 단계별 열파 연평균 발생빈도를 살펴보면, 해발고도가 높은 고지대나 바다에 인접한 도서지역에서는 낮게 나타나는 반면, 주요 대하 천에 인접한 내륙 저지대에서는 연평균 열파 발생빈도 뿐만 아니라 연구기간중 연 최다 열파 발생일수도 장마휴지기(7월 하순-8월 초순)를 중심으로 높게 나타난다. 연구기간(1973-2006) 동안 각 단계별 열파일 발생빈도에는 뚜렷한 변화가 없었으나, 더운기간 (Hot Spell)의 최고 발생빈도를 기록한 연도는 1970년대에, 열파(Heat Waves)와 강한열파(Strong Heat Wave)의 최고 발생빈도를 기록한 연도는 1990년대에 각각 집중되어 나타났다. 한편, 우리나라의 열파 발생시에는 기온 이외에도 습도의 부가적인 영향이 4.3-
* Ph.D. Candidate, Department of Geography, Rutgers, The State University of New Jersey, United States, [email protected]
1. Introduction
The abnormal stagnancy of summertime high pressure systems that accompany the muggy weather, results in more catastrophic loss of human lives per event than any other low pressure system, such as tornadoes and tropical cyclones (Changnon et al., 1996). For instance, the incidences of heat waves in July and August, 2003 due to stagnant high pressures led to more than 100,000 casualties in Europe (UNEP, 2004), and in similar cases, heat waves under hot and humid high pressures in July, 1995 and 1999 resulted in thousands of deaths in the Midwest region of the United States (Changnon et al., 1996; Palecki et al., 2001). Heat waves also affect the mortality rate and productivity of domestic animals and cause brownouts, which are temporal failures of electric supply attributable to an overuse of cooling systems during hot and humid summer days (Smoyer-Tomic et al., 2003).
Recently, it has been suggested that South Korea is not free from such catastrophic heat waves;
that summertime hot and humid weather should be regarded as a serious natural disaster; and that a warning system should be prepared to minimize its damages (Choi et al., 2005). In reality, thousands of deaths, mainly among the elderly and patients with circulatory problems, occurred due to abnormally hot and humid bioclimatic conditions during July and August,
1994 in South Korea (Choi et al., 2006). The incidences of strong high pressure accompanying heat waves appear at synoptic scales so that in the summer of 1994, neighboring Japan also lost large numbers of people due to heat strokes attributable to heat waves (Nakai et al., 1999).
Thus, the rate of human mortality is the most critical indicator that can be used in defining heat waves.
In spite of the increasing concern about casualties attributable to heat waves, there is no internationally-accepted consensus on how to define heat waves (Robinson, 2001; Meehl and Tebaldi, 2004) so that individual countries have employed their own definitions. The bioclimatic indices and methods to define the occurrences of heat waves vary country-to-country. The various methods used to find the critical thresholds of each bioclimatic index related to the definition of heat waves are generally classified into two types. One is to use the fixed thresholds of the bioclimatic index with an assumption that the bioclimatic threshold causing heat stress is physiologically identical regardless of geographical location or differences of peoples’ acclimatization (Jones et al., 1982). The other method is to use varying thresholds, such as two standard deviations from the mean of the regional bioclimate (Kalkstein and Valimont, 1986;
Robinson, 2001). The latter approach is more popular because it is agreed that acclimatization 9.5℃ 정도 열파(Heat Wave)의 강도를 높이고 있음을 알 수 있다. 이러한 연구 결과들은 우리나라에 맞는 국가 열파 경보 체계를 구 축하는데 기초자료로써 활용될 수 있을 것으로 생각된다.
주요어 : 열파, 열지수, 사망자, 습도, 한국
of human’s response to hot environments is acquired over time. For instance, the times when maximum air temperature exceeds 32℃for more than three consecutive days are regarded as heat wave episodes in Canada (Smoyer-Tomic et al., 2003), while the National Weather Service in the United States defines heat waves as two consecutive day periods in which daytime Heat Index values are 105°F (40.6℃) or higher, and nighttime Heat Index values are 80°F (26.7℃) or higher (Robinson, 2001)
To date, most countries still employ ambient air temperature as the primary indicator of heat waves. However, the differences between ambient air temperature and apparent temperature - which the human body perceives - exist due to the impacts of other climatic elements, such as high humidity which is associated with a reduction of latent heat loss through sweating. In particular, in cases of summer monsoon-affected countries at midlatitudes such as China, Japan, and Korea, high humidity as well as high temperature increases the apparent temperature in the summer monsoon season. Thus, in quantifying the perceived temperature for monsoon countries, such as Korea, it is more reasonable to utilize a bioclimatic index combining the synergetic effects of both high humidity and temperature, such as Heat Index (Choi et al., 2002; 2005).
In Korea, the terminology of heat wave has been used without a solid definition. In 2002 the Korea Meteorological Administration substituted Discomfort Index (Thom, 1959) with Heat Index (Steadman, 1979; Rothfusz, 1990) as a key bioclimatic index for the purpose of offering maps of areas experiencing heat stress. A few bioclimatic studies have examined temporal and
spatial patterns of summertime heat stress across South Korea (Lee and Jun, 1982; Choi et al., 2002; Heo et al., 2004). However, to date there has been no effort made to define Korean-type heat waves. Recently, the Korea Meteorological Administration suggested the necessity of defining heat waves and developing heat wave warning systems appropriate to Korea.
Therefore, in an effort to help define Korean heat waves and develop an appropriate heat wave warning system in Korea, this study develops categories of Korean heat waves based on the sensitivity of mortality to increments of Heat Index in South Korea. Ultimately, this study intends to clarify the spatial patterns and temporal trends of Korea heat waves for the period 1973-2006. In Section 2, the data and methods are illustrated. Section 3-1 describes the detailed definition of Korean heat waves according to the sensitivity of human mortality to increasing Heat Index, and Sections 3-2 and 3-3 analyze the spatial patterns of Korean heat waves and their temporal trends with respect to their intensity. In Section 3-4, the impacts of high humidity on the increase of heat wave intensity are discussed. In Section 4, summaries of the major findings are made and potential future directions of summertime bioclimatological studies are also discussed.
2. Data and Methods
In recent decades, many efforts have been made in improving the sophistication of bioclimatic indices in order to quantify the apparent temperature that the human body feels under hot and humid climatic conditions, such as Apparent Temperature or Heat Index (Steadman,
1979; Rothfusz, 1990) and Physiological Equivalent Temperature (Höppe, 1999). Among these indices, Heat Index is employed in this study because it has been proven to effectively predict increasing mortality due to high perceived temperature under hot and humid summer monsoons (Choi et al., 2005). The details of background, equation and charts of Heat Index are well documented in Choi et al. (2005) study, which corrects an editing erratum in the Heat Index equation first introduced by Choi et al. (2002). An increase in human mortality is associated more with daily maximum Heat Index than daily minimum or average Heat Indices (Smoyer et al., 2000; Choi et al., 2006). In this study, therefore, a long term (1973-2006) daily
maximum Heat Index data set is constructed from 6 hour (LST 3:00, 9:00, 15:00, and 21:00) temperature and relative humidity data for 61 weather stations across South Korea (Figure 1).
The human mortality data for the period 1991- 2000, which have been archived by the Korea National Statistical Office, are analyzed in order to find thresholds of Heat Index that indicate the levels of heat wave intensity. Referring to the methods in Choi et al. (2006), all disease caused mortality (001-909 in ICD-9 and A00-R99 in ICD- 10) are extracted and classified according to age.
It is revealed that the elderly are most susceptible to increases in heat stress (Sartor et al., 1995;
Díaz et al., 2002; Choi et al., 2005). Thus, all disease mortality records for the elderly population (hereafter, the elderly mortality), whose age is equal to or greater than 65 years, are extracted. Then, to normalize the changes of baseline total population and demographic structures affecting interannual variability of mortality data, summertime (June-August) daily mortality data are reconstructed with the assumption that interannual baseline population is identical to the decadal average for the elderly population. Then, daily anomaly time series of the elderly mortality are constructed by subtracting the long term (1991-2000) daily average from each daily data. The detail of methods and procedures to calculate the normalized anomaly of inter-daily elderly mortality as described above are well introduced in Choi et al. (2006).
The nonlinear regression curves between daily maximum Heat Index averaged at 23 weather stations (gray squares in Figure 1; Choi et al., 2006) and 4-day accumulation of the anomalous elderly mortality, which considers 3-day lag impacts of heat stress on the increase of mortality Figure 1. 61 weather stations across South Korea
where 6 hour temperature and relative humidity data during the period of 1973-2006 exist. Gray squares indicate the locations of 23 first-order weather stations used to derive the relationship between Heat Index and the elderly mortality.
(Choi et al., 2005), are examined to determine the levels of heat wave intensity. The other weather stations, which are located in small towns and highland areas, are excluded in the Heat Index-mortality analyses because populations nearby those weather stations are too small to represent the sensitivity of elderly mortality to perceived temperatures. According to the determined thresholds of daily maximum Heat Index, long term averaged frequency maps of heat waves are drawn with respects to their intensity. Also, time series of heat wave frequency in regards to intensity are displayed in order to understand temporal evolutions and trends of heat wave occurrences for the period, 1973-2006. To quantify how much temperature and humidity contribute to intensifying heat waves, the difference between daily maximum
Heat Index and air temperature is calculated for each category of heat wave days by weather station, and then the long term (1973-2006) average maps of humidity contribution are created with respect to the intensity of heat waves in Korea.
3. Results
1) Classification of Korean-type heat wave stages
The nonlinearity of the elderly mortality attributable to increases of daily maximum Heat Index appears as a polynomial form (Figure 2).
In Figure 2, the horizontal zero baseline Figure 2. Impacts of daily maximum Heat Indices on the 4-day accumulated anomalous elderly mortality in South Korea, 1991-2000. Max (gray bar), mean (black bar), and min (white bar) indicates maximum, averaged, and minimum mortality records as opposed to each degree Heat Index range, respectively.
indicates the long term normal rate of daily elderly mortality so that the data above or below this zero line demonstrate positive or negative departures from the daily normal rate of elderly mortality. Pairs of daily maximum Heat Index and the 4-day accumulated anomalous daily mortality data are averaged within each degree Celsius range (±0.5) of Heat Index. Maximum, average, and minimum records of anomalous mortality in each range of Heat Indices are used to identify critical points of daily maximum Heat Index dividing each heat wave stage. In detail, the regression curve in the data cloud demonstrates that the trend of mortality change from a slight decrease to an increase, when the daily maximum Heat Index exceeds 33℃. However, there is no change in the ranges between maximum and minimum anomalous mortality until the daily maximum Heat Index increases to 36℃. The maximum, average, and minimum of anomalous mortality
begin to increase above normal average lines as soon as the daily maximum Heat Index exceeds 36℃. When the daily maximum Heat Index increases to 39℃, the average number of anomalous mortality increases to 40% as opposed to maximum mortality record out of total paired data, which is identical to the maximum mortality limits in normal conditions (less than 32℃ of daily maximum Heat Index).
When daily maximum Heat Index exceeds 42℃, the average rate of anomalous mortality doubles without minimum records below zero, which indicates the normal amount of elderly mortality.
According to the identified critical thresholds of daily maximum Heat Index (Table 1), Korean- type heat waves are classified into four stages:
Hot Spell (HS), Heat Wave (HW), Strong Heat Wave (SHW), and Extreme Heat Wave (EHW).
The standardized increasing rates of anomalous elderly (±65 years old) mortality are 14 (HW), 92 Table 1. Categories of Korean heat wave stages and their impacts on the elderly mortality in Korea. * Rate denotes normalized numbers of anomalous daily deaths per one million baseline elderly population attributable to each category of heat waves.
Bioclimatic conditions Impacts on the elderly mortality Categories Daily maximum Heat Index
Description Rate*
(three consecutive days) Hot Spell
32.5℃ -35.5℃ -8 Heat Wave
(HS) Watch
Heat Wave
35.5℃ -38.5℃ +14 Heat Wave
(HW) Advisory
Strong Heat Wave
38.5℃ -41.5℃ +92 Heat Wave
(SHW) Warning
Extreme Heat Wave
≥41.5℃ +203 Heat Wave
(EHW) Emergency
The mortality curve bounces to an increasing trend.
Mortality begins to increase above normal (less than 20%)
Negative anomalies of mortality almost disappear, and the average of mortality exceeds the maximum upper limit in normal times (more than 40%) Mortality shows the highest increase, and the mortality exceeds the double of maximum in normal times (more than 80%)
Special Report
(SHW), and 203 (EHW) more deaths than daily normal per one million baseline elderly population during each category of heat waves.
In particular, 36-37℃ of daily maximum Heat Indices are the critical inflection points at which the mortality begins to rise above the long term averaged rate of normal of elderly mortality. In this study, maximum, average, and minimum values of paired data are rounded per Celsius unit so that 35.5℃of daily maximum Heat Index is used as a minimum threshold in defining Heat Wave (HS). In a similar manner, 38.5℃and 41.5
℃ of daily maximum Heat Indices, which indicate obvious increasing rates of anomalous mortality, are employed to differentiate more intensive heat waves, such as Strong Heat Wave (SHW) and Extreme Heat Wave (EHW). When the range of daily maximum Heat Indices is between 33℃and 36℃, the anomalous mortality rate is near normal. However, as suggested by the National Oceanic and Atmospheric Administration (NOAA; 1980) in the United States, prolonged exposure and physical activities in this range of Heat indices is still expected to cause heat stress, such as sunstroke, heat cramps, and heat exhaustion. Thus, 32.5℃ of daily maximum Heat Index is used as a minimum threshold in defining Hot Spell (HS).
Duration is regarded as another important component in defining heat waves. For instance, more than two consecutive days in which daytime Heat Index values are 105°F (40.6°C) or higher, and nighttime Heat Index values are 80°
F (26.7℃) or higher, are considered heat waves in the United States (Robinson, 2001). In the present study, the continuation of three consecutive days exceeding each minimum threshold of daily maximum Heat Index is used as a duration requirement in defining the
Korean-type heat waves because in South Korea peaks of mortality attributable to high apparent temperature generally occur with a three-day lag time (Choi et al., 2005). Similarly, three consecutive days are commonly used in defining heat waves in Europe and North America (Meehl and Tebaldi, 2004). Also, in calculating annual total frequency of heat waves, the continuously- occurring heat wave days after the first heat wave day, which is the third day meeting the heat wave conditions, are regarded as individual heat wave days, even if they occur in the same heat wave episode. This convention is used because it facilitates the daily forecasting of heat waves without the confusion originating from their varying durations during different heat wave episodes and because otherwise varying heat wave durations may also cause unequal conditions when calculating the annual frequency of heat waves. In addition, in the case that stages of heat waves vary for three consecutive days, the lowest stage of heat waves is assumed to represent the entire event in this study. For instance, a five consecutive day event characterized as HS-HW-SHW-HW-HS conditions on each day is classified into a HS day-a HW day-a HS day between the third and fifth days, respectively.
In summary, heat waves are defined as “a three consecutive day event with at least the given minimum threshold of daily maximum Heat Index accompanying an increase of Korean mortality” as given in Table 1. In particular, “a three consecutive day with at least 35.5℃of daily maximum Heat Index” is defined as a “Heat Wave Day (HWD)” in Korea, which is the period when the increases of summertime human mortality above normal begin to occur due to hot and humid weathers.
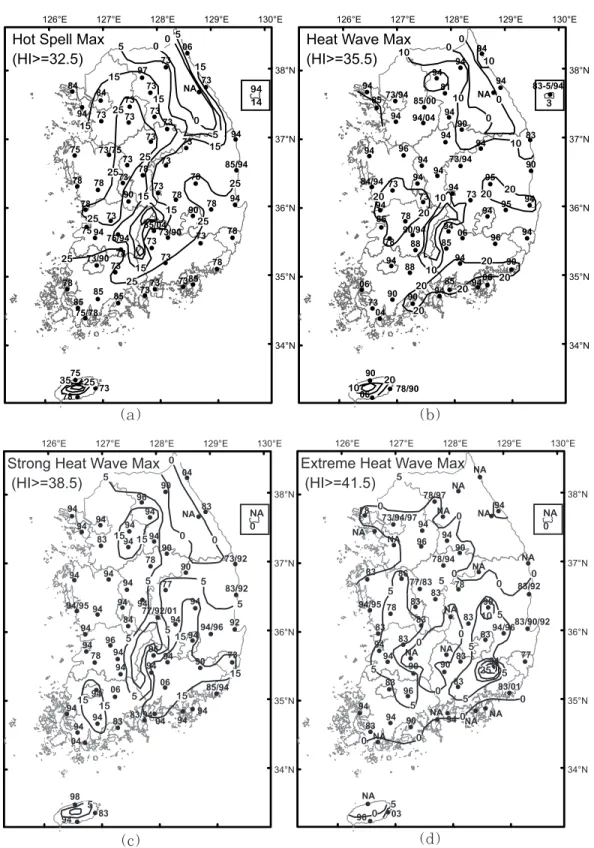
Figure 3. Long term (1973-2006) averaged annual frequency of Hot Spell (HS) days (a), Heat Wave (HW) days (b), Strong Heat Wave (SHW) days (c), and Extreme Heat Wave (EHW) days (d) in South Korea
(a) (b)
(c) (d)
2) Spatial patterns of Korean-type heat wave days
⑴ Long term (1973-2006) averaged annual frequency
Annual average frequencies of each category of heat wave days during the study period 1973- 2006 are displayed in Figures 3(a)-(d). The regions with frequent or rare occurrences of each category of heat waves are geographically clustered due to various climatic factors such as latitude, altitude, and proximity to the ocean.
First, annual average frequency of Hot Spell (HS) days (32.5-35.5℃ for three consecutive days) demonstrates a northeast low-southwest high directional pattern across South Korea due to altitude and cool air mass (Figure 3(a)). In more detail, the HS days seldom occur along the Taebaek Mountain ridge, such as Daegwallryeong whose elevation is more than 800m above the mean sea level, because high elevations reduce temperature according to the temperature lapse rate with height. Moreover, in the northeastern coastal regions (Sockcho-Uljin), the HS days occur 2-4 times per year while in the northwestern coastal regions located at similar latitudes (Ganghwa-Seosan), the HS days occur 4-8 times per year. Approaches of the Okhotsk high pressure system (Park, 1996; Kim et al., 1997) during summers may cause the low annual frequency of HS days in the northeastern regions.
In contrast, the high frequency of HS days appears more than 11 times per year in Jeju Island and the southwestern regions of the Korean Peninsula.
The high annual frequency of Heat Wave (HW) days, when the daily maximum Heat Index exceeds 35.5℃ for three consecutive days, appears in the eastern and western low-elevated
regions along the Sobaek Mountain ridge (Figure 3(b)). For instance, the annual frequency of HW days in Jeonju and Jinju is more than 7 times per year. In contrast, the nearby coastal areas along the South Sea, such as Tongyeong and Wando, occur less than 5 times per year, even though these areas are located at lower latitudes than Jeonju and Jinju. Dry air in interior regions may be more sensitive to heating by strong solar radiation during summer days due to lower heat capacity compared with wet air in the coastal areas. HW days occur less than 2 times a year not only in the Sobaek and Tabaek Mountain ridges but also along the northeastern coastal areas, which have a similar spatial pattern to that of HS days.
The annual frequency of Strong Heat Wave (SHW) days, when daily maximum Heat Index exceeds 38.5℃ for three consecutive days, exceeds two days per year in three regions: the Buyeo-Buan corridor region, the Gumi-Daegu- Miryang-Ulsan corridor region, and the Jeju downtown area (Figure 3(c)). In contrast, in most of the other coastal regions and along the high- elevated mountain ridges, the annual frequency of SHW days is less than once a year, which may be attributable to both the reduction of temperature by adiabatic lapse rates and the mitigated heating by the high heat capacity of wet air. Similarly, the Extreme Heat Wave (EHW) days, when daily maximum Heat Index exceeds 41.5℃for three consecutive days, occurs more in interior, low-elevated regions than in coastal or high-elevated regions (Figure 3(d)). In the annual frequencies of both the SHW and the EHW days, the impacts of urban heat islands are not clear.
Rather, neighboring towns with less population show higher frequencies of SHW and EHW days than more populous cities. For instance, the
(a) (b)
(c) (d)
Figure 4. Maximum annual frequency records and their corresponding years at each weather station during the study period, 1973-2006
annual frequency of EHW days is highest in Miryang, while nearby cities such as Busan and Daegu, show lower frequencies than Miryang.
This result is consistent with a finding by Choi et al. (2002) that Miryang is, in terms of summertime bioclimatic heat stress, the hottest region in Korea. Most of the regions showing high annual frequency of SHW and EHW days are located adjacent to major rivers in Korea such as Gumgang, Mangyeong-Dongjingang, Nackdonggang, Yeongsangang, and Seomjingang.
Thus, it is speculated that occurrences of heat wave days are determined not only by adiabatic heating of synoptic scale high pressure (Choi and Seon, 2006) but also by the moisture absorption of dry air as it travels along the river.
⑵ Maximum annual frequency years of heat wave days during the study period, 1973-2006
Analyses of the maximum annual total frequency of heat wave days and the corresponding years during the study period may help predict potential extreme numbers of heat wave days at each weather station in the future.
According to the analyses of maximum frequency records at each weather station during the study period 1973-2006, 71% of weathers stations showed the maximum annual frequency of HS days in the 1970s (Figure 4(a)). In contrast, 63%
of weather stations showed the maximum annual frequency of HW days in the 1990s (Figure 4(b)).
Similarly, maximum annual frequency of SHW days appeared at 73% of weather stations in the 1990s (Figure 4(c)). However, there is no specific temporal difference in the case of the maximum annual frequency of EHW days (Figure 4(d)).
Spatially, the highest maximum annual frequency of HS (≥25 days), HW(≥20 days), SHW (≥15
days), and EHW (≥5 days) appeared in the low- elevated, western and eastern regions of the Sobaek Mountain ridge.
In reality, however, the maximum records at each weather station are concentrated in particular years. For example, the maximum annual frequency of HS days occurred in 1973, 1978, and 1985. The maximum annual frequency of HW days occurred mainly in 1990 and 1994, and the large numbers of maximum annual frequency of SHW days occurred in 1994. In case of extreme heat waves, the maximum annual frequency occurred in 1978, 1983, 1990, and 1994.
3) Temporal patterns of Korean heat wave days
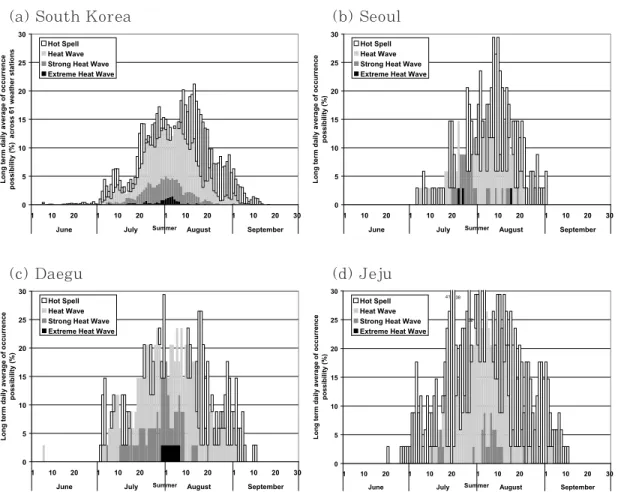
Time series data of long term (1973-2006) averaged inter-daily percentage of heat wave day occurrences across 61 weather stations during a warm season (June-September) are constructed in order to detect the days most vulnerable to heat waves during a year (Figure 5). According to the time series, it is demonstrated that most of heat wave days in Korea occur between July 20 and August 16, which is considered a climatolgoical heat wave warning period in this study. During the climatological heat wave period, 20%, 12%, and 3% of 61 weather stations experience the Hot Spell (SP) days, the Heat Wave (HW) days, and the Strong Heat Wave (SHW) days, which are the events when the daily maximum Heat Indices for three consecutive days exceed 32.5℃, 35.5℃, and 38.5℃, respectively (Figure 5(a)).
Furthermore, between August 1 and August 5, 1% of 61 weather stations experience the Extreme Heat Wave (EHW) days when the daily maximum Heat Indices for three consecutive
days exceed 41.5℃. However, the daily possibility of each category of heat wave days at different locations varies according to various climatic factors such as latitude, altitude, and proximity to the ocean. Figures 5(b)-5(d) depict the differentiated inter-daily progressions of each category of heat wave days in Seoul (37°34′N), Daegu (35°53′N), and Jeju (33°30′N), respectively.
For instance, in Seoul, most SHW days occur in late July but in Jeju they occur in early August.
Comparatively, in Daegu, which is located in the southwestern interior region of the Korean Peninsula, the SHW occur during the longer
period between mid-July and early August. The EHW days do not occur in Jeju but in Seoul and Daegu, which are located in the interior regions at higher latitudes than Jeju. This pattern implies that proximity to the ocean mitigates the occurrences of EHW days, while continentality increases the possibility of the EHW day occurrence.
The concern about more frequent high temperature events as a result of current global warming is growing (IPCC, 2001; Meehl and Tebaldi, 2004). In Korea, however, time series of interannual frequency of heat waves fluctuates
(a) South Korea (b) Seoul
(c) Daegu (d) Jeju
Figure 5. Intraseasonal fluctuations of occurrence possibility (%) of each category of heat waves, which are derived from long term (1973-2006) records: South Korea (average across 61 weather stations) (a), Seoul (b), Daegu (c), and Jeju (d)
without an obvious increasing or decreasing trend during the study period, 1973-2006 (Figure 6). The long term averages across 61 weather stations in South Korea show that the HS days, the HW days, the SHW days, and the EHW days occur 8, 4, 1, and 0.1 times per year, respectively.
In extreme years, the Korean maximum frequencies of HS days, HW days, SHW days, and EHW days, which average the maximum frequencies at 61 weather stations, are 18, 13, 8, and 1 times a year, respectively. The coefficient of variations (CV), which allows variability comparisons between different datasets, shows higher interannual variability of Korean average maximum frequency in the order of EHW days (CV=197%), SHW days (CV=141%), HW days (CV=76%), and HS days (CV=52%). In more detail, the SHW days when daily maximum Heat
Index exceeds 38.5℃for three consecutive days, occurred more frequently in particular years such as 1994, 1990, and 1978. On the other hand, in years of 1980, 1993, and 1987, annual total frequency was very low in all categories of heat wave days.
4) Contribution of high humidity to heat waves in South Korea
High humidity as well as high temperature plays an important role in increasing the perceived temperature during the muggy summer monsoon period in Northeast Asia. To quantify how much apparent temperature is increased by high humidity in each category of heat wave days, long term (1973-2006) averaged difference between daily maximum Heat Index Figure 6. Interannaul variations of annual total frequency of each category of heat wave days in South Korea for the period, 1973-2006
and temperature was calculated for each category of heat wave days across 61 individual weather stations (Figure 7). As a result, it is revealed that relative humidity increases daily maximum Heat Index by 4.3-9.5℃. The magnitude of the contribution of humidity to increasing the intensity of heat waves is greater on the Extreme Heat Wave (EHW) days than on the Hot Spell (HS) days. If we estimate contributions of air temperature to each category of heat wave days based on the median value of each category of heat waves, we can see an increase in the order of HS days (34-4.3=29.7℃), HW days (37-5.5=31.5℃), and SHW days (40- 6.9=33.1℃). In addition, the difference of temperature impacts (33.1-29.7=3.4℃) between HS days and SHW days is similar to the increased proportion contributed by humidity (6.9-4.3=2.6
℃). It implies that on heat wave days, both increase of temperature and humidity contribute to the intensification of heat waves to the similar degree.
Spatially, there is no obvious clustering pattern in the magnitude of contribution by humidity to
the intensification of each category of heat waves (Figure 8). However, differences in the range of variations exist among HS, HW, SHW, and EHW days. For instance, the impacts of humidity on the HS days ranges from 3.2℃in interior regions away from water bodies such as Hongcheon and Jecheon to 5.6℃ in coastal regions such as Seongsanpo. Similarly, in case of the HW days, the impacts of humidity vary between 3.9℃ in urban, interior regions such as Daegu and 7.2℃ in coastal regions such as Seongsanpo. Also in the case of the SHW days, the minimum (4.9℃) and maximum (8.8℃) impacts of humidity appear in interior regions such as Geochang and in nearby regions to the sea such as Boeun, respectively. These patterns imply that water bodies nearby each region such as large lakes, rivers, and seas, increase the impacts of humidity associated to the HS, the HW, and the SHW intensity. Comparatively, with less clear impacts of water bodies, the minimum (4.6℃) and maximum (12.8℃) impacts of humidity during the EHW days appears in Gangneung and in Gunsan or Seongsanpo, respectively.
Figure 7. Impacts of humidity on increasing the intensity of each category of heat waves in South Korea (averages of 61 weather stations) for the period, 1973-2006
(a) (b)
(c) (d)
Figure 8. Magnitude (unit: °C of Heat Index) of long term (1973-2006) averaged contribution of humidity to the intensification of each category of heat waves by weather station in South Korea
4. Summary and Conclusion
Heat waves have become recognized as one of the most important summertime weather-related disasters because they cause catastrophic numbers of human deaths. By examining the relationship between apparent temperature and Korean heat-related mortality, this study provides categories of heat wave intensity appropriate to Korea in order to help develop a heat wave warning system in Korea. According to the identified thresholds for each category of heat waves, this study reveals the spatial normal patterns and temporal fluctuation patterns for each category of heat waves by reconstructing long term (1973-2006) daily maximum Heat Index data set from 61 weather stations across South Korea. Major findings are summarized as follows.:
First, Korean heat waves are categorized into the Hot Spell (≥32.5℃) day, the Heat Wave (≥
35.5℃) day, the Strong Heat Wave (≥38.5℃) day, and the Extreme Heat Wave (≥41.5℃) day when daily maximum Heat Index exceeds each threshold for three consecutive days.
Second, heat waves more frequently occur in interior, low-elevated regions along major rivers around the Sobeak Mountain ridge (i.e. annually more than 25 days of HS, 20 days of HW, 15 days of SHW, and 5 days of EHW). In contrast, heat waves are rarely detected on the highlands along the Taebeak and Sobeak Mountain ridges, or on islands adjacent to seas.
Third, a climatological heat wave period, when the Hot Spell (SP), the Heat Wave (HW), and the Strong Heat Wave (SHW) occur at 20%, 12%, and 3% of 61 weather stations respectively, is identified between July 20 and August 16 across South Korea. However, regionally the heat wave
period and intensity of heat waves vary due to the impacts of latitude, altitude, and proximity to the ocean.
Fourth, there is no obvious increasing or decreasing trend in the annual frequency of each category of heat wave days during the study period (1973-2006). According to analyses of the maximum frequent year maps for each category of heat wave days, heat wave days shows more intensified patterns in the 1990s compared with before the 1990s.
Fifth, high humidity in the summer monsoon season intensifies heat waves by contributing to increases of daily maximum Heat Index by 4.3- 9.5℃. The magnitude of humidity contribution to enhancement of heat wave intensity increases when the heat wave is more extreme.
These results can be used as basic data to help develop a sophisticated heat wave warning system appropriate to Korea. According to the analysis by Choi and Seon (2006), at the synoptic scale adiabatic heating under stagnant high pressure is the major cause of heat waves.
Additionally, this study documents the importance of regional-scale high humidity on increasing the heat wave intensity under muggy summer monsoon conditions. To comprehend the mechanisms by which humidity advection or evaporation occurs in local areas, more organized observation of humidity is needed at the currently-running automated weather stations (AWS) in the future. In addition, land cover change in urban areas is expected to increase the intensity and duration of heat waves in the central business districts, which exacerbates the thermal conditions for humans in hot summers. Thus, detailed studies about the distribution of urban heat waves based on the
micro-scale observation should be carried out to maintain a better bioclimatic environment in populous urban areas. Also, human mortality attributable to heat waves are affected by local socio-economic factors such as accessibility to cooling systems and hospitals, and exposure hours to direct sunlight due to outdoor activities during heat wave episodes. Thus, time geographical studies should also be carried out, focusing on the effective utilization of public socio-economic resources associated with the mitigation of human mortality attributable to heat waves. Ultimately, these efforts may help develop systematic heat wave mitigation plans as well as heat wave warning systems appropriate to Korea.
Acknowledgement
The author is grateful to both weather data observers at the Korea Meteorological Administration and social data investigators at the Korea National Statistical Office for their efforts to collect and archive the valuable climate and mortality data. The author would also like to express many thanks to three anonymous reviewers for valuable comments and to Adam Pine and Alexis Buckley in Department of Geography at Rutgers, The State University of New Jersey for their proof-reading.
References
Changnon, S.A., Kunkel, K.E., and Reinke, B.C., 1996, Impacts and responses to the 1995 heat wave: a call to action, Bulletin of the American Meteorological Society, 77(7), 1497-1506.
Choi, G., Choi, J., Kim, J.W., and Seon S.W., 2002, The
climatology of perceived sultriness in South Korea, Journal of the Korean Geographical Society, 37(4), 385-402.
Choi, G., Choi, J., and Kwon, H.J., 2005, The impact of high apparent temperature on the increase of summertime disease-related mortality in Seoul, 1991-2000, Journal of Preventive Medicine and Public Health, 38(3), 283-290.
Choi, G., Robinson, D.A., Choi, J., and Kwon, H.J., 2006, An impact assessment of heat waves on the summertime elderly mortality in South Korea, 1991-2000, International Journal of Biometeorology (in prep).
Choi, G. and Seon S.W., 2006, Long term (1920-2006) variability of bioclimatic heat waves and their favorable synoptic conditions in South Korea, International Journal of Climatology (in prep).
Díaz, J., García, R., Velázquez de Castro, F., Hernández, E., López, C., and Otero, A., 2002, Effects of extremely hot days on people older than 65 years in Seville (Spain) from 1986 to 1997, International Journal of Biometeorology, 46(3), 145-149.
Heo, I.H., Choi, Y., and Kwon, W.T., 2004, The spatial and temporal distributions of NET (Net Effective Temperature) with a function of temperature, humidity, and wind speed in Korea, Journal of the Korean Geographical Society, 39(1), 13-26.
Höppe, P., 1999, The physiological equivalent temperature - a universal index for the biometeorological assessment of the thermal environment, International Journal of Biometeorology, 43(2), 71-75.
IPCC (Intergovernmental Panel on Climate Change), 2001, Climate change 2001: impacts, adaptation and vulnerability. Cambridge University Press.
Jones, T.S., Liang, A.P., Kilbourne, E.M., Griffin, M.R., Patriarca, P.A., Fite Wassilak, S.G., Mullan, R.J., Herrick, R.F., Donnell, H.D. Jr., Choi, K., and Thacker, S.B., 1982, Morbidity and mortality associated with the July 1980 heat wave in St.
Louis and Kansas City, MO, Journal of the
American Medical Association, 247, 3327-3331.
Kalkstein, L.S. and Valimont, K.M., 1986, An evaluation of summer discomfort in the United States using a relative climatological index, Bulletin of the American Meteorological Society, 67(7), 842-848.
Kim, H.G., Min, K.D., Kim, K.E., and Lee, K.M., 1997, Summer extraordinary low temperature in Korea and its relation to the characteristics of atmospheric circulations over Northern Hemisphere. Part I: onset of the summer extraordinary low temperature and its synoptic aspects, Journal of the Korean Meteorological Society, 33(1), 138-154.
Lee, C.B. and Jun, S.H., 1982, A study on the climatic classification of Korea by Comfort Index, Journal of the Korean Meteorological Society, 18(1), 48-52.
Meehl, G.A. and Tebaldi, C., 2004, More intense, more frequent, and longer lasting heat waves in the 21st century, Science, 305, 994-997
Nakai, S., Itoh., T., and Morimoto, T., 1999, Deaths from heat stroke in Japan: 1968-1994, International Journal of Biometeorology, 43(3), 124-127.
NOAA (National Oceanic and Atmospheric Administration), 1980, Heat Stress, Asheville, NC;
NOAA/NCDC.
Palecki, M.A., Changnon, S.A., and Kunkel, K.E., 2001, The nature and impacts of the July 1999 heat wave in the Midwestern United States: learning from the lessons of 1995, Bulletin of the American Meteorological Society, 82(7), 1353- 1367.
Park, B.I., 1996, On the anomaly patterns of summer temperature and the cool summer types over the Korean Peninsula, Journal of Geography Education, 35, 14-22.
Robinson, P.J., 2001, On the definition of a heat wave, Journal of Applied Meteorology, 40(4), 762-775.
Rothfusz, L.P., 1990, The Heat Index equation (or, more than you ever wanted to know about Heat Index), Forth Worth, Texas: NOAA, NWS, OM, Publication no SR 90-23.
Sartor, F., Snacken, R., Demuth, C., and Walckiers, D., 1995, Temperature, ambient ozone levels, and mortality during summer 1994 in Belgium, Environmental Research, 70(2), 105-113.
Smoyer, K.E., Rainham, G.C., and Hewko, J.N., 2000, Heat stress-related mortality in five cities in Southern Ontario: 1980-1996, International Journal of Biometeorology, 44(4), 190-197.
Smoyer-Tomic, K.E., Kuhn, R., and Hudson, A., 2003, Heat wave hazards: an overview of heat wave impacts in Canada, Natural Hazards, 28, 463- 485.
Steadman, R.G., 1979, The assessment of sultriness Part II: effects of wind, extra radiation, and barometric pressure on apparent temperature, Journal of Applied Meteorology, 18(7), 874-885.
Thom, E.C., 1959, The Discomfort Index, Weatherwise, 12, 57-60.
UNEP (United Nations Environmental Programme), 2004, Impacts of summer 2003 heat wave in Europe. Environment Alert Bulletin, 2, 1-3.
Correspondence: Gwangyong Choi, Department of Geography, Rutgers, The State University of New Jersey, 54 Joyce Kilmer Ave., Piscataway, NJ, 08854, The United States. (E-mail: tribute@
hanmail.net)
교신:최광용, 미국 럿거스 뉴저지 주립대학 지리학과, (이 메일: [email protected])
Received December 11, 2006 Accepted December 22, 2006