RESEARCH ARTICLE
Received: November 3, 2020, Revised: November 19, 2020, Accepted: December 7, 2020 eISSN 2233-7679
†Correspondence to: Mi-Sook Yoon, https://orcid.org/0000-0001-8029-128X
Department of Dental Hygiene, Shinhan University, 95 Hoam-ro, Uijeongbu 11644, Korea Tel: +82-31-870-3451, Fax: +82-31-870-3459, E-mail: [email protected]
Copyright © The Korean Society of Dental Hygiene Science.
Job Analysis by Department in Clinical Practice for
Realization of Legal Scope of Dental Hygienists: Focusing on Conservation, Pediatric Dentistry, Prosthodontics, Oral and Maxillofacial Surgery, and Implant Departments
Mi-Sook Yoon
†Department of Dental Hygiene, Shinhan University, Uijeongbu 11644, Korea
Background: The objective of the present study was to specifically divide the various work performed by dental hygienists in clinical
practice for legal amendments regarding problems associated with conflict between job roles and illegal delegation to establish key basic data for legislation and policy utilization for realization of legal scope of dental hygienists.
Methods: The study used work reports drafted based on research methods in the
“Second Job Analysis Report on Dental Hygienists” researched by the Korean Health Personnel Licensing Examination Institute in 2012 and “Opinions of Dentists on Actual and Legal Work of Dental Hygienists,” a report published by the Korean Dental Hygienists Association. Of these, the study focused on conservation dentistry, pediatric dentistry, prosthodontics, oral and maxillofacial surgery, and dental implant treatment, which make up some of the fields covered by dental hygiene practice, to investigate and analyzed work performed by clinical experience.
Results: Analysis of work actually performed in dental practice showed that for work related to 33 items presented in the study
methods, the participants responded that they are currently performing such work or are likely to perform such work in the future, although there were differences by year. Investigation by type of workplace showed that dental hygienists working in university hospitals could perform the work presented if they had ≥5 years of dental hygienist experience, whereas dental hygienists working in dental clinics or hospitals could perform simple duties in their first year and performed more diverse duties with greater degree of difficulty after their second to fourth year.
Conclusion: The reality that medical assistance during surgical operations and various procedures that is still being performed is
no longer legally protected directly contradicts the needs in dental practice, and thus, there is the need to amend laws that are realistic by clearly recognizing the work of dental hygienists.
Key Words: Clinical dental practice, Dental assist, Dental hygienist, Legal scope
Introduction
South Korea adopted the dental hygienist system for the first time in 1965 and has continued to develop dental hygienists. Over the past 50 years with licenses issued by the Minister of Health and Welfare, dental hygienists have performed various work throughout dentistry together with dentists while undergoing quantitative expansion and
changes in educational curriculum for 3- and 4-year
programs. The length of program changed from 2 years to
3 years starting from 1994, followed by Yonsei University
Wonju College of Medicine starting a 4-year program in
2002. As of December 2019, there are 82 educational
institutions with dental hygiene program in South Korea
with 5,190 enrollees. Moreover, there is an increasing
trend in the number of licensed dental hygienists with
4,890 licensed dental hygienists by 2020
1).
Up to now, the legal scope of dental hygienists consisted of eight duties related to prevention of dental and oral diseases and hygiene care, including installation and removal of arch wire; fluoride application; diagnostic intraoral radiography; temporary filling; installation of temporary attachments; removal of dental attachments;
removal of dental deposits such as tartar; dental impressions; and others. In other words, their work is limited to work related to prevention of dental and oral diseases and hygiene care, which is quite different from the actual work performed in clinical dental practice
2).
Moreover, dental hygienists are regulated to perform their work as instructed by a dentist, but because medical assistance work is not clearly specified in the Enforcement Decree of the Medical Technologists, Etc. Act, some claim that such work is illegal. A study by Shin et al.
3)reported that nursing assistants were performing work within the legal scope of dental hygienists, including teeth cleaning and polishing (91%); intraoral radiography (97%); extraoral radiography (94%); and dental caries prevention-related work such as application of fluoride and dental sealants (55%). The study reported that because the work within the legal scope of dental hygienists was being performed at a high rate by nursing assistants, causing major conflict between job roles with dental hygienists. Although much time has passed and broadly defined work scope of dental hygienists has been specified through amendment of enforcement decree, confusion and problems with work and roles between oral healthcare personnel remain unresolved and dispute about work areas still continue.
With respect to problems with work areas that lead to dispute between job roles, nursing assistants were not allowed to perform some of the work that dental hygienists had been performing as the work scope of dental hygienists was specified by law, while differences in the interpretation of terms such as medical cooperation and assistance have led to dispute over work area, such as surgical assistance, measurement of vital signs, and injections. As a result, increase in legal disputes becomes inevitable regardless of the reality inside treatment rooms.
Therefore, more fundamental, realistic, and consistent
legal and institutional measures are deemed necessary for the supply and demand of personnel throughout the entire field of dentistry
4). The reason is that fee-for-service in the national health insurance system divides the overall work performed by dental hygienists, such as medical assistance work, by the procedure performed to determine the labor cost, whereas laws determine the work scope of dental hygienists on a case-by-case basis and take the paradoxical position of having to determine the work scope based on cases penalized for deviating from the work scope.
The current dental hygiene curriculum in South Korea includes broad range of area of concentration and related courses. However, the work scope in clinical practice is not being sufficiently reflected in laws, and as a result, illegal delegation and illegal controversies continue, which makes it difficult for dental hygienists to provide high-quality dental care services. Legal amendments should be made based on systematic review and determination of validity by the government first instead of prioritizing consensus gathering between job roles
5).
Dental hygienists currently perform a significant amount of medical assistance work, in addition to their legally defined work. Therefore, to prevent them from becoming potential lawbreakers in some cases, depending on the authoritative interpretation by the Ministry of Health and Welfare, the gap that currently exists between actual clinical practice and relevant regulations must be eliminated as much as possible and legal amendment must take place from a macro perspective
6).
Accordingly, the researchers of the present study
specifically divided and analyzed various work performed
by dental hygienists in clinical practice for legal
amendments regarding problems associated with conflict
between job roles and illegal delegation. As part of that
work scope, the study focused on conservation dentistry,
pediatric dentistry, prosthodontics, oral and maxillofacial
surgery, and dental implant treatment in conducting job
survey and correlation analysis by clinical experience and
workplace to establish basic data needed for legislation
and policy utilization for realization of legal scope of
dental hygienists.
Table 1. General Characteristics of Participants
Division Frequency
Sex Male 6 (3.1)
Female 189 (96.9)
Graduation year Before 2005 27 (13.8)
2005∼2009 17 (8.7)
2010∼2015 52 (26.7)
2016∼2018 72 (36.9)
After 2019 27 (13.8)
Clinical experience (y) 1 31 (15.9)
2∼4 74 (37.9)
≥5 90 (46.2)
Workplace University hospital level 31 (15.9) Dental hospital level 89 (45.6) Dental clinics 75 (38.5)
Department Not divided 32 (16.4)
Orthodontics 31 (15.9)
General dentistry 9 (4.6) Diagnosis/treatment 7 (3.6) Prosthodontics 30 (15.4)
Periodontics 17 (8.7)
Oral surgery 17 (8.7)
Conservation dentistry 14 (7.2) Pediatric dentistry 10 (5.1)
Administration 2 (1)
Oral medicine 5 (2.6)
Oral hygiene 3 (1.5)
Dental implants 11 (5.6)
Others 7 (3.6)
Total 195 (100.0)
Values are presented as number (%).
Materials and Methods
1. Materials
The study recruited 250 dental hygienists from university hospitals, dental hospitals, and dental clinics located in Seoul and Gyeonggi region that were randomly selected. The recruits were requested for cooperation through an explanation about the questionnaire survey and a self-reporting questionnaire was distributed to 220 dental hygienists who consented to participate in the study. The data collection period was between June 2019 and February 2020. After excluding 25 sets for insufficient responses, data from 195 participants were analyzed.
2. Methods
The study used a job survey tool that was edited based on the job description contained in the “Second Job Analysis Report on Dental Hygienists,”
7)which was researched by the Korean Health Personnel Licensing Examination Institute in 2012 targeting active dental hygienists and instructors, and “A study on the dentist’s opinion on the actual work and legal work of dental hygienists,”
8)which is a report published by the Korean Dental Hygienists Association.
The questionnaire consisted of five items regarding the general characteristics of participants, including sex, graduation year, clinical experience, workplace, and department. In addition, some parts of dental hygiene practice were extracted for the items that were constructed by dividing the duties of dental hygienists based on dental hygiene care process, resulting in 14 items on duties related to prosthodontics and dental implant treatment; 12 items on duties related to conservation dentistry and pediatric dentistry; and seven items on duties related to oral and maxillofacial surgery. Work experience was divided into 1 year, 2∼4 years, ≥5 years, and likely to perform in the future based on the classification criteria given in the methods section of “A study on the dentist’s opinion on the actual work and legal work of dental hygienists”
8). The goal was to prove the work of dental hygienists by comparison with the findings in the present study. The participants were instructed to mark ‘likely to perform in the future’ if they are not currently performing
that work, but may perform such work in the future as their work experience grows or they are transferred to a different department.
Collected data were analyzed using IBM SPSS Statistics for Windows, ver. 25.0 (IBM Corp., Armonk, NY, USA). With respect to the analytic technique, frequency and percentage were calculated for the general characteristics of participants and duties performed during patient care. Moreover, chi-squared test was performed with statistical significance level of 0.05 to investigate the associations with clinical experience of dental hygienists with respect to job performance.
Results
1. General characteristics of participants
The general characteristics of participants were as
Table 2. Duties Performed in Conservation Dentistry and Pediatric Dentistry
Division University
hospital level
Dental
hospital level Dental clinics Total p-value Duties
performed in conservation dentistry/pedia tric dentistry
Rubber dam isolation (y)
1 5 (16.1) 22 (24.7) 31 (41.3) 58 (29.7) 0.046
2∼4 9 (29.0) 26 (29.2) 22 (29.3) 57 (29.2)
≥5 12 (38.7) 22 (24.7) 15 (20.0) 49 (25.1)
Likely to perform in the future
5 (16.1) 19 (21.3) 7 (9.3) 31 (15.9)
Matrix band technique (y)
1 5 (16.1) 13 (14.6) 27 (36.0) 45 (23.1) 0.006
2∼4 8 (25.8) 24 (27.0) 23 (30.7) 55 (28.2)
≥5 10 (32.3) 21 (23.6) 15 (20.0) 46 (23.6)
Likely to perform in the future
8 (25.8) 31 (34.8) 10 (13.3) 49 (25.1)
Temporary filling (y)
1 4 (12.9) 21 (23.6) 34 (45.3) 59 (30.3) 0.001
2∼4 8 (25.8) 30 (33.7) 23 (30.7) 61 (31.3)
≥5 12 (38.7) 27 (30.3) 16 (21.3) 55 (28.2)
Likely to perform in the future
7 (22.6) 11 (12.4) 2 (2.7) 20 (10.3)
Assistance for restorative treatment (y)
1 6 (19.4) 23 (25.8) 34 (45.3) 63 (32.3) 0.002
2∼4 6 (19.4) 29 (32.6) 24 (32.0) 59 (30.3)
≥5 13 (41.9) 25 (28.1) 16 (21.3) 54 (27.7)
Likely to perform in the future
6 (19.4) 12 (13.5) 1 (1.3) 19 (9.7)
Pulp vitality test (y)
1 4 (12.9) 11 (12.4) 19 (25.3) 34 (17.4) 0.003
2∼4 8 (25.8) 17 (19.1) 25 (33.3) 50 (25.6)
≥5 10 (32.3) 16 (18.0) 15 (20.0) 41 (21.0)
Likely to perform in the future
9 (29.0) 45 (50.6) 16 (21.3) 70 (35.9)
Assistance for pulp treatment (y)
1 5 (16.1) 23 (25.8) 32 (42.7) 60 (30.8) 0.006
2∼4 8 (25.8) 25 (28.1) 24 (32.0) 57 (29.2)
≥5 13 (41.9) 25 (28.1) 17 (22.7) 55 (28.2)
Likely to perform in the future
5 (16.1) 16 (18.0) 2 (2.7) 23 (11.8)
Teeth whitening treatment (y)
1 2 (6.5) 3 (3.4) 13 (17.3) 18 (9.2) <0.001
2∼4 11 (35.5) 20 (22.5) 37 (49.3) 68 (34.9)
≥5 10 (32.3) 19 (21.3) 17 (22.7) 46 (23.6)
Likely to perform in the future
8 (25.8) 47 (52.8) 8 (10.7) 63 (32.3)
Assistance for primary tooth extraction (y)
1 6 (19.4) 24 (27.0) 34 (45.3) 64 (32.8) 0.022
2∼4 9 (29.0) 31 (34.8) 24 (32.0) 64 (32.8)
≥5 12 (38.7) 26 (29.2) 16 (21.3) 54 (27.7)
Likely to perform in the future
4 (12.9) 8 (9.0) 1 (1.3) 13 (6.7)
Assistance for prosthodontic treatment of primary teeth (y)
1 5 (16.1) 16 (18.0) 30 (40.0) 51 (26.2) <0.001
2∼4 10 (32.3) 16 (18.0) 25 (33.3) 51 (26.2)
≥5 12 (38.7) 20 (22.5) 16 (21.3) 48 (24.6)
Likely to perform in the future
4 (12.9) 37 (41.6) 4 (5.3) 45 (23.1) shown in Table 1.
Among a total of 195 participants, females accounted for the significant majority with 96.9% and males
accounted for 3.1%. With respect to graduation year, 2016∼
2018 was the most common response (36.9%), followed in
order by 2010∼2015 (26.7%), before 2005 (13.8%), after
Table 2. Continued
Division University
hospital level
Dental
hospital level Dental clinics Total p-value Duties
performed in conservation dentistry/pedia tric dentistry
Preparation for dental fenestration (y)
1 5 (16.1) 9 (10.1) 26 (34.7) 40 (20.5) <0.001
2∼4 9 (29.0) 16 (18.0) 16 (21.3) 41 (21.0)
≥5 12 (38.7) 16 (18.0) 11 (14.7) 39 (20.0)
Likely to perform in the future
5 (16.1) 48 (53.9) 22 (29.3) 75 (38.5)
Preventive orthodontic treatment training (y)
1 5 (16.1) 12 (13.5) 19 (25.3) 36 (18.5) <0.001
2∼4 8 (25.8) 17 (19.1) 31 (41.3) 56 (28.7)
≥5 15 (48.4) 20 (22.5) 14 (18.7) 49 (25.1)
Likely to perform in the future
3 (9.7) 40 (44.9) 11 (14.7) 54 (27.7)
Assistance for behavior management of pediatric patients (y)
1 6 (19.4) 13 (14.6) 22 (29.3) 41 (21.0) <0.001
2∼4 8 (25.8) 26 (29.2) 30 (40.0) 64 (32.8)
≥5 13 (41.9) 19 (21.3) 16 (21.3) 48 (24.6)
Likely to perform in the future
4 (12.9) 31 (34.8) 7 (9.3) 42 (21.5)
Total 31 (15.9) 89 (45.6) 75 (38.5) 195 (100.0)
Values are presented as number (%).
2019 (13.8%), and 2005∼2009 (8.7%). With respect to clinical experience, ≥5 years was the most common response (46.2%), followed in order by 2∼4 years (37.9%) and first year (15.9%). With respect to workplace, dental hospital was the most common response (45.6%), followed in order by dental clinic (38.5%) and university hospital (15.9%). With respect to work department, orthodontics was the most common response (15.9%), followed in order by prosthodontics (15.4%), periodontics (8.7%), oral surgery (8.7%), conservation dentistry (7.2%), dental implants (5.6%), and pediatric dentistry (5.1%). In addition, 16.4% of the responses indicated no division of departments.
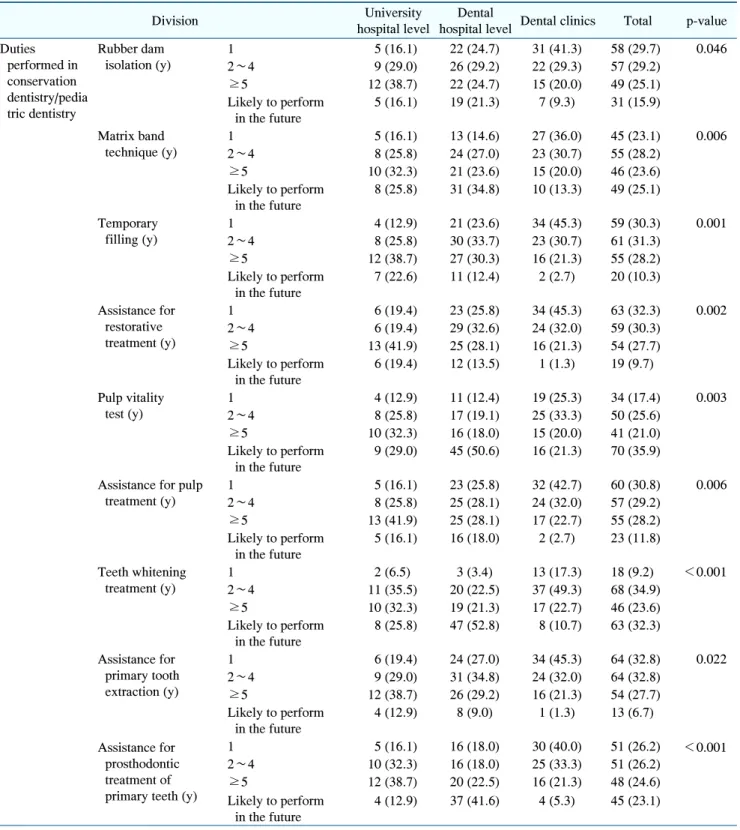
2. Duties performed in conservation dentistry and pediatric dentistry
Table 2 shows the results of duties performed by dental hygienists in conservation dentistry and pediatric dentistry.
Rubber dam isolation was performed most often by those with work experience of 1 year (29.7%), followed in order by 2∼4 years (29.2%), ≥5 years (25.1%), and likely to perform in the future (15.9%). With respect to workplace, there were significant differences in who most often performed rubber dam isolation among different workplaces with ≥5 years, 2∼4 years, and 1 year being
the most common response for university hospitals, dental hospitals, and dental clinics, respectively (p<0.05).
Matrix band technique was performed most often by those with work experience of 2∼4 years (28.2%), followed in order by likely to perform in the future (25.1%), ≥5 years (23.6%), and 1 year (23.1%). With respect to workplace, there were significant differences in who most often performed matrix band technique among different workplaces with ≥5 years, likely to perform in the future, and 1 year being the most common response for university hospitals, dental hospitals, and dental clinics, respectively (p<0.01).
Temporary fillings were performed most often by those with work experience of 2∼4 years (31.3%), followed in order by 1 year (30.3%), ≥5 years (28.2%), and likely to perform in the future (10.3%). With respect to workplace, there were significant differences in who most often performed temporary fillings among different workplaces with ≥5 years, 2∼4 years, and 1 year being the most common response for university hospitals, dental hospitals, and dental clinics, respectively (p<0.01).
Assistance for restorative treatment was performed
most often by those with work experience of 1 year
(32.3%), followed in order by 2∼4 years (30.3%), ≥5
years (27.7%), and likely to perform in the future (9.7%).
With respect to understanding radiography equipment, there were significant differences among different workplaces with ≥5 years, 2∼4 years, and 1 year being the most common response for university hospitals, dental hospitals, and dental clinics, respectively (p<0.01).
With respect to pulp vitality test, the most common response was likely to perform in the future (35.9%), followed in order by 2∼4 years (25.6%), ≥5 years (21.0%), and 1 year (17.4%). With respect to workplace, there were significant differences in who most often performed pulp vitality tests among different workplaces with ≥5 years, likely to perform in the future, and 2∼4 years being the most common response for university hospitals, dental hospitals, and dental clinics, respectively (p<0.01).
Assistance for pulp treatment was performed most often by those with work experience of 1 year (30.8%), followed in order by 2∼4 years (29.2%), ≥5 years (28.2%), and likely to perform in the future (11.8%). With respect to workplace, there were significant differences in who most often performed assistance for pulp treatment among different workplaces with ≥5 years, 2∼4 and ≥5 years, and 1 year being the most common response for university hospitals, dental hospitals, and dental clinics, respectively (p<0.01).
Teeth whitening treatment was performed most often by those with work experience of 2∼4 years (34.9%), followed in order by likely to perform in the future (32.3%), ≥5 years (23.6%), and 1 year (9.2%). With respect to workplace, there were significant differences in who most often performed assistance for teeth whitening treatment among different workplaces with 2∼4 years, likely to perform in the future, and 2∼4 years being the most common response for university hospitals, dental hospitals, and dental clinics, respectively (p<0.001).
Assistance for primary tooth extraction was performed most often by those with work experience of 1 year and 2∼4 years (32.8% each), followed in order by ≥5 years (27.7%) and likely to perform in the future (6.7%). With respect to workplace, there were significant differences in who most often performed assistance for primary tooth extraction among different workplaces with ≥5 years, 2∼4 years, and 1 year being the most common response
for university hospitals, dental hospitals, and dental clinics, respectively (p<0.05).
Assistance for prosthodontic treatment of primary teeth was performed most often by those with work experience of 1 year and 2∼4 years (26.2% each), followed in order by ≥5 years (24.6%) and likely to perform in the future (23.1%). With respect to workplace, there were significant differences in who most often performed assistance for prosthodontic treatment of primary teeth among different workplaces with ≥5 years, likely to perform in the future, and 1 year being the most common response for university hospitals, dental hospitals, and dental clinics, respectively (p<0.001).
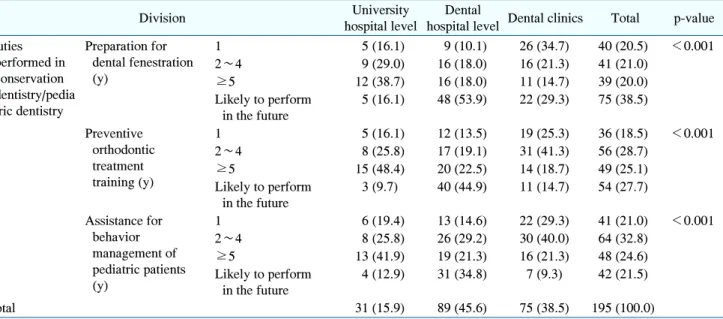
For preparation for dental fenestration, the most common response was likely to perform in the future (38.5%), followed in order by 2∼4 years (21.0%), 1 year (20.5%), and ≥5 years (20.0%). With respect to workplace, there were significant differences in who most often performed dental fenestration among different workplaces with ≥5 years, likely to perform in the future, and 1 year being the most common response for university hospitals, dental hospitals, and dental clinics, respectively (p<0.001).
For preventive orthodontic treatment training, the most common response was 2∼4 years (28.7%), followed in order by likely to perform in the future (27.7%), ≥5 years (25.1%), and 1 year (18.5%). With respect to workplace, there were significant differences in preventive orthodontic treatment training among different workplaces with ≥5 years, likely to perform in the future, and 2∼4 years being the most common response for university hospitals, dental hospitals, and dental clinics, respectively (p<0.001).
Assistance for behavior management of pediatric patients
was performed most often by those with work experience
of 2∼4 years (32.8%), followed in order by ≥5 years
(24.6%), likely to perform in the future (21.5%), and 1
year 21.0%. With respect to workplace, there were
significant differences in who most often performed
assistance for behavior management of pediatric patients
among different workplaces with ≥5 years, likely to
perform in the future, and 2∼4 years being the most
common response for university hospitals, dental
hospitals, and dental clinics, respectively (p<0.001).
Table 3. Duties Performed in Prosthodontics
Division University
hospital level
Dental hospital level
Dental
clinics Total p-value Duties performed
in prosthodontics
Gingival retraction (y)
1 6 (19.4) 15 (16.9) 24 (32.0) 45 (23.1) 0.127
2∼4 8 (25.8) 34 (38.2) 29 (38.7) 71 (36.4)
≥5 12 (38.7) 26 (29.2) 15 (20.0) 53 (27.2)
Likely to perform in the future
5 (16.1) 14 (15.7) 7 (9.3) 26 (13.3)
Fabrication of temporary crowns (y)
1 6 (19.4) 9 (10.1) 26 (34.7) 41 (21.0) <0.001
2∼4 8 (25.8) 34 (38.2) 31 (41.3) 73 (37.4)
≥5 11 (35.5) 26 (29.2) 16 (21.3) 53 (27.2)
Likely to perform in the future
6 (19.4) 20 (22.5) 2 (2.7) 28 (14.4)
Assistance for fixed prosthodontic treatment (y)
1 9 (29.0) 15 (16.9) 35 (46.7) 59 (30.3) <0.001
2∼4 5 (16.1) 29 (32.6) 23 (30.7) 57 (29.2)
≥5 12 (38.7) 25 (28.1) 15 (20.0) 52 (26.7)
Likely to perform in the future
5 (16.1) 20 (22.5) 2 (2.7) 27 (13.8)
Assistance for removable prosthodontic treatment (y)
1 9 (29.0) 15 (16.9) 34 (45.3) 58 (29.7) <0.001
2∼4 5 (16.1) 22 (24.7) 24 (32.0) 51 (26.2)
≥5 12 (38.7) 25 (28.1) 15 (20.0) 52 (26.7)
Likely to perform in the future
5 (16.1) 27 (30.3) 2 (2.7) 34 (17.4)
Fabrication of individual trays (y)
1 4 (12.9) 3 (3.4) 13 (17.3) 20 (10.3) <0.001
2∼4 7 (22.6) 16 (18.0) 30 (40.0) 53 (27.2)
≥5 9 (29.0) 17 (19.1) 15 (20.0) 41 (21.0)
Likely to perform in the future
11 (35.5) 53 (59.6) 17 (22.7) 81 (41.5)
Dental shade selection (y)
1 5 (16.1) 13 (14.6) 23 (30.7) 41 (21.0) <0.001
2∼4 6 (19.4) 30 (33.7) 34 (45.3) 70 (35.9)
≥5 10 (32.3) 25 (28.1) 16 (21.3) 51 (26.2)
Likely to perform in the future
10 (32.3) 21 (23.6) 2 (2.7) 33 (16.9)
Application/removal of prosthesis (y)
1 7 (22.6) 17 (19.1) 25 (33.3) 49 (25.1) 0.022
2∼4 7 (22.6) 31 (34.8) 31 (41.3) 69 (35.4)
≥5 9 (29.0) 26 (29.2) 15 (20.0) 50 (25.6)
Likely to perform in the future
8 (25.8) 15 (16.9) 4 (5.3) 27 (13.8)
Management of individual prosthesis (y)
1 7 (22.6) 10 (11.2) 22 (29.3) 39 (20.0) 0.001
2∼4 7 (22.6) 31 (34.8) 33 (44.0) 71 (36.4)
≥5 12 (38.7) 24 (27.0) 15 (20.0) 51 (26.2)
Likely to perform in the future
5 (16.1) 24 (27.0) 5 (6.7) 34 (17.4)
Total 31 (15.9) 89 (45.6) 75 (38.5) 195 (100.0)
Values are presented as number (%).
3. Duties performed in prosthodontics
Table 3 shows the results of duties performed by dental hygienists in prosthodontics. Gingival retraction was performed most often by those with work experience of 2∼4 years (36.4%), followed in order by ≥5 years
(27.2%), 1 year (23.1%), and likely to perform in the
future (13.3%). With respect to workplace, ≥5 years was
the most common response for university hospitals and
2∼4 years was the most common response for dental
hospitals and dental clinics, but the differences were not
significant.
Fabrication of temporary crowns was performed most often by those with work experience of 2∼4 years (37.4%), followed in order by ≥5 years (27.2%), 1 year (21.0%), and likely to perform in the future (14.4%). With respect to workplace, there were significant differences in who most often performed fabrication of temporary crowns among different workplaces with ≥5 years being the most common response for university hospitals and 2∼4 years being the most common response for dental hospitals and dental clinics (p<0.001).
Assistance for fixed prosthodontic treatment was performed most often by those with work experience of 1 year (30.3%), followed in order by 2∼4 years (29.2%),
≥5 years (26.7%), and likely to perform in the future (13.8%). With respect to workplace, there were significant differences in who most often performed assistance for fixed prosthodontic treatment among different workplaces with ≥5 years, 2∼4 years, and 1 year being the most common response for university hospitals, dental hospitals, and dental clinics, respectively (p<0.001).
Assistance for removable prosthodontic treatment was performed most often by those with work experience of 1 year (29.7%), followed in order by ≥5 years (26.7%), 2∼
4 years (26.2%), and likely to perform in the future (17.4%). With respect to workplace, there were significant differences in who most often performed assistance for removal prosthodontic treatment among different workplaces with ≥5 years, likely to perform in the future, and 1 year being the most common response for university hospitals, dental hospitals, and dental clinics, respectively (p<0.001).
For fabrication of individual trays, the most common response was likely to perform in the future (41.5%), followed in order by 2∼4 years (27.2%), ≥5 years (21.0%), and 1 year (10.3%). With respect to workplace, there were significant differences in who most often performed fabrication of individual trays among different workplaces with likely to perform in the future being the most common response for university hospitals and dental hospitals and 2∼4 years being the most common response for dental clinics (p<0.001).
Dental shade selection was performed most often by those with work experience of 2∼4 years (35.9%),
followed in order by ≥5 years (26.2%), 1 year (21.0%), and likely to perform in the future (16.9%). With respect to workplace, there were significant differences in who most often performed dental shade selection among different workplaces with ≥5 years and likely to perform in the future being the most common responses for university hospitals and 2∼4 years being the most common response for dental hospitals and dental clinics (p<
0.001).
Application/removal of prosthesis and management of individual prosthesis were performed most often by those with work experience of 2∼4 years (35.4% and 36.4%, respectively), followed in order by ≥5 years (25.6% and 26.2%, respectively), 1 year (25.1% and 20.0%, respect- ively), and likely to perform in the future (13.8% and 17.4%, respectively). With respect to workplace, there were significant differences in who most often performed application/removal of prosthesis and management of individual prosthesis among different workplaces with ≥ 5 years and likely to perform in the future being the most common responses for university hospitals and 2∼4 years being the most common response for dental hospitals and dental clinics (p<0.01).
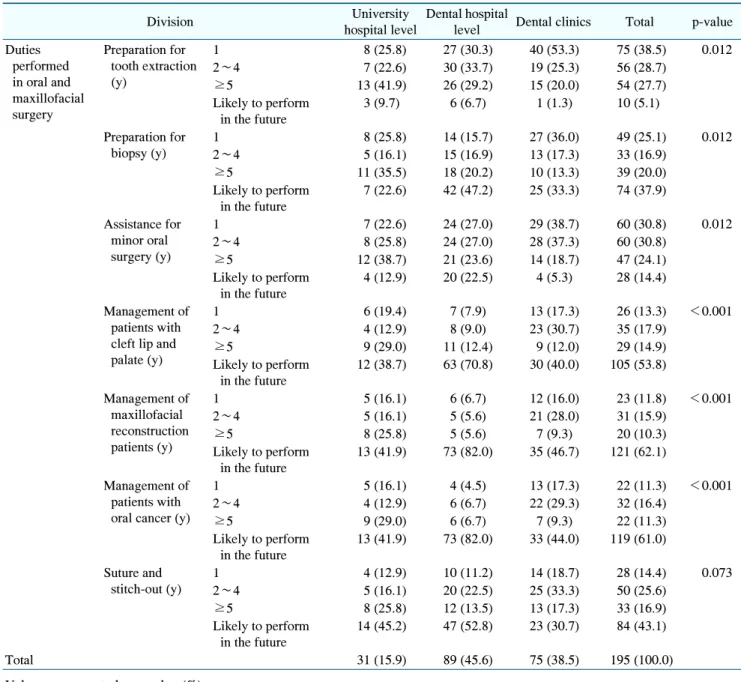
4. Duties performed in oral and maxillofacial surgery
Table 4 shows the results of duties performed by dental hygienists in oral and maxillofacial surgery.
Preparation for tooth extraction was performed most often by those with work experience of 1 year (38.5%), followed in order by 2∼4 years (28.7%), ≥5 years (27.7%), and likely to perform in the future (5.1%). With respect to workplace, there were significant differences in who most often performed preparation for tooth extraction among different workplaces with ≥5 years, 2∼4 years, and 1 year being the most common response for university hospitals, dental hospitals, and dental clinics, respectively (p<0.05).
For preparation for biopsy, the most common response
was likely to perform in the future (37.9%), followed in
order by 1 year (25.1%), ≥5 years (20.0%), and 2∼4
years (16.9%). With respect to workplace, there were
significant differences in who most often performed
Table 4. Duties Performed in Oral and Maxillofacial Surgery
Division University
hospital level
Dental hospital
level Dental clinics Total p-value Duties
performed in oral and maxillofacial surgery
Preparation for tooth extraction (y)
1 8 (25.8) 27 (30.3) 40 (53.3) 75 (38.5) 0.012
2∼4 7 (22.6) 30 (33.7) 19 (25.3) 56 (28.7)
≥5 13 (41.9) 26 (29.2) 15 (20.0) 54 (27.7)
Likely to perform in the future
3 (9.7) 6 (6.7) 1 (1.3) 10 (5.1)
Preparation for biopsy (y)
1 8 (25.8) 14 (15.7) 27 (36.0) 49 (25.1) 0.012
2∼4 5 (16.1) 15 (16.9) 13 (17.3) 33 (16.9)
≥5 11 (35.5) 18 (20.2) 10 (13.3) 39 (20.0)
Likely to perform in the future
7 (22.6) 42 (47.2) 25 (33.3) 74 (37.9)
Assistance for minor oral surgery (y)
1 7 (22.6) 24 (27.0) 29 (38.7) 60 (30.8) 0.012
2∼4 8 (25.8) 24 (27.0) 28 (37.3) 60 (30.8)
≥5 12 (38.7) 21 (23.6) 14 (18.7) 47 (24.1)
Likely to perform in the future
4 (12.9) 20 (22.5) 4 (5.3) 28 (14.4)
Management of patients with cleft lip and palate (y)
1 6 (19.4) 7 (7.9) 13 (17.3) 26 (13.3) <0.001
2∼4 4 (12.9) 8 (9.0) 23 (30.7) 35 (17.9)
≥5 9 (29.0) 11 (12.4) 9 (12.0) 29 (14.9)
Likely to perform in the future
12 (38.7) 63 (70.8) 30 (40.0) 105 (53.8)
Management of maxillofacial reconstruction patients (y)
1 5 (16.1) 6 (6.7) 12 (16.0) 23 (11.8) <0.001
2∼4 5 (16.1) 5 (5.6) 21 (28.0) 31 (15.9)
≥5 8 (25.8) 5 (5.6) 7 (9.3) 20 (10.3)
Likely to perform in the future
13 (41.9) 73 (82.0) 35 (46.7) 121 (62.1)
Management of patients with oral cancer (y)
1 5 (16.1) 4 (4.5) 13 (17.3) 22 (11.3) <0.001
2∼4 4 (12.9) 6 (6.7) 22 (29.3) 32 (16.4)
≥5 9 (29.0) 6 (6.7) 7 (9.3) 22 (11.3)
Likely to perform in the future
13 (41.9) 73 (82.0) 33 (44.0) 119 (61.0)
Suture and stitch-out (y)
1 4 (12.9) 10 (11.2) 14 (18.7) 28 (14.4) 0.073
2∼4 5 (16.1) 20 (22.5) 25 (33.3) 50 (25.6)
≥5 8 (25.8) 12 (13.5) 13 (17.3) 33 (16.9)
Likely to perform in the future
14 (45.2) 47 (52.8) 23 (30.7) 84 (43.1)
Total 31 (15.9) 89 (45.6) 75 (38.5) 195 (100.0)
Values are presented as number (%).
preparation for biopsy among different workplaces with
≥5 years, likely to perform in the future, and 1 year being the most common response for university hospitals, dental hospitals, and dental clinics, respectively (p<0.05).
Assistance for minor oral surgery was performed most often by those with work experience of 1 year and 2∼4 years (30.8% each), followed in order by ≥5 years (24.1%) and likely to perform in the future (14.4%). With respect to workplace, there were significant differences in
who most often performed assistance for minor oral surgery among different workplaces with ≥5 years; 1 year and 2∼4 years; and 1 year being the most common response for university hospitals, dental hospitals, and dental clinics, respectively (p<0.05).
For management of patients with cleft lip and palate, the
most common response was likely to perform in the future
(53.8%), followed in order by 2∼4 years (17.9%), ≥5
years (14.9%), and 1 year (13.3%). With respect to
Table 5. Duties Performed in Dental Implant Treatment