Received:September 22, 2016, Revised:January 15, 2017, Accepted:February 3, 2017
Corresponding to:Kichul Shin, Division of Rheumatology, Department of Internal Medicine, SMG-SNU Boramae Medical Center, 20 Boramae-ro 5-gil, Dongjak-gu, Seoul 07061, Korea. E-mail:[email protected]
pISSN: 2093-940X, eISSN: 2233-4718
Copyright ⓒ 2017 by The Korean College of Rheumatology. All rights reserved.
This is a Open Access article, which permits unrestricted non-commerical use, distribution, and reproduction in any medium, provided the original work is properly cited.
Nutrient Intake in Postmenopausal Rheumatoid Arthritis Women with Osteoporosis: Results from the Korean National Health and Nutrition Examination Survey
Yeon Soo Baik1, Jee Won Park1, Jihye Kim2, Won Gyoung Kim3, Sohee Oh4, Sung-il Cho5, Yeong Wook Song6, Kichul Shin2
1Department of Epidemiology, UCLA Fielding School of Public Health, University of California, Los Angeles, Los Angeles, CA, USA, 2Division of Rheumatology, Department of Internal Medicine, SMG-SNU Boramae Medical Center, Departments of 3Nutrition Service and 4Biostatistics, SMG-SNU Boramae Medical Center, 5Graduate School of Public Health, Seoul National University, 6Division of Rheumatology, Department of Internal Medicine, Seoul National University Hospital, Seoul, Korea
Objective. Osteoporosis (OP) is one of the principal comorbidities in women with rheumatoid arthritis (RA). Proper nutrition for these patients is required not only to improve bone health but to better manage their chronic illness. Thus, our aim was to assess the status of key nutrient intake in postmenopausal RA women with OP. Methods. Using cross-sectional data of 4,933 postmenopausal women in the Korean National Health and Nutrition Examination Survey (K-NHANES IV, V) conducted be- tween 2008 and 2011, we investigated the daily nutrient intake in RA subjects and their bone mineral density (BMD). We exam- ined the association of nutrient intake and BMD after adjusting age, level of education, body mass index, family history, alcohol use, and total calorie intake in the osteoporosis, osteopenia, and normal BMD group using multivariable linear regression.
Results. We included 222 RA women and 320 controls whose BMD and T-score data were available. Low calcium and phos- phorous intake were associated with reduced BMD T-scores in postmenopausal RA women. Additionally, β-carotene, potas- sium, riboflavin, and vitamin C intake were significantly lower in RA women with OP. Multivariable linear regression analysis showed a strong positive association of intake of β-carotene, potassium, riboflavin, and calcium with higher T-scores at the lumbar spine, femur neck, and total hip (all p<0.0001, respectively). Conclusion. We found insufficient intake of nutrients such as β-carotene, potassium, riboflavin, and vitamin C in Korean postmenopausal RA women with low BMD. Dietary counseling and recommendations are warranted for these subjects to attain better bone health. (J Rheum Dis 2017;24:35-42)
Key Words. Bone density, Nutrition surveys, Osteoporosis, Rheumatoid arthritis
INTRODUCTION
Rheumatoid arthritis (RA) is a systemic inflammatory condition that encompasses numerous comorbidities throughout its disease course [1]. Osteoporosis (OP) is a well-known comorbidity in RA, also an independent risk factor for OP. Osteoporotic fracture is a troublesome yet potentially avertable complication in RA patients. Well-ba- lanced nutrition itself can be very helpful, however it is usually overlooked either in clinical practice or inves-
tigations. One study in Japan showed that information of dietary supplements or health foods is only obtained in a small portion (1.7%) of RA patients from health pro- fessionals [2]. Moreover, the relationship between nutri- tional status and progression of RA remains poorly un- derstood [3]. Nutritional impact on bone mineral density (BMD) or on RA have been published separately [4-8], yet the nutritional status of RA patients with OP has not been largely investigated.
The Korean National Health and Nutrition Examination
Figure 1. Scheme of the study subject selection process. K- NHANES: Korean National Heal- th and Nutrition Examination Survey, DXA: dual energy X-ray absorptiometry, RA: rheuma- toid arthritis, OA: osteoarthritis, BMD: bone mineral density.
Survey, or K-NHANES, has provided systematically ob- tained, valuable data on several aspects such as diet, co- morbidities, and basic laboratory values in populations from sampled regions in South Korea [9]. A study analyz- ing the baseline characteristics of the population with ar- thritis in K-NHANES showed that the annual self-re- ported prevalence of arthritis was 146.4 per 1,000 in 2005 [10]. Fifty-eight percent of the over 65 year-old population had at least one musculoskeletal disease (higher in wom- en, 73%). However, diet or nutrient intake in these sub- jects was not fully analyzed. Other population-based sur- veys also have not clearly depicted the nutrition status in RA patients.
Assessment of inadequate nutritional status can be based on intake of nutrients [11], but also by measuring anthropometric parameters such as height, mid-up- per-arm or waist circumference [12,13]. Our objective was to investigate anthropometric variables and dietary traits specifically in postmenopausal RA women, and study the association between nutrient intake or nutri- tional status and the low BMD in RA patients utilizing the K-NHANES (IV, V) data.
MATERIALS AND METHODS
Patients
In this cross-sectional study, our source population was 31,303 of K-NHANES participants between July 2008 and
May 2011 when dual energy X-ray absorptiometry (DXA) was tested. After excluding the subjects whose DXA data were unavailable, the number of survey participants dur- ing this period totaled 21,303; 3,583 in the year 2008, 7,920 in 2009, 7,043 in 2010, and 2,757 in 2011. The study population was postmenopausal RA women. We first could select women who answered ‘yes’ to a question on whether they were in menopause. Then RA subjects were selected using the question “have you ever been di- agnosed with RA by a medical doctor?”. To reduce the number of confounders that might influence our study, we excluded subjects diagnosed with osteoarthritis (OA) by using the question “have you ever been diagnosed with arthritis including RA or OA by a medical doctor?”. Of the 598 women who answered the above questions, 259 women had RA and 339 women had neither RA nor OA (non-arthritis controls). From both groups, we excluded those who had invalid DXA measurements, such as either lacking a T-score of the lumbar spine or having only T-score of a single region. The number of final study sub- jects of 222 RA were analyzed in this study (Figure 1).
We defined a OP case as a subject whose T-score was equal to −2.5 or less, using the OP definition from the World Health Organization (WHO) T-score criteria. We set two comparators; a group whose T-score was either above −2.5 but equal to or less than −1.0, and a group with T-score above −1.0, according to the WHO criteria for osteopenia (ON) and normal (NL), respectively.
Measurement of demographic and anthropometric characteristics
We categorized demographic variables as follows:
monthly income (1st, 2nd, and 3rd tertile), education lev- el (primary or lower, middle school, high school, and col- lege or higher), marital status (married and single), fam- ily history of OP (yes and no), and residential area (urban and rural, depending on whether the population of the province was equal to or greater than versus less than one million). Age and age of menopause were used as con- tinuous variables. As for risk factors, we calculated the fraction of high-risk alcohol users and that of current smokers who have smoked over 100 cigarettes for life: a high-risk alcohol user was defined as a drinker whose average volume of alcohol consumption exceeds 280 mL or whose pattern of drinking is more than twice a week.
Four of anthropometric variables; body mass index (BMI), waist circumference, whole body fat mass, and whole body total lean mass, were also used as numerical variables.
Measurement of daily nutrient intake
Daily nutrient intake was estimated using a 24-hour di- etary recall method. The nutrients used in the study were protein, fat, carbohydrate, calcium, phosphorous, so- dium, potassium, iron, vitamin A, thiamin, riboflavin, niacin, vitamin C, β-carotene, and retinol. Total calorie intake was also calculated from these nutrients.
Statistical analysis
We used the survey sample weights in the analyses, ac- counting for the stratified, multistage, probability sam- pling design of K-NHANES. The study population charac- teristics were analyzed using the following descriptive statistics: mean±standard error for continuous variables and frequencies as well as proportions for categorized variables. Differences in demographic and clinical charac- teristics were tested via chi-square tests, and analysis of variance plus multiple comparison with the Bonferroni method. A p-value less than 0.017 was considered sig- nificant because the suggested p-values in the table were raw p-values before applying Bonferroni correction. Prior to analysis, daily nutrition intakes were transformed into logarithmic scales. The comparison of the amount of daily nutrition intake among the three groups (NL, ON, and OP) and the relationship between T-score and daily nu- trition intake were analyzed by multivariate linear re- gression analyses after covariate adjustments such as age,
income level, BMI, family history of osteoporosis, total calorie intake, and alcohol use [14]. Age and BMD were assessed for non-linear effects by testing the significance of square terms. A p-value less than 0.05 was considered significant. All analyses were conducted with SAS version 9.3 (SAS Institute, Cary, NC, USA).
RESULTS
Demographic and anthropometric data of RA pop- ulation with low BMD
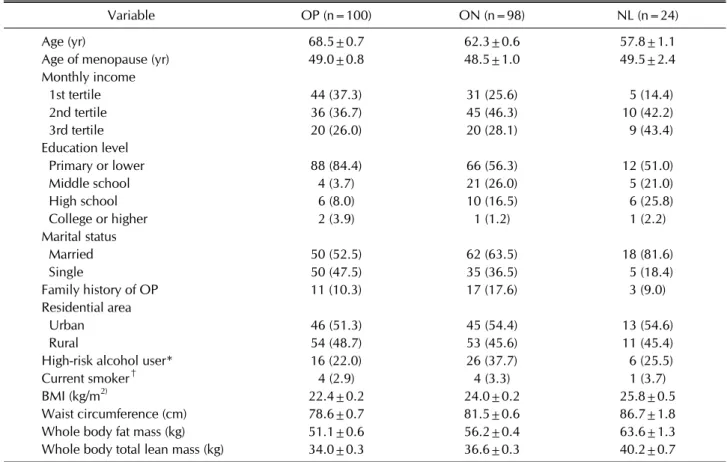
The general characteristics and anthropometric varia- bles of the RA participants are described in Table 1 (non-arthritis subjects in Supplementary Table 1). As ex- pected, age was significantly higher in the OP group than in both the ON and NL groups (68.5, 62.3, and 57.8, re- spectively; p<0.0001) [15]. Educational level also dif- fered among the three groups. No other statistical differ- ences were noted in age of menopause, monthly income level, marital status, proportion of high-risk alcohol users, proportion of current smokers, and family history of osteoporosis.
As for an indicator of nutritional status, BMI, whole body fat mass and whole body total lean mass were sig- nificantly lower in the osteoporotic group, even though the daily energy intake were similar (i.e., 1,570, 1,578, and 1,513 kcal/d for the OP, ON, NL group, respectively) (Tables 1 and 2).
Comparison of daily nutrient intake in RA with or without OP
Daily nutrient intake did not differ in multivariate linear regression results between the RA population (n=222) and those without arthritis (n=339) (Supplementary Table 2). This result aligned with the previous study in Japan [3]. However, this was not the case with the results within the RA subgroups (OP, ON, NL) (Table 2). Except for protein, fat, and carbohydrate, intake of all nutrients was lower in the OP group, though some were statistically not significant. The results of the multivariate linear re- gression adjusted for age, BMI, education level, family history, and alcohol use showed that potassium, ribo- flavin, vitamin C, and β-carotene intake were sig- nificantly different between the groups (p<0.017). The pairwise test results indicated that potassium and ribo- flavin intake in RA with OP were different from those in the other two groups whereas vitamin C and β-carotene intakes in the group were only different between the OP
Table 1. Demographics and characteristics of postmenopausal women with rheumatoid arthritis divided into 3 groups
Variable OP (n=100) ON (n=98) NL (n=24)
Age (yr) 68.5±0.7 62.3±0.6 57.8±1.1
Age of menopause (yr) 49.0±0.8 48.5±1.0 49.5±2.4
Monthly income
1st tertile 44 (37.3) 31 (25.6) 5 (14.4)
2nd tertile 36 (36.7) 45 (46.3) 10 (42.2)
3rd tertile 20 (26.0) 20 (28.1) 9 (43.4)
Education level
Primary or lower 88 (84.4) 66 (56.3) 12 (51.0)
Middle school 4 (3.7) 21 (26.0) 5 (21.0)
High school 6 (8.0) 10 (16.5) 6 (25.8)
College or higher 2 (3.9) 1 (1.2) 1 (2.2)
Marital status
Married 50 (52.5) 62 (63.5) 18 (81.6)
Single 50 (47.5) 35 (36.5) 5 (18.4)
Family history of OP 11 (10.3) 17 (17.6) 3 (9.0)
Residential area
Urban 46 (51.3) 45 (54.4) 13 (54.6)
Rural 54 (48.7) 53 (45.6) 11 (45.4)
High-risk alcohol user* 16 (22.0) 26 (37.7) 6 (25.5)
Current smoker† 4 (2.9) 4 (3.3) 1 (3.7)
BMI (kg/m2) 22.4±0.2 24.0±0.2 25.8±0.5
Waist circumference (cm) 78.6±0.7 81.5±0.6 86.7±1.8
Whole body fat mass (kg) 51.1±0.6 56.2±0.4 63.6±1.3
Whole body total lean mass (kg) 34.0±0.3 36.6±0.3 40.2±0.7
Values are presented as mean±standard error or number (%). OP: osteoporosis, ON: osteopenia, NL: normal bone mineral density, BMI: body mass index. *The fraction of drinkers whose average volume of alcohol consumption exceeds 280 mL or whose pattern of drinking is more than twice a week. †The fraction of current smokers who have smoked over 100 cigarettes for life.
and ON group.
Measurement of vitamin D intake was excluded in K-NHANES, but 25-hydroxy-vitamin D (25(OH)D) se- rum concentration data was available: serum 25(OH)D level was comparable between RA and non-arthritis sub- jects, but it was lower in the OP subjects compared with NL in RA (mean value 16.34 versus 18.74 ng/mL, re- spectively).
Relationship between nutrient intake and BMD T-scores
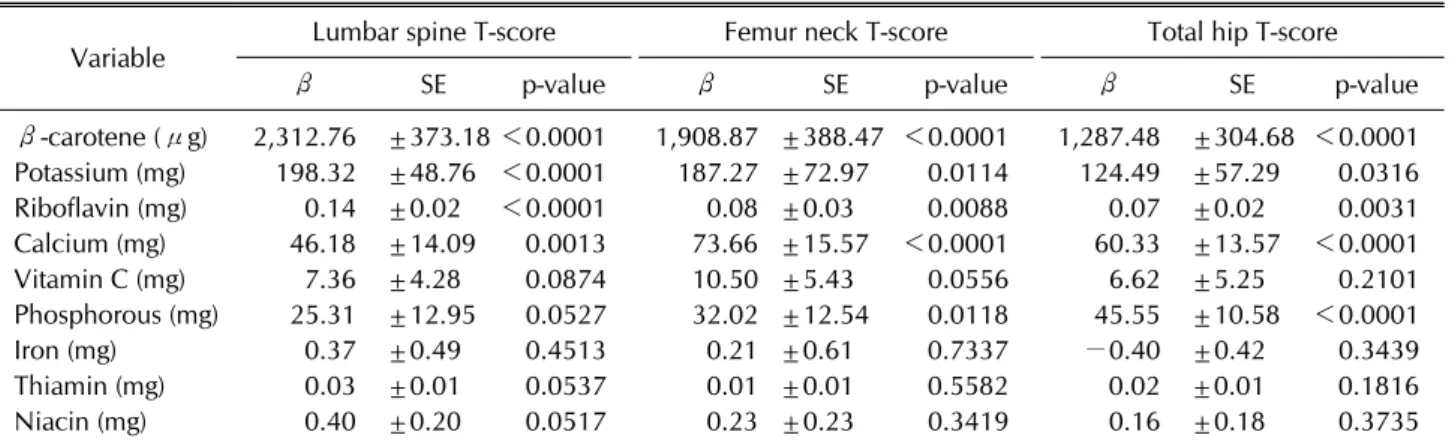
After identifying the differences in nutrient intake be- tween RA subjects with or without OP, further analysis was performed in terms of nutrient intake according to BMD T-scores in general. The multivariable linear re- gression model included each nutrient intake as a de- pendent variable, T-scores as an independent variable, and age, education, BMI, and family history as potential confounding variables. T-score values were site-specific and so were their results in multivariable linear re-
gression analysis (Table 3). Greater intake of β-carotene, potassium, riboflavin, and calcium were notably asso- ciated with higher T-scores at all 3 sites - lumbar spine, fe- mur neck, and total hip (p<0.0001). Vitamin C and phos- phorous intake correlated with higher T-scores at femur neck and total hip. Thiamine intake were strongly asso- ciated with lumbar spine T-scores (β=0.03, p=0.005), whereas iron and niacin were associated with T-scores at femur neck (iron: β=1.3, p=0.045; niacin: β=0.5, p=0.033).
DISCUSSION
The key finding of this study was that there was an asso- ciation between BMD T-scores and potassium, riboflavin, vitamin C, and β-carotene daily intake. Under the poten- tial assumption that nutritional status can be assessed by daily nutrient intake [11], we are able to state that BMD in postmenopausal Korean RA women is in part affected by their nutritional status. As shown in our data, anthro-
Table 2. Comparison of daily nutrient intake among the 3 groups in postmenopausal women with rheumatoid arthritis*
Variable OP (n=100) ON (n=98) NL (n=24)
p-value Overall group
comparison OP vs.ON OP vs. NL ON vs. NL Total calorie (kcal) 1,471.89±1.06 1,475.87±1.04 1,423.96±1.07 NS NS NS NS
Protein (g) 47.04±1.09 46.63±1.08 48.25±1.10 NS NS NS NS
Fat (g) 17.72±1.11 18.17±1.10 18.74±1.13 NS NS NS NS
Carbohydrate (g) 269.67±1.08 265.68±1.07 258.48±1.08 NS NS NS NS
Calcium (mg) 319.00±1.12 361.91±1.12 390.68±1.16 NS NS NS NS
Phosphorous (mg) 837.57±1.08 845.73±1.07 899.73±1.08 NS NS NS NS
Sodium (mg) 2,816.64±1.13 2,977.09±1.10 3,145.41±1.14 NS NS NS NS
Potassium (mg) 2,064.62±1.08 2,330.64±1.07 2,552.17±1.09 0.0124 0.0231 (NS) 0.0051 0.1691 (NS)
Iron (mg) 10.59±1.12 11.54±1.11 11.35±1.16 NS NS NS NS
Vitamin A (μg) 346.82±1.18 462.94±1.19 560.88±.44 NS 0.0410 (NS) NS NS
Thiamin (mg) 0.84±1.06 0.85±1.06 0.91±1.05 NS NS NS NS
Riboflavin (mg) 0.66±1.07 0.80±1.07 0.86±1.10 0.0048 0.0027 0.0061 NS
Niacin (mg) 10.79±1.08 11.16±1.08 11.37±1.10 NS NS NS NS
Vitamin C (mg) 65.75±1.12 83.74±1.14 83.63±1.18 0.0216 0.0081 NS NS β-carotene (μg) 1,718.49±1.20 2,572.16±1.19 3,002.80±1.36 0.0176 (NS) 0.0071 0.0418 NS
Retinol (μg) 14.82±1.26 15.85±1.32 19.42±1.44 NS NS NS NS
Values are least square mean±standard error. OP: osteoporosis, ON: osteopenia, NL: normal bone mineral density, NS:
non-significant. *Multivariate linear regression was performed after adjusting for age, education, body mass index, family history, and alcohol use. Additionally, all nutrients other than total calorie intake were adjusted for total calorie intake.
Table 3. Multivariate linear regression analysis of the relationship between nutrient intake and bone mineral density T-scores (n=222)*
Variable Lumbar spine T-score Femur neck T-score Total hip T-score
β SE p-value β SE p-value β SE p-value
β-carotene (μg) 2,312.76 ±373.18 <0.0001 1,908.87 ±388.47 <0.0001 1,287.48 ±304.68 <0.0001 Potassium (mg) 198.32 ±48.76 <0.0001 187.27 ±72.97 0.0114 124.49 ±57.29 0.0316
Riboflavin (mg) 0.14 ±0.02 <0.0001 0.08 ±0.03 0.0088 0.07 ±0.02 0.0031
Calcium (mg) 46.18 ±14.09 0.0013 73.66 ±15.57 <0.0001 60.33 ±13.57 <0.0001
Vitamin C (mg) 7.36 ±4.28 0.0874 10.50 ±5.43 0.0556 6.62 ±5.25 0.2101
Phosphorous (mg) 25.31 ±12.95 0.0527 32.02 ±12.54 0.0118 45.55 ±10.58 <0.0001
Iron (mg) 0.37 ±0.49 0.4513 0.21 ±0.61 0.7337 −0.40 ±0.42 0.3439
Thiamin (mg) 0.03 ±0.01 0.0537 0.01 ±0.01 0.5582 0.02 ±0.01 0.1816
Niacin (mg) 0.40 ±0.20 0.0517 0.23 ±0.23 0.3419 0.16 ±0.18 0.3735
SE: standard error. *Analysis was performed after adjusting for age, education, body mass index, family history, and alcohol use.
pometric variables (BMI, waist circumference, whole body fat mass, and whole body total lean mass) are largely low in osteoporotic females [3,13]. Therefore, our results demonstrate that both anthropometric measures and nu- trient intake are compromised in low BMD RA women compared with the normal population.
As the metabolic compromise in RA can contribute to increased comorbidity with OP [16], nutrition-related risk factors for OP that are currently under scientific eval- uation; intake of animal and plant proteins, vitamins,
prunes, plums, minerals, and phytochemicals [6,17,18].
Many studies show a positive association between the quantity of vegetables and fruit consumption and mark- ers of bone health [19]. Our results showing that dietary intake of β-carotene is low in postmenopausal RA sub- jects with OP aligns with the previous study in post- menopausal Korean OP women [20]. Park et al. [20] re- ported that carotene consumption was associated with reduced risk of OP after adjusting for age, BMI, hormone replacement therapy, and total caloric intake. Recent
studies have also confirmed that carotenoid or carotene plays an important role in preventing bone loss [20-22].
Carotene’s direct effect on bone health is largely derived from its antioxidant attributes [21]. Yang et al. [22] sug- gested that lycopene and β-carotene, the primary forms of carotene in our body or diet contribute to the pre- vention of osteoporosis. This is because antioxidants can donate electrons to free radicals, leading to the elimi- nation of oxidative stress [22,23]. In vitro studies [24] al- so revealed that lycopene hinders the formation of osteoclasts. One study argued that carotene acts only as a precursor of retinol, which actually benefits bone health [25]. In our study, retinol intake in the OP group was low- er than in the other two groups, yet not to the degree of statistical significance.
Potassium intake was strongly associated with the lum- bar spine BMD T-score in our study compared with other nutrients. There are several studies supporting this.
Tucker et al. [5] found that potassium, and vitamin C-rich fruits are associated with greater BMD in elderly women.
It is thought that fruits rich in potassium buffer the acid generated by dietary protein, thus helping to reduce bone mineral loss [5,26]. Potassium intake can also affect the absorption or utilization of carotene [24]; β-carotene in- take results adjusted for potassium consumption were not different from our primary analysis (data not shown).
Though we did not show the result of intake of vitamin D, it is a well-known important nutrient for bone health.
It was excluded in K-NHANES, but the 25(OH)D serum concentration data was available: mean 25(OH)D levels in all groups were below 30 ng/mL as seen in previous K-NHANES studies, which indicates that Korean post- menopausal women are largely deficient in 25(OH)D [27].
Recent studies regarding daily calorie or nutrient intake in RA are very limited. This may be due to the fact that di- etary factors associated with severity or treatment re- sponse are generally disregarded in clinical practice. This can be assumed from the previous study [2] that 70%∼
80% of RA patients were not willing to disclose their use of dietary supplements or health foods because of their physician’s negative feedback or no feedback at all. Our study showed that the nutrient intake of RA subjects in total did not differ from that of non-arthritic individuals in postmenopausal women. However, dietary change plays at least some therapeutic role according to the liter- ature [7]. It appears that the nutrients in fish, olive oil, and cooked vegetables confer a protective effect against
the development of RA, whereas red meat, dairy, and ce- reals are reported to worsen the symptoms of RA, al- though the evidence remains inconclusive [7,19]. In addi- tion, poor nutritional status in RA has been linked to higher incidence of complications after surgery [28]. The nutrition status of some RA patients is compromised re- gardless of adequate consumption. Specifically, rheuma- toid cachexia, a state of increased metabolism resulting in weight loss and reduced energy intake, requires further attention to proper protein intake to maintain energy bal- ance [7,16]. These studies indicated that RA is a chronic inflammatory condition that requires nutritional support and various comorbidities could occur during lifelong management of RA. Thus, well-balanced dietary recom- mendations are needed for these patients [8], for dietary supplements are frequently used as complementary or even as alternative measures among RA patients [29].
Due to this study’s cross-sectional nature the results in each group portray association, not a causal relationship, and the biologic implication of each nutrient was re- viewed after obtaining the results. In terms of the daily in- take values for each nutrient, some differed slightly from previous reports (unpublished material). Other limi- tations may include the definition of the study population mainly based on questionnaire (RA and non-arthritis), the presented number of the postmenopausal RA sub- jects with DXA results, lack of information regarding os- teoporotic fractures, and the estimation of nutrient intake using the 24 hour-recall survey. Nevertheless, daily in- take of nutrients in our study is largely comparable with previous studies [3]. In terms of prevalence of RA, that in K-NHANES was slightly lower than expected (0.26%) compared with previous reports [30]. Lastly, we were un- able to look into disease duration or activity of RA, and concomitant medication especially glucocorticoids, taken by RA subjects in K-NHANES. It should also be stressed that physical function, proper weight-bearing exercise and disease control are also the key determinants of bone health in patients with RA.
Still, our study attempted to investigate the overlooked topic of nutrition in RA to understand the dietary circum- stances surrounding postmenopausal RA in their daily lives. We have also laid out the significant differences in key nutrient intake by subjects with OP, all of which are related to bone health. In addition, our data were based on stringent criteria to better delineate and compare the OP, ON and NL subgroups in postmenopausal RA.
CONCLUSION
In conclusion, the results from our study indicate diet- ary intake of nutrients potassium, riboflavin, β-carotene, and vitamin C is insufficient in postmenopausal RA wom- en with low BMD. As RA is a systematic condition prone to induce bone mineral loss, dietary counseling and rec- ommendations are warranted for these women, espe- cially for those with deteriorating bone health.
CONFLICT OF INTEREST
No potential conflict of interest relevant to this article was reported.
SUPPLEMENTARY DATA
Supplementary data can be found with this article online at http://www.jrd.or.kr and at https://doi.org/10.4078/
jrd.2017.24.1.35.
REFERENCES
1. Dougados M, Soubrier M, Antunez A, Balint P, Balsa A, Buch MH, et al. Prevalence of comorbidities in rheumatoid arthritis and evaluation of their monitoring: results of an in- ternational, cross-sectional study (COMORA). Ann Rheum Dis 2014;73:62-8.
2. Ikuyama S, Imamura-Takase E, Tokunaga S, Oribe M, Ni- shimura J. Sixty percent of patients with rheumatoid arthri- tis in Japan have used dietary supplements or health foods.
Mod Rheumatol 2009;19:253-9.
3. Fukuda W, Yamazaki T, Akaogi T, Hayashi H, Kusakabe T, Tsubouchi Y, et al. Malnutrition and disease progression in patients with rheumatoid arthritis. Mod Rheumatol 2005;
15:104-7.
4. Hong H, Kim EK, Lee JS. Effects of calcium intake, milk and dairy product intake, and blood vitamin D level on osteopo- rosis risk in Korean adults: analysis of the 2008 and 2009 Korea National Health and Nutrition Examination Survey.
Nutr Res Pract 2013;7:409-17.
5. Tucker KL, Hannan MT, Chen H, Cupples LA, Wilson PW, Kiel DP. Potassium, magnesium, and fruit and vegetable in- takes are associated with greater bone mineral density in elderly men and women. Am J Clin Nutr 1999;69:727-36.
6. Prentice A. Diet, nutrition and the prevention of osteoporosis.
Public Health Nutr 2004;7:227-43.
7. McCann K. Nutrition and rheumatoid arthritis. Explore (NY) 2007;3:616-8.
8. Stamp LK, James MJ, Cleland LG. Diet and rheumatoid ar- thritis: a review of the literature. Semin Arthritis Rheum 2005;35:77-94.
9. Korea National Health & Nutrition Survey [Internet].
Cheongju: Korea Centers for Disease Control & Prevention
[cited 2015 May]. Available from: https://knhanes.cdc.go.
kr/knhanes/index.do.
10. Hur NW, Choi CB, Uhm WS, Bae SC. The prevalence and trend of arthritis in Korea: results from Korea National Health and Nutrition Examination Surveys. J Korean Rheum Assoc 2008;15:11-26.
11. Nesheim RO, Abrams IJ, Blackburn H, Calloway DH, Guthrie HA, Hammonds TM, et al.; National Research Council (US) Committee on Food Consumption Patterns.
Assessing changing food consumption patterns. Washington (DC), National Academies Press (US), 1981.
12. Fukuda W, Omoto A, Oku S, Tanaka T, Tsubouchi Y, Kohno M, et al. Contribution of rheumatoid arthritis disease activ- ity and disability to rheumatoid cachexia. Mod Rheumatol 2010;20:439-43.
13. Lee S, Kim TN, Kim SH, Kim YG, Lee CK, Moon HB, et al.
Obesity, metabolic abnormality, and knee osteoarthritis: a cross-sectional study in Korean women. Mod Rheumatol 2015;25:292-7.
14. Willett WC, Howe GR, Kushi LH. Adjustment for total en- ergy intake in epidemiologic studies. Am J Clin Nutr 1997;
65(4 Suppl):1220S-1228S.
15. Shin CS, Choi HJ, Kim MJ, Kim JT, Yu SH, Koo BK, et al.
Prevalence and risk factors of osteoporosis in Korea: a com- munity-based cohort study with lumbar spine and hip bone mineral density. Bone 2010;47:378-87.
16. Arshad A, Rashid R, Benjamin K. The effect of disease activ- ity on fat-free mass and resting energy expenditure in pa- tients with rheumatoid arthritis versus noninflammatory arthropathies/soft tissue rheumatism. Mod Rheumatol 2007;17:470-5.
17. Peters BS, Martini LA. Nutritional aspects of the prevention and treatment of osteoporosis. Arq Bras Endocrinol Metabol 2010;54:179-85.
18. Hooshmand S, Arjmandi BH. Viewpoint: dried plum, an emerging functional food that may effectively improve bone health. Ageing Res Rev 2009;8:122-7.
19. Boeing H, Bechthold A, Bub A, Ellinger S, Haller D, Kroke A, et al. Critical review: vegetables and fruit in the prevention of chronic diseases. Eur J Nutr 2012;51:637-63.
20. Park HM, Heo J, Park Y. Calcium from plant sources is bene- ficial to lowering the risk of osteoporosis in postmenopausal Korean women. Nutr Res 2011;31:27-32.
21. Maggio D, Polidori MC, Barabani M, Tufi A, Ruggiero C, Cecchetti R, et al. Low levels of carotenoids and retinol in in- volutional osteoporosis. Bone 2006;38:244-8.
22. Yang Z, Zhang Z, Penniston KL, Binkley N, Tanumihardjo SA. Serum carotenoid concentrations in postmenopausal women from the United States with and without osteo- porosis. Int J Vitam Nutr Res 2008;78:105-11.
23. Melhus H, Michaëlsson K, Holmberg L, Wolk A, Ljunghall S. Smoking, antioxidant vitamins, and the risk of hip fracture. J Bone Miner Res 1999;14:129-35.
24. Sahni S, Hannan MT, Blumberg J, Cupples LA, Kiel DP, Tucker KL. Inverse association of carotenoid intakes with 4-y change in bone mineral density in elderly men and wom- en: the Framingham Osteoporosis Study. Am J Clin Nutr 2009;89:416-24.
25. De Pablo P, Dietrich T, Karlson EW. Antioxidants and other novel cardiovascular risk factors in subjects with rheuma- toid arthritis in a large population sample. Arthritis Rheum
2007;57:953-62.
26. Yoon EH, Noh H, Lee HM, Hwang HS, Park HK, Park YS.
Bone mineral density and food-frequency in Korean adults:
the 2008 and 2009 Korea National Health and Nutrition Examination Survey. Korean J Fam Med 2012;33:287-95.
27. Mun SO, Kim J, Yang YJ. Factors associated with bone min- eral density in Korean postmenopausal women aged 50 years and above: using 2008-2010 Korean National Health and Nutrition Examination Survey. Korean J Community Nutr 2013;18:177-86.
28. Haugen M, Homme KA, Reigstad A, Teigland J. Assessment
of nutritional status in patients with rheumatoid arthritis and osteoarthritis undergoing joint replacement surgery.
Arthritis Care Res 1999;12:26-32.
29. Kajiyama H, Akama H, Yamanaka H, Shoji A, Matsuda Y, Tanaka E, et al. One third of Japanese patients with rheuma- toid arthritis use complementary and alternative medicine.
Mod Rheumatol 2006;16:355-9.
30. Cho SK, Sung YK, Choi CB, Kwon JM, Lee EK, Bae SC.
Development of an algorithm for identifying rheumatoid ar- thritis in the Korean National Health Insurance claims database. Rheumatol Int 2013;33:2985-92.
Supplementary Table 1. Demographics and characteristics of postmenopausal women in rheumatoid arthritis and non-arthritis subjects
Variable Rheumatoid arthritis (n=242) Non-arthritis (n=320) p-value
Age (yr) 64.2±0.7 64.0±0.8 0.8823
Monthly income 0.4347
1st tertile 83 (27.6) 89 (22.4)
2nd tertile 103 (43.9) 144 (48.4)
3rd tertile 54 (28.5) 70 (29.2)
Education level 0.0656
Primary or lower 182 (67.7) 229 (67.7)
Middle school 32 (15.1) 39 (14.5)
High school 24 (15.0) 31 (9.8)
College or higher 4 (2.2) 21 (7.9)
Marital status 0.7493
Married 142 (42.2) 189 (61.9)
Single 98 (43.8) 125 (38.1)
Family history of OP 33 (14.5) 56 (17.2) 0.7377
Residential area 0.0020
Urban 118 (55.6) 198 (70.4)
Rural 124 (44.4) 122 (29.6)
High-risk alcohol user 51 (29.2) 72 (24.5) 0.3387
Current smoker 9 (2.9) 11 (3.5) 0.6643
BMI (kg/m2) 23.6±0.23 24.1±0.22 0.0977
Values are presented as mean±standard error or number (%). OP: osteoporosis, BMI: body mass index.
Supplementary Table 2. Daily nutrient intake in rheumatoid arthritis versus non-arthritis subjects
Variable Rheumatoid arthritis (n=222) Non-arthritis (n=320) p-value
Total calorie (kcal) 1,446.21±1.04 1,391.03±1.04 0.4734
Protein (g) 45.69±1.08 45.43±1.09 0.9359
Fat (g) 16.94±1.12 17.14±1.12 0.7144
Carbohydrate (g) 257.24±1.07 258.22±1.07 0.7253
Calcium (mg) 348.35±1.12 314.91±1.12 0.1099
Phosphorous (mg) 843.20±1.08 831.81±1.08 0.7787
Sodium (mg) 3,022.38±1.15 2,826.52±1.15 0.2429
Potassium (mg) 2,244.86±1.09 2,174.60±1.09 0.6457
Iron (mg) 10.91±1.11 10.19±1.10 0.3344
Vitamin A (μgRE) 413.89±1.10 381.84±1.07 0.5428
Thiamin (mg) 0.84±1.08 0.83±1.08 0.984
Riboflavin (mg) 0.75±1.11 0.69±1.12 0.1762
Niacin (mg) 10.51±1.09 10.76±1.08 0.4835
Vitamin C (mg) 70.36±1.16 61.69±1.16 0.1337
β-carotene (μg) 2,075.38±1.11 1,926.38±1.08 0.5731
Retinol (μg) 22.03±1.21 17.72±1.17 0.3579
Values are least square mean±standard error. All nutrients other than total calorie intake were adjusted for total calorie intake.