ABSTRACT
BACKGROUND: Limited data are available on the prognosis of progressive mitral stenosis (MS). We evaluated the factors associated with adverse events in patients with progressive MS.
METHODS: We retrospectively analyzed 259 consecutive patients with pure progressive MS with a mitral valve area (MVA) between 1.5 and 2.0 cm2. The primary outcome measures were a composite endpoint of cardiac death, heart failure hospitalization, mitral valve surgery or percutaneous mitral valvuloplasty, and ischemic stroke.
RESULTS: The mean patient age was 62 ± 12 years, and the mean MVA was 1.71 ± 0.15 cm2. Over a median follow-up duration of 52 months, a total of 41 patients (18.3%) experienced the composite endpoint. In multivariable Cox regression analysis, prior stroke (hazard ratio [HR], 4.54; 95% confidence interval [CI], 2.16–9.54; p < 0.001) and left atrial volume index (LAVI) of > 50 mL/m2 (HR, 4.45; 95% CI, 1.31–15.31; p = 0.017) were identified as independent predictors of the composite endpoint, even after adjusting for age and sex. Patients with a LAVI ≤ 50 mL/m2 demonstrated favorable event-free survival compared with those with a LAVI
> 50 mL/m2 in either the overall population (p < 0.001) or asymptomatic patients (p = 0.002).
Atrial fibrillation (AF), left ventricular mass index (LVMI), MVA, and mean diastolic pressure were factors independently associated with LAVI (all p < 0.05).
CONCLUSIONS: A deleterious impact of a high LAVI on outcome was observed in patients with progressive MS. The LAVI was mainly influenced by the presence of AF, the severity of MS, and LVMI in this population.
Keywords: Mitral stenosis; Left atrial volume; Prognosis
INTRODUCTION
Mitral stenosis (MS) is the narrowing of the mitral valve orifice. It is almost always rheumatic in origin, although the incidence of degenerative MS due to heavy calcification of the mitral valve apparatus is increasing in elderly populations.1) The mitral valve orifice is slowly narrowed by progressive fibrosis, calcification of the valve leaflets, and fusion of the cusps and subvalvular apparatus.2) Severe or significant MS is diagnosed when the planimetered mitral valve area (MVA) is 1.5 cm2 or less. MS with an MVA of >1.5 cm2 is categorized as
Original Article
Received: Nov 29, 2018 Revised: Jan 25, 2019 Accepted: Feb 14, 2019 Address for Correspondence:
Hyuk-Jae Chang, MD, PhD Division of Cardiology, Severance Cardiovascular Hospital, Yonsei University College of Medicine, 50-1 Yonsei-ro, Seodaemun-gu, Seoul 03722, Korea.
E-mail: [email protected] Copyright © 2019 Korean Society of Echocardiography
This is an Open Access article distributed under the terms of the Creative Commons Attribution Non-Commercial License (https://
creativecommons.org/licenses/by-nc/4.0/) which permits unrestricted non-commercial use, distribution, and reproduction in any medium, provided the original work is properly cited.
ORCID iDs In-Jeong Cho
https://orcid.org/0000-0002-1209-5129 Hyeonju Jeong
https://orcid.org/0000-0002-7916-3624 Jah-Yeon Choi
https://orcid.org/0000-0002-6793-4137 Sang-Eun Lee
https://orcid.org/0000-0001-6645-4038 Hyuk-Jae Chang
https://orcid.org/0000-0002-6139-7545 Conflict of Interest
The authors have no financial conflicts of interest.
In-Jeong Cho , MD1, Hyeonju Jeong , MD2, Jah-Yeon Choi , MD, PhD3, Sang-Eun Lee , MD, PhD3, and Hyuk-Jae Chang , MD, PhD3
1 Division of Cardiology, Department of Internal Medicine, Ewha Womans University Seoul Hospital, Ewha Womans University College of Medicine, Seoul, Korea
2Division of Cardiology, Department of Internal Medicine, Myungji Hospital, Goyang, Korea
3Division of Cardiology, Severance Cardiovascular Hospital, Yonsei University College of Medicine, Seoul, Korea
Prognostic Implications of the Left
Atrial Volume Index in Patients with
Progressive Mitral Stenosis
progressive MS and is generally considered clinically insignificant.1)3) The indication for intervention is limited to patients with clinically significant MS with an MVA ≤1.5 cm2, and there are limited treatment options for progressive MS. Percutaneous mitral valvuloplasty (PMV) may be considered in symptomatic patients with an MVA >1.5 cm2 if symptoms cannot be explained by another cause or if there is evidence of hemodynamically significant MS during exercise.1)3) Regular echocardiographic follow-up at 3–5-year intervals is the only current recommendation for patients with progressive MS,1) and strategies to identify patients at a high risk of adverse cardiac events have not been established. Therefore, we aimed to identify clinical and echocardiographic predictors for adverse events in patients with progressive MS of an MVA between 1.5 and 2.0 cm2 and to establish associated factors.
METHODS
Patients
We retrospectively reviewed patients diagnosed with rheumatic progressive MS (MVA between 1.5 and 2.0 cm2) who underwent echocardiography at a tertiary referral hospital for valvular heart disease from January 2004 to December 2016. The exclusion criteria were as follows: > 1+ mitral valve regurgitation, > 1+ aortic valve regurgitation and/or a condition more severe than mild aortic stenosis, congenital or myopathic lesions that could affect the left ventricular (LV) function or pulmonary artery pressure, and a history of PMV.
Therefore, the sample for analysis included 225 patients with rheumatic pure progressive MS. Hypertension was defined as a systolic blood pressure (BP) of ≥ 140 mmHg and/
or a diastolic BP of ≥ 90 mmHg or use of antihypertensive agents. Diabetes mellitus was defined as receiving anti-diabetic treatment or a fasting plasma glucose level of ≥ 126 mg/
dL. Dyslipidemia was defined as the use of cholesterol-lowering medication or a serum total cholesterol level of ≥ 200 mg/dL. CHA2DS2-VASc score was calculated on the basis of the presence of congestive heart failure, hypertension, age, diabetes mellitus, prior stroke or transient ischemic attack, vascular disease, and female sex, as previously described by Lip et al.4) Vascular disease prior to myocardial infarction and peripheral artery disease was included. Kidney function was ascertained by the estimated glomerular filtration rate (GFR), calculated using the formula developed and validated in the Modification of Diet in Renal Disease(MDRD) study as follows5): GFR (mL/min/1.73 m2) = 186.3 × (serum creatinine [mg/
dL]-1.154 × age-0.203 (× 0.742, if female). This study was approved by the Institutional Review Board of Yonsei University, Severance Hospital, Seoul, Republic of Korea.
Echocardiographic examination
The LV end-diastolic dimension (LVEDD), LV end-systolic dimension (LVESD), septal thickness, and LV posterior wall thickness were measured at end-diastole from the
parasternal short-axis view. The LV ejection fraction (LVEF) was calculated using the LVEDD and LVESD. The LV mass was calculated using the formula set forth by the American Society of Echocardiography,6) and the LV mass index (LVMI) was the indexed LV mass for the body surface area (BSA). The left atrial (LA) volume was calculated from the parasternal long- axis view and apical four-chamber view using the prolate ellipse method.7) The LA volume index (LAVI) was the indexed LA volume for the BSA. The systolic pulmonary artery pressure (SPAP) was calculated as follows: 4 × (maximum velocity of the tricuspid regurgitant jet)2 + right atrial pressure. The right atrial pressure was estimated by measuring the inferior vena cava diameter and its response to inspiration.8) The mean diastolic pressure gradient (MDPG) was measured from a continuous wave Doppler signal across the mitral valve by
tracing its envelope. The MVA was assessed using two-dimensional planimetry. The MVA by pressure half time (PHT) was calculated using the formula 220/PHT.9) The net atrioventricular compliance (Cn) was determined using the following equation: Cn (mL/mmHg) = 1270
× (planimetric MVA/E-wave downslope).10)11) The echocardiographic measurements were averaged for three beats in patients with sinus rhythm and for five beats in those with atrial fibrillation (AF). Severe tricuspid regurgitation (TR) was defined in accordance with the American Society of Echocardiography guidelines.12)
Study endpoint
The patients were followed up across a median of 52 months (interquartile range, 17–95 months) for a composite endpoint that included cardiac deaths, inpatient admissions for heart failure, mitral valve replacement (MVR), PMV, and ischemic stroke. The occurrence of any of the aforementioned clinical events that comprised the composite study endpoint was ascertained by a review of hospital records and by telephone interview, as necessary.
Statistical methods
The demographic characteristics were reported as percentages or mean ± SD. The patient groups were compared using chi-square statistics for categorical variables and Student's t-test for continuous variables. Receiver-operating characteristic (ROC) curves were plotted to determine the sensitivity and specificity of the different echocardiographic variables in predicting all events and to determine the cut-off value. The ROC curves were compared using a procedure previously described by DeLong et al.13) Univariable and multivariable Cox proportional hazards regression models reporting the hazard ratios (HRs) and 95% confidence intervals (95% CIs) were employed to determine potentially useful variables for predicting the event-free survival rate following echocardiography. Variables that displayed statistical significance in the univariable analysis were entered in the multivariable Cox model. Kaplan- Meier survival curves were used to plot all clinical events according to the time-to-first event.
In an effort to determine potential independent associations between the clinical factors and LAVI, linear relationships were checked using univariable linear regression analysis. Variables displaying statistical significance in the univariable analysis were entered into a multivariable linear regression model. A p-value < 0.05 was considered statistically significant.
RESULTS
Baseline clinical characteristics
The baseline characteristics of the study population are shown in Table 1. Mean patient age was 62 ± 12 years; approximately 75.6% of them were women, and 27.1% were symptomatic.
The mean MVA via planimetry was 1.74 ± 0.14 cm2. The patients were classified into two groups according to the occurrence of the primary endpoint. Patients who experienced the study endpoint had a higher incidence of prior stroke (24.4% vs. 7.1%, p = 0.001).
No significant differences in demographic characteristics, including age, sex, BSA,
hypertension, diabetes, dyslipidemia, current smoking, prior vascular disease, symptomatic status, BP, and medications, were found between the groups. The prescription rate of renin- angiotensin system blockers was higher in patients with events (p = 0.020). Eighty patients (35.6%) used anticoagulants. The only anticoagulant used was a vitamin K antagonist; none of the patients received direct oral anticoagulants. The LAVI was higher in patients with events than in those without events (66.1 ± 25.5 mL/m2 vs. 51.8 ± 22.9 mL/m2, p < 0.001),
whereas the LVEDD, LVESD, LVEF, LVMI, MVA, MDPG, Cn, SPAP, and prevalence of severe TR were not significantly different between groups (all p ≥ 0.05).
Predictors for clinical outcomes
Over the course of the study period, a total of 41 patients (18.3%) experienced the composite endpoint. Specifically, three patients (1.3%) experienced death from cardiac causes; eight (3.6%) inpatient admissions for heart failure; 12 (5.3%) MVRs; two (0.9%) PMVs; and 16 (7.1%) strokes.
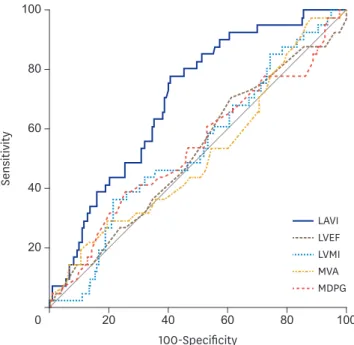
The results of the ROC curve analysis for the prediction of the composite endpoint are shown in Figure 1. The area under curve (AUC) was 0.701 (95% CI, 0.636–0.760) for the LAVI, 0.522 Table 1. Baseline characteristics
Variables Overall (N = 225) Without events (n = 184) With events (n = 41) p-value
Demographics
Age (years) 62 ± 12 61 ± 12 64 ± 11 0.233
Female sex 170 (75.6) 138 (75.0) 32 (78.0) 0.681
AF 93 (41.3) 72 (39.1) 21 (51.2) 0.155
Body surface area (m2) 1.62 ± 0.17 1.62 ± 0.17 1.62 ± 0.18 0.945
Hypertension 111 (49.3) 88 (47.8) 23 (56.1) 0.338
Diabetes 42 (18.7) 32 (17.4) 10 (24.4) 0.298
Dyslipidemia 60 (26.7) 46 (25.0) 14 (34.1) 0.231
Current smoking 7 (3.1) 7 (3.8) 0 (0) 0.355
Prior stroke 23 (10.2) 13 (7.1) 10 (24.4) 0.001
Prior vascular disease 7 (3.1) 5 (2.7) 2 (4.9) 0.471
Symptomatic 61 (27.1) 48 (26.1) 13 (31.7) 0.464
Systolic BP (mmHg) 122.1 ± 21.7 120.7 ± 21.7 128.4 ± 20.9 0.089
Diastolic BP (mmHg) 76.9 ± 14.8 76.4 ± 15.5 79.1 ± 11.3 0.378
CHA2DS2-VASc score 2.3 ± 1.5 2.2 ± 1.5 2.7 ± 1.6 0.048
CHA2DS2-VASc score ≥ 2 140 (62.2) 109 (59.2) 31 (75.6) 0.051
Medication
Anticoagulation 80 (35.6) 65 (35.3) 15 (36.6) 0.879
Antiplatelet agent 71 (31.6) 55 (29.9) 16 (39.0) 0.255
Calcium channel blocker 63 (28.0) 47 (25.5) 16 (39.0) 0.082
Beta blocker 49 (21.8) 38 (20.7) 11 (26.8) 0.386
Renin-angiotensin system blocker 70 (31.1) 51 (27.7) 19 (46.3) 0.020
Laboratory test
Hemoglobin (g/dL) 13.2 ± 1.8 13.0 ± 1.8 13.6 ± 1.5 0.074
GFR, mL/min/1.73 m2 74.8 ± 18.7 74.5 ± 19.5 75.7 ± 15.1 0.727
AST (IU/L) 23.6 ± 13.9 24.1 ± 14.9 21.8 ± 8.2 0.364
ALT (IU/L) 21.3 ± 13.4 21.8 ± 14.5 19.1 ± 6.8 0.251
Echocardiography
LVEDD (mm) 48.4 ± 4.5 48.3 ± 4.3 48.9 ± 5.2 0.473
LVESD (mm) 32.1 ± 4.2 32.0 ± 4.0 32.7 ± 4.8 0.340
LVEF (%) 65.3 ± 7.1 65.5 ± 6.8 64.7 ± 8.3 0.512
LVMI (g/m2) 98.2 ± 22.9 97.7 ± 23.0 100.6 ± 22.2 0.466
LAVI (mL/m2) 54.2 ± 24.0 51.8 ± 22.9 66.1 ± 25.5 < 0.001
MVA by planimetry (cm2) 1.74 ± 0.14 1.74 ± 0.14 1.73 ± 0.14 0.716
MVA by pressure half time (cm2) 1.83 ± 0.32 1.84 ± 0.31 1.80 ± 0.33 0.525
MDPG (mmHg) 3.6 ± 1.1 3.6 ± 1.1 3.4 ± 1.1 0.399
Cn (mL/mmHg) 7.4 ± 1.7 7.42 ± 1.73 7.35 ± 1.67 0.800
SPAP (mmHg) 29.6 ± 8.3 29.5 ± 8.4 30.0 ± 7.6 0.696
SPAP ≥ 50 mmHg 4 (1.8) 4 (2.2) 0 (0) 0.999
Severe TR 1 (0.4) 0 (0) 1 (2.4) 0.182
AF: atrial fibrillation, ALT: alkaline phosphatase, AST: aspartate aminotransferase, BP: blood pressure, Cn: net atrioventricular compliance, GFR: glomerular filtration rate, LAVI: left atrial volume index, LVEDD: left ventricular end-diastolic diameter, LVEF: left ventricular ejection fraction, LVESD: left ventricular end- systolic diameter, LVMI: left ventricular mass index, MDPG: mean diastolic pressure gradient, MVA: mitral valve area, SPAP: systolic pulmonary artery pressure, TR: tricuspid regurgitation.
Data are shown as number (%).
(95% CI, 0.454–0.590) for the LVEF, 0.538 (95% CI, 0.470–0.605) for the LVMI, 0.514 (95% CI, 0.446–0.582) for the planimetered MVA, and 0.538 (95% CI, 0.470–0.605) for the MDPG. The differences between the AUC of the LAVI and those of other variables, including LVEF, LVMI, MVA, and MDPG, were all significant (all p < 0.05). The optimal cut-off value according to the ROC curves for the LAVI was 50 mL/m2 (sensitivity = 78.0%, specificity = 59.8%).
Table 2 shows the baseline characteristics and endpoints during follow-up in the subgroup of 93 patients with AF. Of the patients, 58 (62.4%) received anticoagulation and 35 (37.6%) did not. The prevalence of a CHA2DS2-VASc score ≥ 2 was higher in the patients who received anticoagulation than in those who did not receive anticoagulation (67.2% vs. 54.3%), although the difference was not statistically significant. The composite endpoint did not statistically differ between the groups, but the actual prevalence of stroke was higher in the patients who
40
20 80 100
60
100-Specificity
20 40 60 80 100
0
Sensitivity
LAVI LVEF LVMI MVA MDPG
Figure 1. Comparison of the ROC curves for the prediction of adverse events in patients with progressive mitral stenosis. Area under curve: LAVI = 0.701 (95% CI, 0.636–0.760), LVEF = 0.522 (95% CI, 0.454–0.590), LVMI = 0.538 (95% CI, 0.470–0.605), MVA = 0.514 (95% CI, 0.446–0.582), and MDPG = 0.538 (95% CI, 0.470–0.605). CI:
confidence interval, LAVI: left atrial volume index, LVEF: left ventricular ejection fraction, LVMI: left ventricular mass index, MDPG: mean diastolic pressure gradient, MVA: mitral valve area, ROC: receiver-operating characteristic.
Table 2. Characteristics of the subgroup patients with atrial fibrillation
Variables Anticoagulation CHA2DS2-VASc score ≥ 2
Yes (n = 58) No (n = 35) p-value No (n = 36) Yes (n = 57) p-value
Age (years) 65 ± 9 65 ± 9 0.697 65 ± 10 65 ± 9 0.986
Female sex 46 (79.3) 26 (74.3) 0.574 30 (83.3) 42 (73.7) 0.278
Prior stroke 9 (15.5) 2 (5.7) 0.198 4 (11.1) 7 (12.3) 0.999
Anticoagulation 58 (100) 0 (0) - 20 (55.6) 38 (66.7) 0.281
CHA2DS2-VASc score 2.4 ± 1.6 2.2 ± 1.6 0.111 0.8 ± 0.4 3.2 ± 1.3 < 0.001
CHA2DS2-VASc score ≥ 2 39 (67.2) 19 (54.3) 0.281 0 (0) 57 (100) -
Endpoint 12 (20.7) 9 (25.7) 0.535 5 (13.9) 16 (28.1) 0.111
Cardiac death 2 (3.4) 0 (0) 1 (2.8) 1 (1.8)
HF administration 2 (3.4) 2 (5.7) 1 (2.8) 3 (5.3)
MVR or PMV 4 (6.9) 3 (8.6) 2 (5.6) 5 (8.8)
Stroke 4 (6.9) 4 (11.4) 1 (2.8) 7 (12.3)
HF: heart failure, MVR: mitral valve replacement, PMV: percutaneous mitral valvuloplasty.
Data are shown as number (%).
did not receive anticoagulation (11.4% vs. 6.9%). When the AF patients were grouped according to the CHA2DS2-VASc score, 36 patients had CHA2DS2-VASc scores < 2 and 57 had CHA2DS2- VASc scores ≥ 2. The patients with CHA2DS2-VASc scores ≥ 2 showed a higher stroke prevalence during follow-up, but this difference was not statistically significant (2.8% vs. 12.3%, p = 0.111).
Table 3 shows the results of the univariable Cox regression analysis for the prediction of the composite endpoint. Prior stroke (HR, 3.84; 95% CI, 1.87–7.92; p < 0.001) and a LAVI >
50 mL/m2 (HR, 4.19; 95% CI, 2.05–8.57; p < 0.001) were the predictors for the composite endpoint. Table 4 describes the results of the multivariable Cox regression analysis for the prediction of the composite endpoint. In various multivariable models, prior stroke and a LAVI > 50 mL/m2 were the independent predictors of the composite endpoint (all p < 0.05), even after adjustment for variables.
Table 3. Univariable Cox regression analysis for the prediction of the composite endpoints
Variables Hazard ratio 95% confidence interval p-value
Age, per 10 years 1.30 0.98–1.74 0.073
Female sex 1.17 0.56–2.45 0.679
AF 1.64 0.89–3.04 0.112
Hypertension 1.36 0.73–2.52 0.332
Diabetes 1.54 0.75–3.14 0.237
Prior stroke 3.84 1.87–7.92 < 0.001
CHA2DS2-VASc score ≥ 2 1.76 0.86–3.59 0.121
Anticoagulation 1.02 0.54–1.94 0.948
Renin-angiotensin system blocker 1.87 0.57–6.17 0.301
Symptomatic 1.57 0.81–3.04 0.182
LVEF ≤ 65% 1.07 0.58–1.98 0.828
LVMI > 115 g/m2 1.86 0.97–3.56 0.063
LAVI > 50 mL/m2 4.19 2.05–8.57 < 0.001
MVA by planimetry ≤ 1.75 cm2 1.03 0.56–1.91 0.916
MDPG > 3.5 mmHg 1.13 0.61–2.09 0.699
SPAP > 30 mmHg 1.12 0.60–2.07 0.723
Cn ≤ 7.2 mL/mmHg 1.24 0.67–2.29 0.495
AF: atrial fibrillation, Cn: net atrioventricular compliance, LAVI: left atrial volume index, LVEF: left ventricular ejection fraction, LVMI: left ventricular mass index, MDPG: mean diastolic pressure gradient, MVA: mitral valve area, SPAP: systolic pulmonary artery pressure.
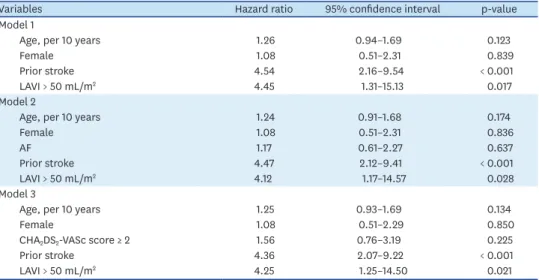
Table 4. Multivariate Cox regression analysis for the prediction of the composite endpoints
Variables Hazard ratio 95% confidence interval p-value
Model 1
Age, per 10 years 1.26 0.94–1.69 0.123
Female 1.08 0.51–2.31 0.839
Prior stroke 4.54 2.16–9.54 < 0.001
LAVI > 50 mL/m2 4.45 1.31–15.13 0.017
Model 2
Age, per 10 years 1.24 0.91–1.68 0.174
Female 1.08 0.51–2.31 0.836
AF 1.17 0.61–2.27 0.637
Prior stroke 4.47 2.12–9.41 < 0.001
LAVI > 50 mL/m2 4.12 1.17–14.57 0.028
Model 3
Age, per 10 years 1.25 0.93–1.69 0.134
Female 1.08 0.51–2.29 0.850
CHA2DS2-VASc score ≥ 2 1.56 0.76–3.19 0.225
Prior stroke 4.36 2.07–9.22 < 0.001
LAVI > 50 mL/m2 4.25 1.25–14.50 0.021
AF: atrial fibrillation, LAVI: left atrial volume index.
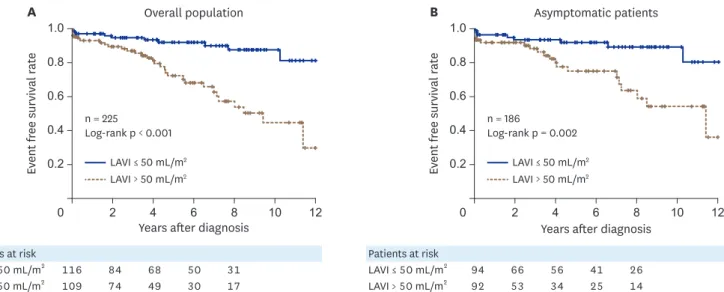
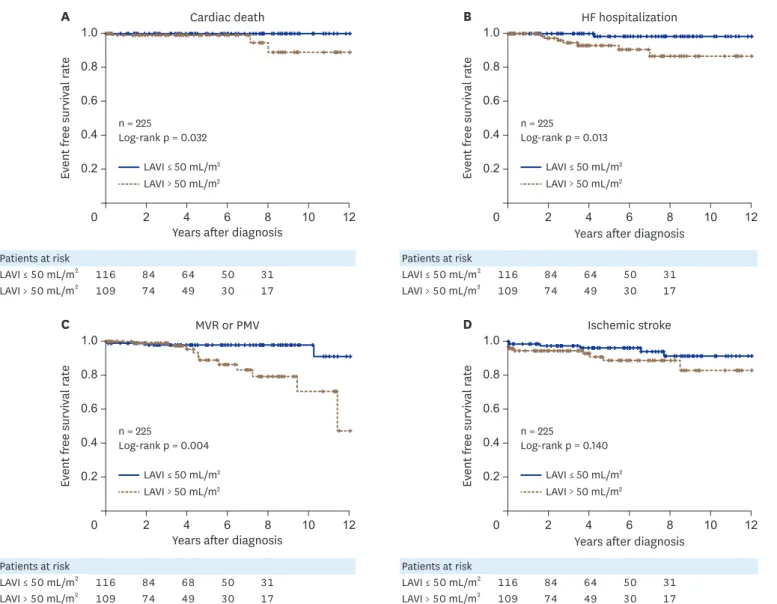
Figure 2 shows the event-free survival rates for the composite endpoint stratified by the LAVI. Notably, patients with a LAVI ≤ 50 mL/m2 demonstrated a favorable event-free survival compared with those with a LAVI > 50 mL/m2 in the overall population (log-rank p < 0.001) and asymptomatic patients (log-rank p = 0.002). Figure 3 shows the Kaplan-Meier curve of event-free survival rates for each endpoint stratified by the LAVI in the overall population.
The patients with a LAVI ≤ 50 mL/m2 demonstrated a favorable event-free survival compared with those with a LAVI > 50 mL/m2 regarding cardiac death, heart failure hospitalization, and MVR or PMV (all log-rank p < 0.05). There were fewer stroke events in the patients with a LAVI ≤ 50 mL/m2, although this was not significantly different (log-rank p = 0.140).
Determinants of the LAVI
Table 5 shows the results of the univariable and multivariable linear regression analyses for the factors associated with the LAVI in progressive MS. In the univariable analysis, age (beta = 0.215, p = 0.001), AF (beta = 0.428, p < 0.001), LVMI (beta = 0.223, p = 0.001), MVA by planimetry (beta
= -0.199, p = 0.003), MDPG (beta = -0.199, p = 0.003), and Cn (beta = -0.155, p = 0.020) showed significant correlations with the LAVI. In the multivariable analysis, AF, LVMI, MVA, and MDPG were the factors independently associated to LAVI, even after adjusting for age and Cn.
DISCUSSION
The principal findings of the current study are as follows: 1) approximately 18.3% of patients with progressive MS experienced cardiovascular events during the median follow-up period of 55 months; 2) a LAVI >50 mL/m2 was a prognostic marker for adverse cardiac events; and 3) LVMI, severity of MS, and presence of AF were independent determinants of the LAVI in progressive MS.
Therapeutic strategies for progressive MS
Progressive MS is usually considered benign, and specific therapies are not recommended, except for regular follow-ups at 3–5-year intervals.1) Notably, 18.3% of the studied population experienced adverse events during a median follow-up of 4 years. The number of MVRs Patients at risk
LAVI ≤ 50 mL/m2 116 84 68 50 31
LAVI > 50 mL/m2 109 74 49 30 17
Patients at risk
LAVI ≤ 50 mL/m2 94 66 56 41 26
LAVI > 50 mL/m2 92 53 34 25 14
n = 225
Log-rank p < 0.001 n = 186
Log-rank p = 0.002 1.0
0
Event free survival rate
0.2 0.6
12 10 8 6 4 2
A
Years after diagnosis LAVI ≤ 50 mL/m2
LAVI > 50 mL/m2
LAVI ≤ 50 mL/m2 LAVI > 50 mL/m2 1.0
0
Event free survival rate
0.2 0.6
12 10 8 6 4 2
B
Years after diagnosis
Overall population Asymptomatic patients
0.8
0.4
0.8
0.4
Figure 2. Kaplan-Meier curve showing the event-free survival rate for the composite primary endpoint stratified by the LAVI. Overall population (A) and asymptomatic patients (B). LAVI: left atrial volume index.
Patients at risk
LAVI ≤ 50 mL/m2 116 84 64 50 31
LAVI > 50 mL/m2 109 74 49 30 17
Patients at risk
LAVI ≤ 50 mL/m2 116 84 68 50 31
LAVI > 50 mL/m2 109 74 49 30 17
Patients at risk
LAVI ≤ 50 mL/m2 116 84 64 50 31
LAVI > 50 mL/m2 109 74 49 30 17
Patients at risk
LAVI ≤ 50 mL/m2 116 84 64 50 31
LAVI > 50 mL/m2 109 74 49 30 17 n = 225
Log-rank p = 0.032 n = 225
Log-rank p = 0.013 1.0
0
Event free survival rate
0.2 0.6
12 10 8 6 4 2
A
Years after diagnosis LAVI ≤ 50 mL/m2
LAVI > 50 mL/m2
LAVI ≤ 50 mL/m2 LAVI > 50 mL/m2 1.0
0
Event free survival rate
0.2 0.6
12 10 8 6 4 2
B
Years after diagnosis
Cardiac death HF hospitalization
0.8
0.4
0.8
0.4
n = 225
Log-rank p = 0.004 n = 225
Log-rank p = 0.140 1.0
0
Event free survival rate
0.2 0.6
12 10 8 6 4 2
C
Years after diagnosis LAVI ≤ 50 mL/m2
LAVI > 50 mL/m2
LAVI ≤ 50 mL/m2 LAVI > 50 mL/m2 1.0
0
Event free survival rate
0.2 0.6
12 10 8 6 4 2
D
Years after diagnosis
MVR or PMV Ischemic stroke
0.8
0.4
0.8
0.4
Figure 3. Kaplan-Meier curve showing the event-free survival rate for the individual endpoints stratified by the LAVI in the overall population. Cardiac death (A), HF hospitalization (B), MVR or PMV (C), and ischemic stroke (D). HF: heart failure, LAVI: left atrial volume index, MVR: mitral valve replacement, PMV:
percutaneous mitral valvuloplasty.
Table 5. Univariable and multivariable linear regression analyses for the factors associated with the left atrial volume index in progressive mitral stenosis
Variables Univariable Multivariable
beta p-value beta p-value
Age 0.215 0.001 0.076 0.232
Female sex 0.061 0.365 - -
AF 0.438 < 0.001 0.420 < 0.001
Hypertension 0.069 0.306 - -
Diabetes 0.016 0.817 - -
Prior stroke 0.025 0.714 - -
LVEF −0.063 0.351 - -
LVMI 0.223 0.001 0.267 < 0.001
MVA by planimetry −0.199 0.003 −0.152 0.011
MDPG 0.199 0.003 0.161 0.017
Cn −0.155 0.020 0.005 0.942
AF: atrial fibrillation, Cn: net atrioventricular compliance, LVEF: left ventricular ejection fraction, LVMI: left ventricular mass index, MDPG: mean diastolic pressure gradient, MVA: mitral valve area.
or PMVs that were performed, significantly increased 3 years from the first diagnosis of progressive MS. Therefore, our data suggest that follow-up at 3-year intervals might be an appropriate option for detecting the progression of disease in MS, considering the relatively high incidence of events during follow-up in progressive MS.
Surprisingly, the incidence of AF in our study was approximately 40% in all patients, and 10% had a history of stroke at baseline, although progressive MS is usually considered clinically insignificant. AF in progressive MS is basically categorized as nonvalvular AF in the recent guidelines.14) However, specific data regarding anticoagulation strategies, including vitamin K antagonist or non-vitamin K antagonist oral anticoagulant administration and the prognostic role of the CHA2DS2-VASc score4) in targeting progressive MS with AF, are lacking. Additionally, the treatment options for progressive MS with a sinus rhythm have been investigated less. Adequate anticoagulation should be considered for AF patients with progressive MS, as our retrospective analysis showed that many of the patients with progressive MS who had high CHA2DS2-VASc scores did not receive anticoagulation and that
> 12% eventually had a stroke during a median follow-up of 52 months. Therefore, adequate anticoagulation directed by the CHA2DS2-VASc score is essential for the treatment of
progressive MS. Moreover, specific therapeutic strategies for progressive MS according to risk stratification need further investigation.
LAVI as a predictor for progressive MS
The LAVI is a prognostic marker for cardiovascular outcomes in the general population,15)16) as well as various heart diseases, such as heart failure,17) hypertrophic cardiomyopathy,18)19) and ischemic cardiomyopathy.20)21) In valvular heart disease, the LAVI was a prognostic marker for cardiovascular outcomes after mitral valve surgery22) and in medically treated patients with mitral regurgitation.23)
The ability of the LAVI to predict outcomes in patients with MS is less clear. Ancona et al.24) reported that LA volumes did not predict the AF incidence in patients with MS, although the increase in the upstream pressure usually leads to progressive enlargement of the LA in MS. We found that the LAVI may serve as a prognostic marker in progressive MS. This discrepancy might have resulted from the fact that our population was composed of patients with less severe MS and an MVA > 1.5 cm2; therefore, the influence of MS severity on the outcomes was attenuated, and the prognostic power of the LAVI was enhanced. The LAVI might also be applicable for each event, such as cardiac death, heart failure hospitalization, mitral valve intervention, and probably stroke, aside from the composite endpoint. Prior stroke was a powerful predictor for the future incidence of stroke but did not predict other cardiac events. In contrast, a high LAVI > 50 mL/m2 was the only independent universal predictor for various cardiac events in progressive MS, which could be helpful for risk stratification in this population.
Determinants of the LAVI in progressive MS
We found that multiple factors are associated with the LAVI in progressive MS. The associated factors were AF, MVA, MDPG, and LVMI. It is not surprising that AF, MVA, and MDPG were factors associated with the LAVI, since AF induces LA electrical and mechanical remodeling,25) and the increase in the upstream pressure usually leads to progressive enlargement of the LA.
Interestingly, we found that the LVMI was also closely associated with the LAVI in progressive MS. LV hypertrophy is associated with diastolic dysfunction and LV end-diastolic pressure increase, which can further exaggerate LA pressure increase and result in LA enlargement. We previously reported that LV diastolic function was an important factor of MDPG and LA reverse
remodeling in patients with severe MS.26) Similarly, LV hypertrophy and associated LV diastolic function might exaggerate LA enlargement and accelerate poor clinical outcomes. Therefore, LV hypertrophy and diastolic dysfunction can be a target of treatment for progressive MS, although the assessment of diastolic function in patients with MS is challenging.27) Limitations
Several limitations need to be acknowledged. The current study findings were based on a retrospective analysis, which may infer some biases. Despite this, we carefully reviewed all medical records, along with echocardiographic images, in an effort to avoid any possible biases that may have arisen. Information regarding the duration of AF, which might have a significant impact on the outcomes, was unavailable. The reason for the low prevalence of anticoagulation in the AF patients is unclear as this study was a retrospective analysis and the patients were followed up and treated in accordance with the preference of the dedicated attending physician. TR can lead to hepatic congestion and fluctuation in the degree of anticoagulation, which can result in brain hemorrhage and ischemic stroke. However, severe TR was present in only one patient; therefore, its clinical significance cannot be determined in the present study and further investigation is warranted. The studied population consisted of patients at high risk of cardiovascular disease, with a high incidence of AF, hypertension, diabetes, and prior stroke. In addition, approximately 27% of patients were symptomatic, although they had clinically insignificant MS, and this might have caused a high incidence of the composite endpoint. As this study was performed retrospectively, it was difficult to clearly define etiology in all symptomatic patients. Exercise echocardiographic data were not available, and would be beneficial for risk stratification among patients with progressive MS symptoms in future studies.
Conclusions
A LAVI > 50 mL/m2 was a prognostic marker of adverse cardiac events in patients with progressive MS. The LAVI was mainly influenced by the presence of AF, the severity of MS, and LVMI in this population.
ACKNOWLEDGMENTS
We would like to thank Dr. Dong-Ho Shin for helpful statistical advice.
This work was supported by the Technology Innovation Program (20002169, Development and Dissemination on National Standard Reference Data) funded By the Ministry of Trade, Industry & Energy (MOTIE, Korea).
REFERENCES
1. Nishimura RA, Otto CM, Bonow RO, et al. 2014 AHA/ACC guideline for the management of patients with valvular heart disease: a report of the American College of Cardiology/American Heart Association Task Force on Practice Guidelines. J Am Coll Cardiol 2014;63:e57-185.
PUBMED | CROSSREF
2. Boon NA, Bloomfield P. The medical management of valvar heart disease. Heart 2002;87:395-400.
PUBMED | CROSSREF
3. Baumgartner H, Falk V, Bax JJ, et al. 2017 ESC/EACTS Guidelines for the management of valvular heart disease. Eur Heart J 2017;38:2739-91.
PUBMED | CROSSREF
4. Lip GY, Nieuwlaat R, Pisters R, Lane DA, Crijns HJ. Refining clinical risk stratification for predicting stroke and thromboembolism in atrial fibrillation using a novel risk factor-based approach: the euro heart survey on atrial fibrillation. Chest 2010;137:263-72.
PUBMED | CROSSREF
5. Levey AS, Coresh J, Balk E, et al. National Kidney Foundation practice guidelines for chronic kidney disease: evaluation, classification, and stratification. Ann Intern Med 2003;139:137-47.
PUBMED | CROSSREF
6. Lang RM, Badano LP, Mor-Avi V, et al. Recommendations for cardiac chamber quantification by echocardiography in adults: an update from the American Society of Echocardiography and the European Association of Cardiovascular Imaging. J Am Soc Echocardiogr 2015;28:1-39.e14.
PUBMED | CROSSREF
7. Sanfilippo AJ, Abascal VM, Sheehan M, et al. Atrial enlargement as a consequence of atrial fibrillation. A prospective echocardiographic study. Circulation 1990;82:792-7.
PUBMED | CROSSREF
8. Rudski LG, Lai WW, Afilalo J, et al. Guidelines for the echocardiographic assessment of the right heart in adults: a report from the American Society of Echocardiography endorsed by the European Association of Echocardiography, a registered branch of the European Society of Cardiology, and the Canadian Society of Echocardiography. J Am Soc Echocardiogr 2010;23:685-713.
PUBMED | CROSSREF
9. Hatle L, Angelsen B, Tromsdal A. Noninvasive assessment of atrioventricular pressure half-time by Doppler ultrasound. Circulation 1979;60:1096-104.
PUBMED | CROSSREF
10. Nunes MC, Hung J, Barbosa MM, et al. Impact of net atrioventricular compliance on clinical outcome in mitral stenosis. Circ Cardiovasc Imaging 2013;6:1001-8.
PUBMED | CROSSREF
11. Flachskampf FA, Weyman AE, Guerrero JL, Thomas JD. Calculation of atrioventricular compliance from the mitral flow profile: analytic and in vitro study. J Am Coll Cardiol 1992;19:998-1004.
PUBMED | CROSSREF
12. Zoghbi WA, Adams D, Bonow RO, et al. Recommendations for noninvasive evaluation of native valvular regurgitation: a report from the American Society of Echocardiography developed in collaboration with the Society for Cardiovascular Magnetic Resonance. J Am Soc Echocardiogr 2017;30:303-71.
PUBMED | CROSSREF
13. DeLong ER, DeLong DM, Clarke-Pearson DL. Comparing the areas under two or more correlated receiver operating characteristic curves: a nonparametric approach. Biometrics 1988;44:837-45.
PUBMED | CROSSREF
14. Heidbuchel H, Verhamme P, Alings M, et al. Updated European Heart Rhythm Association practical guide on the use of non-vitamin-K antagonist anticoagulants in patients with non-valvular atrial fibrillation:
executive summary. Eur Heart J 2017;38:2137-49.
PUBMED
15. Takemoto Y, Barnes ME, Seward JB, et al. Usefulness of left atrial volume in predicting first congestive heart failure in patients ≥ 65 years of age with well-preserved left ventricular systolic function. Am J Cardiol 2005;96:832-6.
PUBMED | CROSSREF
16. Pritchett AM, Mahoney DW, Jacobsen SJ, Rodeheffer RJ, Karon BL, Redfield MM. Diastolic dysfunction and left atrial volume: a population-based study. J Am Coll Cardiol 2005;45:87-92.
PUBMED | CROSSREF
17. Tamura H, Watanabe T, Nishiyama S, et al. Increased left atrial volume index predicts a poor prognosis in patients with heart failure. J Card Fail 2011;17:210-6.
PUBMED | CROSSREF
18. Yang WI, Shim CY, Kim YJ, et al. Left atrial volume index: a predictor of adverse outcome in patients with hypertrophic cardiomyopathy. J Am Soc Echocardiogr 2009;22:1338-43.
PUBMED | CROSSREF
19. Tani T, Yagi T, Kitai T, et al. Left atrial volume predicts adverse cardiac and cerebrovascular events in patients with hypertrophic cardiomyopathy. Cardiovasc Ultrasound 2011;9:34.
PUBMED | CROSSREF
20. Møller JE, Hillis GS, Oh JK, et al. Left atrial volume: a powerful predictor of survival after acute myocardial infarction. Circulation 2003;107:2207-12.
PUBMED | CROSSREF
21. Beinart R, Boyko V, Schwammenthal E, et al. Long-term prognostic significance of left atrial volume in acute myocardial infarction. J Am Coll Cardiol 2004;44:327-34.
PUBMED | CROSSREF
22. Messika-Zeitoun D, Bellamy M, Avierinos JF, et al. Left atrial remodelling in mitral regurgitation- -methodologic approach, physiological determinants, and outcome implications: a prospective quantitative Doppler-echocardiographic and electron beam-computed tomographic study. Eur Heart J 2007;28:1773-81.
PUBMED | CROSSREF
23. Le Tourneau T, Messika-Zeitoun D, Russo A, et al. Impact of left atrial volume on clinical outcome in organic mitral regurgitation. J Am Coll Cardiol 2010;56:570-8.
PUBMED | CROSSREF
24. Ancona R, Comenale Pinto S, Caso P, et al. Two-dimensional atrial systolic strain imaging predicts atrial fibrillation at 4-year follow-up in asymptomatic rheumatic mitral stenosis. J Am Soc Echocardiogr 2013;26:270-7.
PUBMED | CROSSREF
25. Casaclang-Verzosa G, Gersh BJ, Tsang TS. Structural and functional remodeling of the left atrium: clinical and therapeutic implications for atrial fibrillation. J Am Coll Cardiol 2008;51:1-11.
PUBMED | CROSSREF
26. Cho IJ, Hong GR, Lee SH, et al. Differences in characteristics, left atrial reverse remodeling, and functional outcomes after mitral valve replacement in patients with low-gradient very severe mitral stenosis. J Am Soc Echocardiogr 2016;29:759-67.
PUBMED | CROSSREF
27. Nagueh SF, Smiseth OA, Appleton CP, et al. Recommendations for the evaluation of left ventricular diastolic function by echocardiography: an update from the American Society of Echocardiography and the European Association of Cardiovascular Imaging. J Am Soc Echocardiogr 2016;29:277-314.
PUBMED | CROSSREF