Copyright © 2018 The Korean Society for Bone and Mineral Research
This is an Open Access article distributed under the terms of the Creative Commons Attribution Non-Commercial Li- cense (http://creativecommons.org/licenses/by-nc/4.0/) which permits unrestricted non-commercial use, distribu- tion, and reproduction in any medium, provided the original work is properly cited.
Is Sarcopenia a Potential Risk Factor for Distal Radius Fracture? Analysis Using Propensity Score Matching
Jun-Ku Lee1, Byung-Ho Yoon1, Chi Hoon Oh2, Jung Gon Kim1, Soo-Hong Han2
1Department of Orthopaedic Surgery, Seoul Paik Hospital, Inje University College of Medicine, Seoul;
2Department of Orthopaedic Surgery, Bundang CHA Medical Center, CHA University School of Medicine, Seongnam, Korea
Background: Cases of low-energy-induced distal radius fracture (DRF) are increasing.
Sarcopenia is considered to be an independent risk factor for fragility fractures. We com- pared body appendicular lean muscle mass (ALM) and bone mineral density (BMD) in patients with DRF and a comparable control population. This study aimed to investigate the correlation between skeletal muscle mass and DRF. Methods: We performed a retro- spective review of patients diagnosed with fragility DRF. The DRF group included 87 pa- tients treated at our institute. The control group comprised data for 87 individuals in the general population from among 2,124 selected using nearest-neighbor propensity scor- ing, based on age, weight, height, and body mass index. All medical conditions and past history were also compared between the two groups. Results: The relative overall ALM, combining arm and leg lean body mass divided by height squared, was not significantly different (DRF group, 6.093 kg/m2; controls, 5.945 kg/m2). T-score, a parameter of BMD, was significantly different between groups (DRF, -2.42; controls, -2.05). The proportion of patients with osteoporosis was significantly different (DRF, 44 [50.6%] vs. control, 29 [33.3%], respectively). Conclusions: Patients with DRF did not have significantly lower average lean body mass. BMD was significantly lower in patients with DRF than in con- trols.
Key Words: Osteoporosis, Osteoporotic fractures, Radius fractures, Risk factors, Sarcopenia
INTRODUCTION
Distal radius fracture (DRF) accounts for approximately 16% of all fractures treat- ed by orthopedic surgeons.[1] The occurrence of DRF peaks in two age groups: 1) a young, predominantly male population with high-energy; and 2) an elderly, predominantly female population.[2] These two different peak distributions rep- resent distinctive injuries in terms of mechanism of injury, predominate age, amount of energy associated with the fracture, and fracture characteristics. As the life span of the general population increases, the incidence of DRFs in the second group of older, female patients is increasing. Risk factors for DRF in elderly patients have been studied. Osteoporosis is a recognized leading cause of fractures; female sex, ethnicity, heredity, previous fracture history, and early menopause have also been found to be risk factors for this injury.[1,3,4]
Corresponding author Soo-Hong Han
Department of Orthopaedic Surgery, Bundang CHA Medical Center, CHA University School of Medicine, 59 Yatap-ro, Bundang-gu, Seongnam 13496, Korea
Tel: +82-31-780-5273 Fax: +82-31-708-3578 E-mail: [email protected] Received: March 24, 2018 Revised: April 25, 2018 Accepted: April 27, 2018
No potential conflict of interest relevant to this article was reported.
Original Article
pISSN 2287-6375 eISSN 2287-7029
100
http://e-jbm.org/ https://doi.org/10.11005/jbm.2018.25.2.99Sarcopenia, the degenerative decrease of skeletal mus- cle mass (0.5%-1% loss per year after the age of 50) has been investigated as a new risk factor for fracture.[5-8] Re- gardless of bone density, sarcopenia appears to be an in- dependent risk factor for fragility fractures leading to a condition known as sarco-osteoporosis.[7] With respect to DRF, Roh et al.[6] reported a higher prevalence of sarcope- nia in patients with DRF compared to age- and sex-matched controls.
Dual energy X-ray absorptiometry (DXA) has been em- ployed as a measurement tool for bone mineral density (BMD) in the diagnosis of osteoporosis. This useful tool is currently expanding from solely evaluating bone density to measuring other components of the musculoskeletal system, by separating body mass into bone mineral, fat, and lean body mass (fat-free soft tissue).[9,10] In particu- lar, DXA is useful for detecting appendicular muscle (arm and leg) mass surrounding well-recognized bone. There- fore, researchers employed the appendicular lean mass (ALM), the sum of the lean soft tissue masses of the arms and legs, as a sarcopenia measurement tool.[10] Further- more, as an index of relative muscle mass, ALM divided by the height squared (ALM/ht2) was proposed.
Using DXA measurements, we evaluated body appen- dicular muscle mass of the upper and lower extremity and BMD between patients with DRF at a single institute and compared them to a control population acquired from the Korea Centers for Disease Control and Prevention (KCDC).
[11]
Authors predicted patients of DRF presented lower mus- cle mass as well as bone density compared with matched normal population. And this study aimed to investigate the correlation between appendicular muscle mass and DRF.
METHODS
We carried out a retrospective review of patients diag- nosed with fragility DRFs under the official approval of the Institutional Review Board (CHAMC 2017-11-003). Between January 2015 and December 2017, we identified 131 pa- tients who underwent ALM and BMD assessment under informed consent with consecutive method. The DRFs were properly treated with conservative or operative manage- ment based on current treatment principles. To isolate the role of sarcopenia in DRF, we carried out a study targeting
fragile fracture.[12] Inclusion criteria were: female sex, age over 50-years, and fracture from low-energy trauma in- cluding a fall from a standing height or low height of less than 1 m.[13] Medical conditions affecting sarcopenia were questioned including hypertension, dyslipidemia, stroke, angina or even myocardial infarction, rheumatoid arthritis, asthma or chronic obstructive pulmonary disease, diabe- tes, thyroid disease, renal failure, hepatic failure, cancer di- agnosis, and current smoking condition.[14-16]
BMD was measured at both the lumbar spine and one proximal femoral area (Lunar Prodigy Advance; GE Lunar, Madison, WI, USA) and osteoporosis was diagnosed based on a T-score less than 2.5 standard deviation (SD) below the mean, according to World Health Organization criteria.
[17] ALM was measured for the upper and lower extremity separately. The ALM was divided by the height squared (ALM/ht2) as relative value for comparison. Instead Europe- an cuff off value of 2 standard deviations from the mean, with different values for men (<7.26 kg/m2) and women (<5.45 kg/m2), adjusted criteria considering Asian low muscle volume were employed to diagnose sarcopenia (male <7.00 kg/m2; female <5.40 kg/m2).[18,19] Patients with incomplete or absent assessments (i.e., femoral BMD measurement in a patient with a history of bilateral total hip replacement) were excluded. Finally, a total of 87 pa- tients were selected for the DRF group.
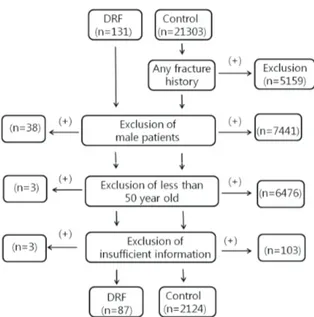
For the control group, we utilized general population data from the Korea National Health and Nutrition Exami- nation Surveys (KNHANES) for 2008 to 2011.[11] During this period, KNHANES, led by the KCDC, measured ALM and BMD under their own IRB approval, and some of the data has been released for medical research. ALM and BMD measurements were based on DXA (QDR 4500A; Hologic Inc., Bedford, MA, USA). With the data from this study, we have access to information on the enrolled population in- cluding age, sex, height, weight, medical history, past his- tory of any fracture, ALM, and BMD. Between 2008 and 2011, we identified data of 21,303. Individuals with any fracture history, male gender, and age less than 50-years- old were then excluded. Patients of insufficient informa- tion were excluded finally. Overall 2,243 individuals were identified before propensity score matching with the DRF group (Fig. 1).
A nearest-neighbor propensity score matching was em- ployed to create a comparable control group. The match-
ing variables of age, weight, height, and body mass index (BMI) were inserted for a propensity score matching algo- rithm between the two groups; we obtained the same num- ber of individuals for the DRF and control group groups (Fig. 2). Overall, 87 patients with DRF and 87 controls were enrolled before statistical comparison. First we compared demographic factors between patient and control group in unmatched comparison as well as matched comparison (Table 1). Based on the Asian sarcopenia guideline and di- agnosis of osteoporosis criteria, determined from lowest T- score, the proportion of patients with sarcopenia and os- teoporosis were evaluated.
1. Statistical analysis
Propensity score matching was used to select the con- trol group. The Pearson χ2 test or Fisher’s exact test for cat- egorical variables and the Student t-test for continuous variables were used for comparison between groups. Be- fore the Student t-test was performed, the normality test (Shapiro-Wilk test) was applied to continuous variables. A P-value less than 0.05 was considered statistically signifi- cant. The statistical evaluation was conducted using soft- ware R (version 3.1.0; The R Foundation for Statistical Com- puting, Vienna, Austria).
RESULTS
Table 2 present our study outcome, unmatched and mat- ched comparison of ALM and BMD.
1. Matched comparison: BMD
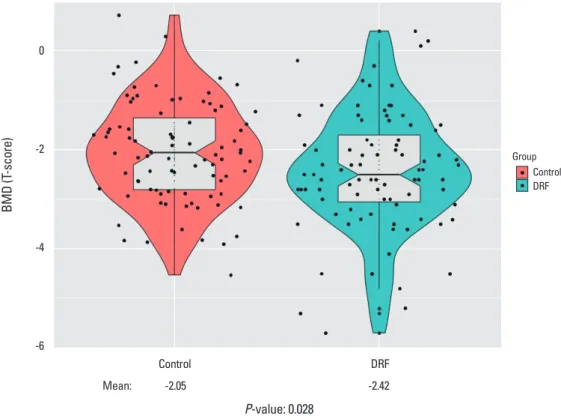
DRF presented lower BMD compared with control groups indicating similar outcome prior to propensity score match- ing. Mean L-spine T-score of DRF was -2.14 compared with control of -1.77 (P=0.048). Femoral T-score of DRF also pre- sented lower score through statistical insignificance (DRF, -1.83; control, -1.60; P=0.147). In final T-score comparison, DRF present lower score compared with control group (DRF, -2.42; control, -2.05; P=0.028) (Fig. 3). The proportion of patients with osteoporosis was different between the DRF and control groups with statistical significance (DRF, 44 [50.6%] vs. control, 29 [33.3%], respectively).
2. Matched comparison: ALM
The mean lean soft tissue mass of the arm was 3.811 kg Fig. 1. Flow sheet of patient selection process for the distal radius
fracture (DRF) and control groups.
17
FIGURE LEGENDS
Fig. 1. Flow sheet of patient selection process for the distal radius fracture (DRF) and control groups.
Fig. 2. Statistics of nearest neighbor propensity score matching, age, height, weight, and body mass index (BMI). (A) Distribution of propensity scores. (B) Change of absolute standardized differences.
0 0.05 0.10 0.15 Propensity score
Unmatched treatment units Matched treatment units
Matched control units Unmatched control units
0.3 0.2 0.1
Absolute standardized diff in means 0
All data Matched data
Distance Height
BMI
Age
Weight Weight
Age
BMIHeight Distance
A B
102
http://e-jbm.org/ https://doi.org/10.11005/jbm.2018.25.2.99 Table 1. Descriptive statistics by 'group'Variables Unmatched cohort Propensity-matched cohort
Control (n=2,124) DRF (n=87) P-value Control (n=87) DRF (n=87) P-value
Age (year) 63.1±9.6 63.8±9.4 0.500 62.5±9.4 63.8±9.4 0.355
Height (m) 1.53±0.060 1.55±0.057 0.006 1.55±0.060 1.55±0.057 0.748
Weight (kg) 57.0±8.6 56.8±8.2 0.822 56.6±7.1 56.8±8.2 0.898
BMI 24.2±3.2 23.6±3.2 0.078 23.5±2.8 23.6±3.2 0.764
Medical history
Hypertension 0.774 0.635
- 0 1,363 (64.2%) 54 (62.1%) 58 (66.7%) 54 (62.1%)
- 1 761 (35.8%) 33 (37.9%) 29 (33.3%) 33 (37.9%)
Dyslipidemia 0.156 0.455
- 0 1,827 (86.0%) 80 (92.0%) 76 (87.4%) 80 (92.0%)
- 1 297 (14.0%) 7 (8.0%) 11 (12.6%) 7 (8.0%)
Stroke 0.234 0.213
- 0 2,062 (97.1%) 82 (94.3%) 86 (98.9%) 82 (94.3%)
- 1 62 (2.9%) 5 (5.7%) 1 (1.1%) 5 (5.7%)
Angina or myocardial infarction 0.261 0.213
- 0 2,060 (97.0%) 82 (94.3%) 86 (98.9%) 82 (94.3%)
- 1 64 (3.0%) 5 (5.7%) 1 (1.1%) 5 (5.7%)
Rheumatoid arthritis 0.098 1.000
- 0 1,997 (94.0%) 86 (98.9%) 85 (97.7%) 86 (98.9%)
- 1 127 (6.0%) 1 (1.1%) 2 (2.3%) 1 (1.1%)
Asthma or COPD 0.861 1.000
- 0 1,979 (93.2%) 82 (94.3%) 82 (94.3%) 82 (94.3%)
- 1 145 (6.8%) 5 (5.7%) 5 (5.7%) 5 (5.7%)
Diabetes 0.592 1.000
- 0 1,850 (87.1%) 78 (89.7%) 79 (90.8%) 78 (89.7%)
- 1 274 (12.9%) 9 (10.3%) 8 (9.2%) 9 (10.3%)
Thyroid disease 0.520 0.533
- 0 2,001 (94.2%) 80 (92.0%) 83 (95.4%) 80 (92.0%)
- 1 123 (5.8%) 7 (8.0%) 4 (4.6%) 7 (8.0%)
Renal failure 1.000 1.000
- 0 2,109 (99.3%) 86 (98.9%) 85 (97.7%) 86 (98.9%)
- 1 15 (0.7%) 1 (1.1%) 2 (2.3%) 1 (1.1%)
Liver cirrhosis 0.579 1.000
- 0 2,119 (99.8%) 86 (98.9%) 87 (100.0%) 86 (98.9%)
- 1 5 (0.2%) 1 (1.1%) 0 (0.0%) 1 (1.1%)
Cancer 0.000 0.129
- 0 2,116 (99.6%) 83 (95.4%) 87 (100.0%) 83 (95.4%)
- 1 8 (0.4%) 4 (4.6%) 0 (0.0%) 4 (4.6%)
Current smoking 0.485 1.000
- 0 2,120 (99.8%) 86 (98.9%) 85 (97.7%) 86 (98.9%)
- 1 4 (0.2%) 1 (1.1%) 2 (2.3%) 1 (1.1%)
The data is presented as mean±standard deviation or number (%).
DRF, distal radius fracture; BMI, body mass index; COPD, chronic obstructive pulmonary disease.
https://doi.org/10.11005/jbm.2018.25.2.99 http://e-jbm.org/
103
Table 2. Comparison of bone mineral density and body composite
Variables Unmatched cohort Propensity-matched cohort
Control (n=2,124) DRF (n=87) P-value Control (n=87) DRF (n=87) P-value
T-score
Spine -1.65±1.30 -2.14±1.31 0.001 -1.77±1.15 -2.14±1.31 0.048
Femur -1.59±1.11 -1.83±1.04 0.051 -1.60±1.01 -1.83±1.04 0.147
Final scorea) -1.97±1.14 -2.42±1.20 0.000 -2.05±1.02 -2.42±1.20 0.028
Osteoporosis 0.000 0.004
None 695 (32.7%) 8 (9.2%) 24 (27.6%) 8 (9.2%)
Osteopenia 721 (33.9%) 35 (40.2%) 34 (39.1%) 35 (40.2%)
Osteoporosis 708 (33.3%) 44 (50.6%) 29 (33.3%) 44 (50.6%)
ALM
Arm (kg) 3.331±0.530 3.811±0.829 0.000 3.370±0.534 3.811±0.829 0.000
Leg (kg) 10.860±1.586 10.859±1.627 0.995 10.984±1.569 10.859±1.627 0.606
ALM/Height2 6.028±0.677 6.093±0.764 0.384 5.945±0.719 6.093±0.764 0.189
Sarcopenia 1.000 0.711
None 1,716 (80.8%) 70 (80.5%) 67 (77.0%) 70 (80.5%)
Sarcopenia 408 (19.2%) 17 (19.5%) 20 (23.0%) 17 (19.5%)
The data is presented as mean±standard deviation or number (%).
a)Final score is lower score of patient between spine and femoral score.
DRF, distal radius fracture; ALM, appendicular lean muscle mass.
Fig. 3. Comparison of bone mineral density (BMD), with significant difference (P=0.028). DRF, distal radius fracture.Fig. 3. Comparison of bone mineral density (BMD), with significant difference (P= 0.028).
DRF, distal radius fracture.
0
-2
-4
-6
BMD (T-score)
Control DRF
Mean: -2.05 -2.42
P-value: 0.028
Fig. 3. Comparison of bone mineral density (BMD), with significant difference (P= 0.028).
DRF, distal radius fracture.
Group Control DRF
and 3.370 kg in the DRF and control groups, respectively, with significant difference (P=0.000). The mean lean body mass of the leg was 10.859 kg and 10.984 kg in the DRF
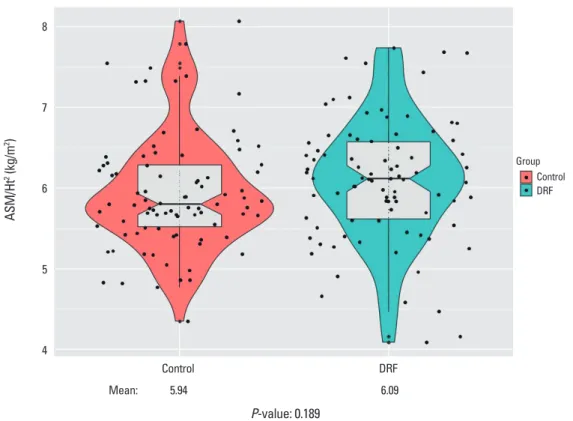
and control groups, respectively, without significant differ- ence (P=0.606). The relative overall ALM was not signifi- cantly different between groups (DRF, 6.093 kg/m2; control,
104
http://e-jbm.org/ https://doi.org/10.11005/jbm.2018.25.2.99 Fig. 4. Comparison of appendicular skeletal mass (ASM) divided by height squared, without significance (P=0.189). Ht, height; DRF, distal radius fracture.20
Fig. 4. Comparison of appendicular skeletal mass (ASM) divided by height squared, without significance (P= 0.189). Ht, height; DRF, distal radius fracture.
8
7
6
5
4 ASM/Ht2 (kg/m2)
Control DRF
Mean: 5.94 6.09
P-value: 0.189
19
Fig. 3. Comparison of bone mineral density (BMD), with significant difference (P= 0.028).
DRF, distal radius fracture.
Group Control DRF
5.945 kg/m2; P=0.189) (Fig. 4). Seventeen out of 87 pati- ents (19.5%) in the DRF group were diagnosed with sarco- penia based on the Asian diagnostic criteria, compared with 20 individuals (23.0%) in the control group; this differ- ence was not significant by the χ2 test (P=0.711).
DISCUSSION
In our study comparing DRF patients with matched con- trol group through propensity score matching, DRF patients presented significant lower T-score (DRF, -2.42; control, -2.05;
P=0.028) and subsequent more prevalence of osteoporo- sis (DRF, 44 [50.6%] vs. control, 29 [33.3%]; P=0.004). How- ever, there was no significant difference in muscle mass comparison between the two groups (DRF, 6.093 kg/m2; control, 5.945 kg/m2; P=0.189). Finally, overall sarcopenia diagnostic rate also did not have significant difference (DRF, 17 [19.5%] vs. control, 20 [23.0%]; P=0.711).
The concept of skeletal muscle mass reduction with age has recently drawn attention and growing studies were conducted in diverse area. Although the aging process is a definite cause of sarcopenia, other reasons for sarcopenia
have been reported, including reduced mobility, inade- quate nutrition, neurodegenerative diseases, malignancy, chronic renal and endocrine disorders (mainly diabetes, abnormal thyroid function and low levels of vitamin D, sex steroids, growth hormone and insulin-like growth factor-1), cardiometabolic disease, and nutritional deficiency.[14-16]
Our study attempted to identify those confounding factors.
There are several tools available for the measurement of muscle mass, including bioelectrical impedance analysis, DXA, magnetic resonance imaging, and computed tomog- raphy.[20-22] DXA is relatively inexpensive and easy to ac- cess with low radiation exposure. Based on these merits, studies on body mass examination using DXA have been reported.[7,9,21]
We predicted elderly person with greater upper extremi- ty muscle mass may have a reduced risk of DRF, since great- er arm muscles could prevent of fall and even might pro- tect the distal radius from fracture. Roh et al.[6] reported an increased prevalence of sarcopenia in patients with DRF compared to variable matched controls. However, our study presented opposite result with statistical significance (P=
0.000), the average arm lean body mass of patients with
DRF (3.811 kg) was higher than controls (3.370 kg). We did not explain the reason until now. We suspecting it was emer- ging from different measurement tools.
Landi et al.[23] reported a 3-times greater chance of fall injuries in patients with sarcopenia. Decreased leg skeletal mass, part of ALM, correlates with less mobility, slow gait, and compromised body balance. Yoo et al.[24] conducted a case-control study comparing patients with hip fracture versus non-fracture and demonstrated a higher prevalence of sarcopenia in patients with hip fractures compared with controls. Considering above reports, we assumed people who had less leg muscle mass can have a change of more fall injuries in daily life increasing risk of DRF. In our study, there was no significant difference between the two groups (DRF, 6.093 kg/m2; control, 5.945 kg/m2; P=0.189). Finally, overall ALM and ALM/m2 showed parallel results with up- per and lower arm muscle mass consequence.
There was effort of standardization equations in BMD as- sessment from different DXA since BMD from different DXAs presented substantially different value.[25,26] However, a few studies were conducted about commercial difference of DXA in sarcopenia.[27,28] Until now, standardization between two dominant commercial was not built. If differ- ent measurement DXA tools provide considerable different figures, diagnostic value of sarcopenia should reflect com- mercial factor.
Osteoporosis is a systemic skeletal disease of low BMD and microarchitectural deterioration with a subsequent in- crease in bone fragility and susceptibility to fracture.[29]
There is no doubt that osteoporosis, a primary cause of fra- gility fractures, led to osteoporotic fracture.[1,3,4] Further- more, osteoporotic fractures are associated with high mor- bidity and mortality.[30] The economic cost of osteoporo- sis related fracture management is rising, and this trend is likely to continue.[31] DRF is one representative osteopo- rosis related fracture, in addition to fractures of the spine, hip, and humerus. In our study, we confirmed again that BMD is associated with DRF.
There is limitation of our study. BMD and body compos- ite measurement were carried out at a different institution with different instruments, Hologic Inc. and GE Lunar Inc.
(Madison, WI, USA). In addition, the ALM is representative of a quantitative aspect of muscle mass. To diagnose sarco- penia, muscle strength and physical performance should be considered as well as appendicular muscle mass, but
we did not address this in our study.[14]
Nevertheless, authors investigated the relationship be- tween DRF and sarcopenia, in which previous studies were rarely carried out. Besides authors compared senile and fragile DRF patients with relatively large number. As com- parison group, unaffected patients were chosen with age, weight, height, and BMI matching process from 2,124 indi- viduals.
In contrast to the pre-study hypothesis, we did not iden- tify a correlation between sarcopenia and DRF. Further com- parative studies with a greater number of patients with DRF are needed. Currently, we recognize BMD as having a stron- ger correlation with DRF.
CONCLUSION
Patients with DRF did not have significantly lower lean body mass; instead, BMD was significantly lower in patients with DRF than in controls.
ACKNOWLEDGMENT
Database of the Korea National Health and Nutrition Ex- amination Surveys was provided by the Korea Centers for Disease Control and Prevention. The authors would like to thank the Korea Centers for Disease Control and Prevention.
REFERENCES
1. Ruch DS, McQueen MM. Distal radius and ulna fractures.
In: Bucholz RW, Court-Brown CM, Heckman JD, et al., edi- tors. Rockwood and Green’s fractures in adults. 7th ed. Phil- adelphia, PA: Lippincott Williams and Wilkins; 2010. p.829- 77.
2. Wolfe SW. Distal radius fractures. In: Wolfe SW, Hotchkiss RNP, W C, Kozin SH, et al., editors. Green’s operative hand surgery. 7th ed. Philadelphia, PA: Elsevier; 2017. p.576.
3. Rozental TD, Makhni EC, Day CS, et al. Improving evalua- tion and treatment for osteoporosis following distal radial fractures. A prospective randomized intervention. J Bone Joint Surg Am 2008;90:953-61.
4. Xu W, Ni C, Yu R, et al. Risk factors for distal radius fracture in postmenopausal women. Orthopade 2017;46:447-50.
5. Phillips SM. Nutritional supplements in support of resis- tance exercise to counter age-related sarcopenia. Adv Nutr
106
http://e-jbm.org/ https://doi.org/10.11005/jbm.2018.25.2.992015;6:452-60.
6. Roh YH, Koh YD, Noh JH, et al. Evaluation of sarcopenia in patients with distal radius fractures. Arch Osteoporos 2017;
12:5.
7. Kelly TL, Wilson KE, Heymsfield SB. Dual energy X-Ray ab- sorptiometry body composition reference values from NHANES. PLoS One 2009;4:e7038.
8. Yoon BH, Lee JK, Choi DS, et al. Prevalence and associated risk factors of sarcopenia in female patients with osteopo- rotic fracture. J Bone Metab 2018;25:59-62.
9. Hind K, Oldroyd B. In-vivo precision of the GE Lunar iDXA densitometer for the measurement of appendicular and trunk lean and fat mass. Eur J Clin Nutr 2013;67:1331-3.
10. Heymsfield SB, Smith R, Aulet M, et al. Appendicular skel- etal muscle mass: measurement by dual-photon absorpti- ometry. Am J Clin Nutr 1990;52:214-8.
11. Kweon S, Kim Y, Jang MJ, et al. Data resource profile: the Korea National Health and Nutrition Examination Survey (KNHANES). Int J Epidemiol 2014;43:69-77.
12. Sanders KM, Pasco JA, Ugoni AM, et al. The exclusion of high trauma fractures may underestimate the prevalence of bone fragility fractures in the community: the Geelong Osteoporosis Study. J Bone Miner Res 1998;13:1337-42.
13. Salminen S, Pihlajamäki H, Avikainen V, et al. Specific fea- tures associated with femoral shaft fractures caused by low-energy trauma. J Trauma 1997;43:117-22.
14. Cruz-Jentoft AJ, Baeyens JP, Bauer JM, et al. Sarcopenia:
European consensus on definition and diagnosis: Report of the European Working Group on Sarcopenia in Older People. Age Ageing 2010;39:412-23.
15. Serra Rexach JA. Clinical consequences of sarcopenia. Nutr Hosp 2006;21 Suppl 3:46-50.
16. Hirschfeld HP, Kinsella R, Duque G. Osteosarcopenia: where bone, muscle, and fat collide. Osteoporos Int 2017;28:2781- 90.
17. Kanis JA, Melton LJ 3rd, Christiansen C, et al. The diagnosis of osteoporosis. J Bone Miner Res 1994;9:1137-41.
18. Janssen I, Heymsfield SB, Ross R. Low relative skeletal mus- cle mass (sarcopenia) in older persons is associated with functional impairment and physical disability. J Am Geri- atr Soc 2002;50:889-96.
19. Chen LK, Liu LK, Woo J, et al. Sarcopenia in Asia: consen- sus report of the Asian Working Group for Sarcopenia. J Am Med Dir Assoc 2014;15:95-101.
20. Lang T, Cauley JA, Tylavsky F, et al. Computed tomograph- ic measurements of thigh muscle cross-sectional area and attenuation coefficient predict hip fracture: the health, aging, and body composition study. J Bone Miner Res 2010;
25:513-9.
21. Malafarina V, Uriz-Otano F, Iniesta R, et al. Sarcopenia in the elderly: diagnosis, physiopathology and treatment.
Maturitas 2012;71:109-14.
22. Bokshan SL, DePasse JM, Daniels AH. Sarcopenia in ortho- pedic surgery. Orthopedics 2016;39:e295-300.
23. Landi F, Calvani R, Ortolani E, et al. The association between sarcopenia and functional outcomes among older patients with hip fracture undergoing in-hospital rehabilitation.
Osteoporos Int 2017;28:1569-76.
24. Yoo JI, Ha YC, Kwon HB, et al. High prevalence of sarcope- nia in Korean patients after hip fracture: a case-control study. J Korean Med Sci 2016;31:1479-84.
25. Genant HK. Universal standardization for dual X-ray ab- sorptiometry: patient and phantom cross-calibration re- sults. J Bone Miner Res 1995;10:997-8.
26. Fan B, Lu Y, Genant H, et al. Does standardized BMD still remove differences between Hologic and GE-Lunar state- of-the-art DXA systems? Osteoporos Int 2010;21:1227-36.
27. Shepherd JA, Fan B, Lu Y, et al. A multinational study to develop universal standardization of whole-body bone density and composition using GE Healthcare Lunar and Hologic DXA systems. J Bone Miner Res 2012;27:2208-16.
28. Xu W, Chafi H, Guo B, et al. Quantitative comparison of 2 dual-energy X-ray absorptiometry systems in assessing body composition and bone mineral measurements. J Clin Densitom 2016;19:298-304.
29. Johnell O, Kanis J. Epidemiology of osteoporotic fractures.
Osteoporos Int 2005;16 Suppl 2:S3-7.
30. Leboime A, Confavreux CB, Mehsen N, et al. Osteoporosis and mortality. Joint Bone Spine 2010;77 Suppl 2:S107-12.
31. Cummings SR, Melton LJ. Epidemiology and outcomes of osteoporotic fractures. Lancet 2002;359:1761-7.