ABSTRACT
Background: Presenteeism refers to the phenomenon of working while sick. Its development can be attributed to not only somatic symptoms but also underlying social agreements and workplace atmosphere. In this study, we analyzed presenteeism among workers from various industries, focusing on job-related stress with stratification on the presence of depression.
Methods: We conducted the study with data from questionnaires filled in by different
enterprises enrolled in the Federation of Korean Trade Unions. Workers' depressive symptoms were investigated using the Patient Health Questionnaire-2, while questions on job-related stress and presenteeism were derived from the short form of the Korean Occupational Stress Scale and the official Korean version of the Work-Productivity and Activity Impairment Questionnaire-General Health, respectively. Multilevel logistic analysis was conducted to determine the statistical differences derived from the differences between companies.
Results: In total, 930 participants (753 men and 177 women) from 59 enterprises participated in the research. We conducted multilevel logistic regression to determine the association between the variables and presenteeism, with stratification by the presence of depression.
Higher job demands and higher interpersonal conflict showed significantly elevated odds ratios (ORs) in univariate models and in the multivariate multilevel model. In the final model of total population, fully adjusted by general and work-related characteristics, higher job demands (OR: 3.29, 95% confidence interval [CI]: 2.08–5.21) and interpersonal conflict (OR: 1.87, 95% CI: 1.29–2.71) had significantly higher ORs—a tendency that remained in participants without depression.
Conclusions: This study reflected the factors associated with presenteeism among workers from various enterprises. The findings revealed that job-related stress was closely related to presenteeism in both the total population and in the population without depression. Thus, it emphasized interventions for managing job stress among workers to reduce presenteeism in general workers' population.
Keywords: Presenteeism; Job-related stress; Job demands; Interpersonal conflicts
Research Article
Received: Apr 10, 2019 Accepted: Sep 9, 2019
*Correspondence:
Jong-Uk Won
Department of Occupational and
Environmental Medicine, Severance Hospital, Yonsei University Health System, 50-1 Yonsei- ro, Seodaemun-gu, Seoul 03722, Korea.
E-mail: [email protected]
Copyright © 2019 Korean Society of Occupational & Environmental Medicine This is an Open Access article distributed under the terms of the Creative Commons Attribution Non-Commercial License (https://
creativecommons.org/licenses/by-nc/4.0/) which permits unrestricted non-commercial use, distribution, and reproduction in any medium, provided the original work is properly cited.
ORCID iDs Jihyun Kim
https://orcid.org/0000-0002-1825-0097 Yeong-Kwang Kim
https://orcid.org/0000-0002-0466-5726 Sung-Ho Leem
https://orcid.org/0000-0001-8534-2832 Jong-Uk Won
https://orcid.org/0000-0002-9200-3297 Abbreviations
OR: odds ratio; CI: confidence interval; PHQ- 2: Patient Health Questionnaire-2; KOSS:
Korean Occupational Stress Scale; WPAI-GH:
Work-Productivity and Activity Impairment Questionnaire-General Health; WPAI:
Work-Productivity and Activity Impairment Questionnaire; ICC: intraclass correlation coefficient; SPS: Stanford Presenteeism Scale;
HLQ: Health and Labour Questionnaire.
Jihyun Kim 1,2,3, Yeong-Kwang Kim 3, Sung-Ho Leem 4, and Jong-Uk Won 1,2,3,5,6*
1 Department of Occupational and Environmental Medicine, Severance Hospital, Yonsei University Health System, Seoul, Korea
2The Institute for Occupational Health, Yonsei University College of Medicine, Seoul, Korea
3Department of Public Health, Yonsei University Graduate School, Seoul, Korea
4Federation of Korean Trade Unions, Seoul, Korea
5Graduate School of Public Health, Yonsei University, Seoul, Korea
6Department of Preventive Medicine, Yonsei University College of Medicine, Seoul, Korea
Association between job-related
stress and experience of presenteeism
among Korean workers stratified on
the presence of depression
Funding
Datasets used for analysis in this study was produced by the research funded by the Federation of Korean Trade Unions.
Competing interests
The authors declare that they have no competing interests.
Authors contributions
Data curation: Leem SH, Kim YK; Formal analysis: Kim J; Funding acquisition: Leem SH, Won JU; Investigation: Kim J, Won JU;
Methodology: Kim J, Won JU; Resources: Kim YK; Supervision: Won JU; Validation: Kim YK;
Writing - original draft: Kim J; Writing - review
& editing: Kim J, Won JU.
BACKGROUND
Workplace attendance has been believed to be linked to higher productivity, better
performance, and workers' fitness [1,2]. Therefore, for decades, previous studies that aimed to demonstrate how to reduce workers' absence from workplaces received attention from employers, governmental officers, and politicians [3]. However, in the real world, workplace attendance might not always mean that workers are in a suitable condition to work. Their subjective symptoms owing to illnesses that have not been diagnosed can bother and hinder them from concentrating on their duties. Therefore, even when they are present at work, workers' productivity and creativity may be reduced because of their subclinical health problems [4].
The concept of presenteeism has been used to explain the phenomenon of working while sick [5]. Two different background conditions usually contribute to the development of presenteeism. One is workers' health problems including illnesses, subjective complaints, symptoms, or fatigue. According to prior studies, various health-related problems could cause presenteeism; musculoskeletal symptoms, respiratory infections, gynecological problems, and some kinds of chronic discomfort such as migraines have been reported as underlying causes of presenteeism [6,7].
However, existence of discomfort does not always result in presenteeism. If workers could take adequate rest instead of working, presenteeism would not occur. Therefore, the other condition is the underlying social agreement in society or the atmosphere in work environments which can make workers “choose” to work [8]. If sick leave was not permitted or guaranteed by law, or at least by social agreement, it would be difficult for workers to take leave from work when they are sick [9]. In addition, workers whose absence is directly related to a decrease in their income are less likely to take an appropriate amount of rest when they are sick [10]. Moreover, even though social or legal conditions are fully settled, workers may find it impossible to use their sick leaves in a rigid restricted working atmosphere [11].
Psychological factors such as job-related stress or depression can be a leading factor of presenteeism [12]. Job stress has been known to bring negative health effects such as musculoskeletal disorders [13], blood pressure elevation [14], and poor sleep quality [15]. Depression can also negatively impact workers' health [16]. For instance, even mild depression can cause decreased attention span, increased irritability, and insomnia—all of which are well-known precursors to occupational injury [17]. Moreover, clinical symptoms can also attribute to increased presenteeism by keeping workers from using sick leave [18].
Job-related stress and depression not only relate to presenteeism, but also have an association with each other [19]. Previous studies held in Korea investigated presenteeism among nurses [20], railroad workers [21], or counselors in call-centers [22]. Those studies attempted to demonstrate the relationship between presenteeism and job-related stress, depression, psychosocial well-being, or emotional labor; however, the interaction between job-related stress and other psychological factors was not fully considered. In our study, we aimed to investigate workers' presenteeism focusing on job-related stress, with stratification by the presence of depression using the data from different kinds of enterprises of different industries.
METHODS
Study participants
The analysis and investigation of this study were based on data collected by a preceding study jointly conducted by the Federation of Korean Trade Unions and Yonsei University in 2016. This study aimed to demonstrate the actual prevalence of presenteeism or absenteeism among workplaces enrolled in the federation, and understand the underlying psychosocial backgrounds of presenteeism or absenteeism. The study was based on a printed questionnaire, which contained questions for basic individual information, characteristics of enterprises, experiences of presenteeism or absenteeism, and experienced symptoms.
Covariates
The questionnaire sought to determine participants' demographic information such as gender, marital status, and age as well as health-related habits including smoking history and drinking habits. To investigate their working conditions, items on total weekly working hours, occupation, type of employment, shift work, tenure at the current workplace, and working position were surveyed by the self-reported questionnaire.
Depression
The Patient Health Questionnaire-2 (PHQ-2) was used to investigate the depressive symptoms of workers [23]. It is a brief survey that was designed for use in a busy clinical setting; it helps physicians easily evaluate patients’ depressive symptoms. The PHQ-2 seeks information about the frequency of depressed mood and anhedonia over the past 2 weeks, with scores ranging from 0 (“not at all”) to 3 (“nearly every day”). Thus, the PHQ-2 score can range from 0 to 6. According to the previous study, the PHQ-2 with this cutoff had a sensitivity of 87% and a specificity of 78% for major depressive disorder, and a sensitivity of 79% and a specificity of 86% for any depressive disorder [23]; therefore, it was regarded as the optimal PHQ-2 cutoff score [24]. Additionally, another study that tried to verify the reliability and validity of the Korean version of the PHQ-2, suggested the optimal cut-off point as 3, with 91.9% of sensitivity and 100% of specificity [25]. For this study, we set the cut-off point of the PHQ-2 score as 3, and defined “depression” as scoring 3-6 points and “no depression” as scoring 0–2 points.
Job-related stress
Although job-related stress can be evaluated according to several categories, 3 categories were investigated in this study: job demands, interpersonal conflicts, and job control. The questions for job-related stress were derived from the short form of the Korean Occupational Stress Scale (KOSS), and participants were able to choose 1 of 4 options per question.
According to the researchers who collected this data, the federation requested a shorter questionnaire as participants usually refused to answer questionnaires comprising several pages. Because of this, the KOSS questionnaire was shortened and only a few aspects of job- stress were selected. Hence, only job-demand, job control, and interpersonal conflicts were investigated, leading to a limitation of this study.
Presenteeism
Questions from the official Korean version of the Work-Productivity and Activity Impairment Questionnaire-General Health (WPAI-GH), developed, translated, and provided by Reilly Associates, were used to investigate presenteeism [26]. The Work Productivity and Activity Impairment Questionnaire (WPAI) was developed in 1993, to collect data regarding
productivity loss [26-28]. The WPAI-GH comprises 6 questions that seek to determine the extent to which general health conditions affect personal work productivity and daily life. Six questions of WPAI-GH ask the patient the number of hours missed from work or daily activities in the past 7 days [27]. Respondents are asked to indicate the extent to which their health problems have affected their work productivity on a scale of 0 to 10 that represents impairment percentages, higher numbers reflecting more impairment and loss of productivity [27]. For this study, the existence of presenteeism was indicated when participants reported that they experienced presenteeism during the last one week and rated their working impairment a score of more than 1 point. On the other hand, the absence of presenteeism was indicated when participants reported that they had not experienced loss of productivity due to health problems in the last one week and if they rated their work impairment as 0 [21,29].
Statistical analysis
In this study, all statistical analyses were performed using the SAS 9.4 program (SAS Institute, Cary, NC, USA). Demographic and workplace-related variables were compared between those 2 groups (presence of presenteeism vs. absence of presenteeism) by χ2 tests or Fisher's exact tests. For this study, participants were clustered by each enterprise; therefore, the database has a hierarchical structure necessarily. Thus, we used multilevel analysis to evaluate the differences derived from the differences among enterprises. Multilevel models can be useful tools when using data with a hierarchical or clustered structure as they allow simultaneous examination of group-level and individual level factors [30,31]. Usually, people exist within organizational structures, like families or schools. Similarly, workers exist within businesses, sectors of economy, as well as geographic regions. These hierarchical structured data can present some problems, because individuals who exist within one group tend to be more similar to each other than individuals who were randomly sampled. Also, people in the same group tend to share certain characteristics, in other words, observations based on these individuals are not fully independent. This characteristic of hierarchical data can lead to a higher probability of rejection of null hypothesis than if the data included truly independent observations; therefore, using multilevel analysis is needed for analyzing hierarchical data to get conservative results [32].
The intraclass correlation coefficient (ICC) was calculated by the ratio of the between-cluster variance to the total variance [33]. It indicates the correlation among observations within the same cluster. In the previous studies, when the ICC value was higher than 0.1 (10%), different results were found between standard logistic and hierarchical modeling [34,35]. For this study, the approximation of ICC by Snijders and Bosker was used: ICC = ICC =τ0+ πτ02�3 where τ0 is the estimated variance of the random effect of enterprises on the mean and π is the quantity 3.14159 [36,37]. In our study, calculated ICC was 17.88%, and it was higher than 10%.
Therefore, we used hierarchical modeling rather than standard logistic modeling.
For hierarchical generalized linear modeling, we used PROC GLIMMIX statement for the investigation [38]. The significance level was defined as p < 0.05. For multivariable analysis, general characteristics (gender, age, marital status, and smoking and drinking habits), work-related characteristics (permitted sick leave, tenure, job position, occupation, shift work, employment type, and weekly working hours), and job-related stress (job demands, interpersonal conflict, and job control) were used to make adjustments. Additionally, we stratified participants according to the presence of depression, and analyzed the relationship between job related stress and presenteeism.
Ethics statement
Printed questionnaires were distributed to the chiefs of labor unions in each enterprise, who recruited participants from their workplaces with their written consent. In total, 30 printed questionnaires were distributed to the 60 enterprises that had joined the Federation.
The datasets for analysis were built and provided by the Federation of Korean Trade Unions without any personally identifiable information. The protocol for the current study was reviewed and approved by the Institutional Review Board of Yonsei University Health System (IRB No. Y-2018-0007).
RESULTS
Workers from 59 enterprises finally participated in the research, after one enterprise withdrew its involvement. In total, 1,464 (81.3%) questionnaires were returned, of which those that did not have responses to questions about the experience of presenteeism, job stress, and PHQ-2 were excluded. Finally, 930 participants with 753 men and 177 women from the 59 enterprises who had consented to participate in the research were included. Considering that 1,800 questionnaires had been initially distributed, the final number of enrolled participants is relatively low (51.7%), and is a potential limitation of this study. Although they were from different industries and the final products of each enterprise differed, all the enterprises included in this study mainly dealt with manufacturing and transporting products such as wires, car seats, paints, tires, papers, and food. Most of the enterprises were located close to the cities, except for few that were in sub-urbanized areas or the countryside. The characteristics of these enterprises are described in the Supplementary Table 1.
As presented in Table 1, most participants were men (753, 80.97%), married (616, 66.24%), and in the 40–49 years age group (362, 38.92%). In total, 411 (44.19%) participants were non-smokers, 392 (42.15%) were current smokers, and 172 (18.49%) were heavy drinkers. In total, 792 (85.16%) participants were permitted to take sick leave, whether paid or unpaid.
Most had been working at their current workplace for more than 10 years (519, 55.81%);
691 (74.30%) were employees, 159 (17.10%) were managers, and 54 (5.81%) were part of the senior management. In terms of their occupation, 585 (62.90%) participants were classified as blue-collar workers. More shift workers (517, 55.59%) than non-shift workers (413, 44.41%) were included among the participants. There were 825 (88.71%) full-time or permanent workers, while there were only 105 (11.29%) temporary or part-time workers. In addition, 271 (29.14%) participants were working more than 52 hours per week.
Job-related stress factors, such as job demands, job control, and interpersonal conflict were calculated and categorized based on the median value officially recommended by the guidelines [39]. Participants comprising the upper 50% were categorized as the higher job- stress group, while the remaining were categorized as the lower job-stress group. In total, 312 (33.55%), 506 (54.41%), and 471 (50.65%) participants were categorized as groups with higher job demands, lower job control, and higher interpersonal conflict, respectively.
The PHQ-2 results revealed that 173 (18.60%) participants scored more than 2 and were categorized as “participants with depression,” while 757 (81.40%) participants were categorized as “participants without depression”. Chi-squared tests or Fisher's exact tests were used to compare the differences between those who did and did not experience presenteeism among the total number of participants, participants with depression, and
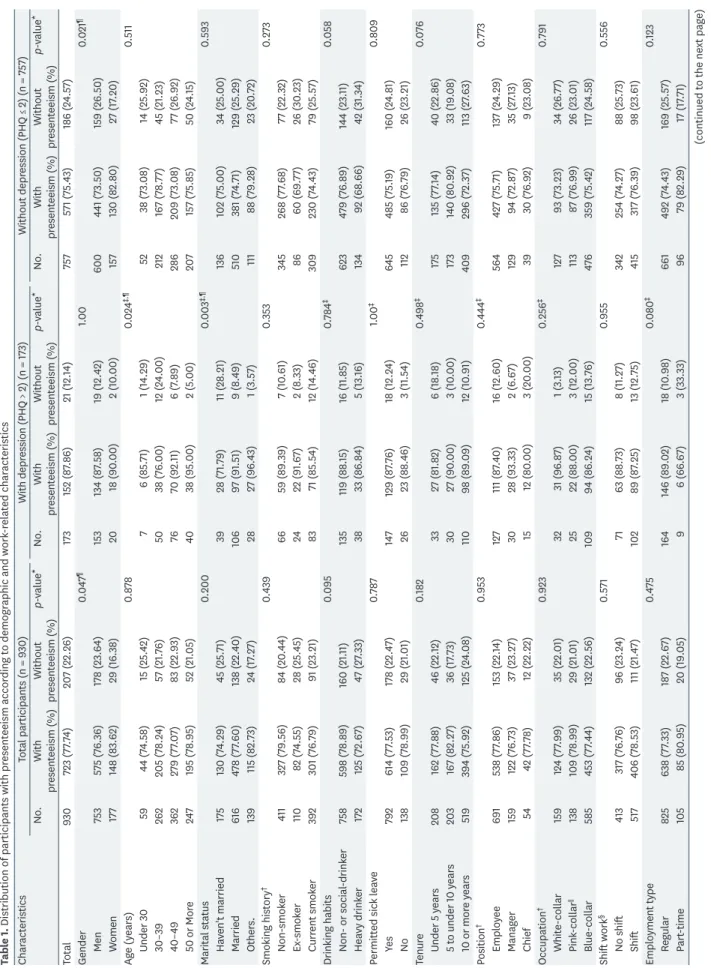
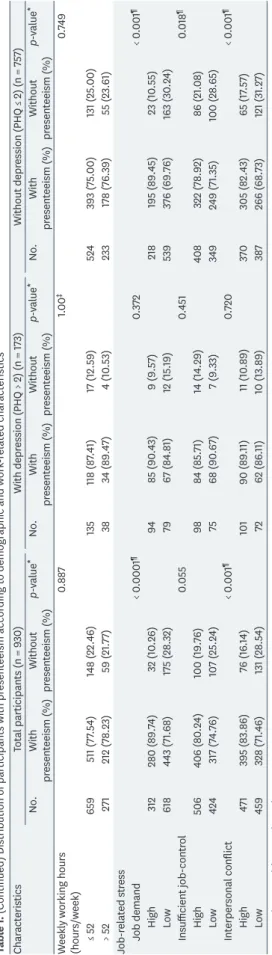
Table 1. Distribution of participants with presenteeism according to demographic and work-related characteristics CharacteristicsTotal participants (n = 930)With depression (PHQ > 2) (n = 173)Without depression (PHQ ≤ 2) (n = 757) No.With presenteeism (%)Without presenteeism (%)p-value*No.With presenteeism (%)Without presenteeism (%)p-value*No.With presenteeism (%)Without presenteeism (%)p-value* Total930723 (77.74)207 (22.26)173152 (87.86)21 (12.14)757571 (75.43)186 (24.57) Gender0.047¶1.000.021¶ Men753575 (76.36)178 (23.64)153134 (87.58)19 (12.42)600441 (73.50)159 (26.50) Women177148 (83.62)29 (16.38)2018 (90.00)2 (10.00)157130 (82.80)27 (17.20) Age (years)0.8780.024‡,¶0.511 Under 305944 (74.58)15 (25.42)76 (85.71)1 (14.29)5238 (73.08)14 (25.92) 30–39262205 (78.24)57 (21.76)5038 (76.00)12 (24.00)212167 (78.77)45 (21.23) 40–49362279 (77.07)83 (22.93)7670 (92.11)6 (7.89)286209 (73.08)77 (26.92) 50 or More247195 (78.95)52 (21.05)4038 (95.00)2 (5.00)207157 (75.85)50 (24.15) Marital status0.2000.003‡,¶0.593 Haven't married175130 (74.29)45 (25.71)3928 (71.79)11 (28.21)136102 (75.00)34 (25.00) Married616478 (77.60)138 (22.40)10697 (91.51)9 (8.49)510381 (74.71)129 (25.29) Others.139115 (82.73)24 (17.27)2827 (96.43)1 (3.57)11188 (79.28)23 (20.72) Smoking history†0.4390.3530.273 Non-smoker411327 (79.56)84 (20.44)6659 (89.39)7 (10.61)345268 (77.68)77 (22.32) Ex-smoker11082 (74.55)28 (25.45)2422 (91.67)2 (8.33)8660 (69.77)26 (30.23) Current smoker392301 (76.79)91 (23.21)8371 (85.54)12 (14.46)309230 (74.43)79 (25.57) Drinking habits0.0950.784‡0.058 Non- or social-drinker758598 (78.89)160 (21.11)135119 (88.15)16 (11.85)623479 (76.89)144 (23.11) Heavy drinker172125 (72.67)47 (27.33)3833 (86.84)5 (13.16)13492 (68.66)42 (31.34) Permitted sick leave0.7871.00‡0.809 Yes792614 (77.53)178 (22.47)147129 (87.76)18 (12.24)645485 (75.19)160 (24.81) No138109 (78.99)29 (21.01)2623 (88.46)3 (11.54)11286 (76.79)26 (23.21) Tenure0.1820.498‡0.076 Under 5 years208162 (77.88)46 (22.12)3327 (81.82)6 (18.18)175135 (77.14)40 (22.86) 5 to under 10 years203167 (82.27)36 (17.73)3027 (90.00)3 (10.00)173140 (80.92)33 (19.08) 10 or more years519394 (75.92)125 (24.08)11098 (89.09)12 (10.91)409296 (72.37)113 (27.63) Position†0.9530.444‡0.773 Employee691538 (77.86)153 (22.14)127111 (87.40)16 (12.60)564427 (75.71)137 (24.29) Manager159122 (76.73)37 (23.27)3028 (93.33)2 (6.67)12994 (72.87)35 (27.13) Chief5442 (77.78)12 (22.22)1512 (80.00)3 (20.00)3930 (76.92)9 (23.08) Occupation†0.9230.256‡0.791 White-collar159124 (77.99)35 (22.01)3231 (96.87)1 (3.13)12793 (73.23)34 (26.77) Pink-collar‖138109 (78.99)29 (21.01)2522 (88.00)3 (12.00)11387 (76.99)26 (23.01) Blue-collar585453 (77.44)132 (22.56)10994 (86.24)15 (13.76)476359 (75.42)117 (24.58) Shift work§0.5710.9550.556 No shift413317 (76.76)96 (23.24)7163 (88.73)8 (11.27)342254 (74.27)88 (25.73) Shift517406 (78.53)111 (21.47)10289 (87.25)13 (12.75)415317 (76.39)98 (23.61) Employment type0.4750.080‡0.123 Regular825638 (77.33)187 (22.67)164146 (89.02)18 (10.98)661492 (74.43)169 (25.57) Part-time10585 (80.95)20 (19.05)96 (66.67)3 (33.33)9679 (82.29)17 (17.71) (continued to the next page)
CharacteristicsTotal participants (n = 930)With depression (PHQ > 2) (n = 173)Without depression (PHQ ≤ 2) (n = 757) No.With presenteeism (%)Without presenteeism (%)p-value*No.With presenteeism (%)Without presenteeism (%)p-value*No.With presenteeism (%)Without presenteeism (%)p-value* Weekly working hours (hours/week)0.8871.00‡0.749 ≤ 52659511 (77.54)148 (22.46)135118 (87.41)17 (12.59)524393 (75.00)131 (25.00) > 52271212 (78.23)59 (21.77)3834 (89.47)4 (10.53)233178 (76.39)55 (23.61) Job-related stress Job demand< 0.0001¶0.372< 0.001¶ High312280 (89.74)32 (10.26)9485 (90.43)9 (9.57)218195 (89.45)23 (10.55) Low618443 (71.68)175 (28.32)7967 (84.81)12 (15.19)539376 (69.76)163 (30.24) Insufficient job-control0.0550.4510.018¶ High506406 (80.24)100 (19.76)9884 (85.71)14 (14.29)408322 (78.92)86 (21.08) Low424317 (74.76)107 (25.24)7568 (90.67)7 (9.33)349249 (71.35)100 (28.65) Interpersonal conflict< 0.001¶0.720< 0.001¶ High471395 (83.86)76 (16.14)10190 (89.11)11 (10.89)370305 (82.43)65 (17.57) Low459328 (71.46)131 (28.54)7262 (86.11)10 (13.89)387266 (68.73)121 (31.27) PHQ: Patient Health Questionnaire. *Statistical significance: p-value <0.05; †The sum of numbers may not equal the total number in each group owing to missing values; ‡p-value of Fisher's exact test: p-value <0.05; §Participants whom they were separated, divorced, or bereaved belong to this category; ‖Pink-collar indicates service or customer service workers; ¶Indicates that p-value is below 0.05.
Table 1. (Continued) Distribution of participants with presenteeism according to demographic and work-related characteristics
participants without depression. Among the total number of participants, statistically significant differences were observed in a few variables such as gender, job demands, and interpersonal conflict. The prevalence of presenteeism was higher in women and those with higher job demands and higher interpersonal conflict. In the “participants with depression”
group, significant differences were observed in age, and marriage status while the
“participants without depression” group had significant differences in gender, job-demands, insufficient job control, and interpersonal conflict.
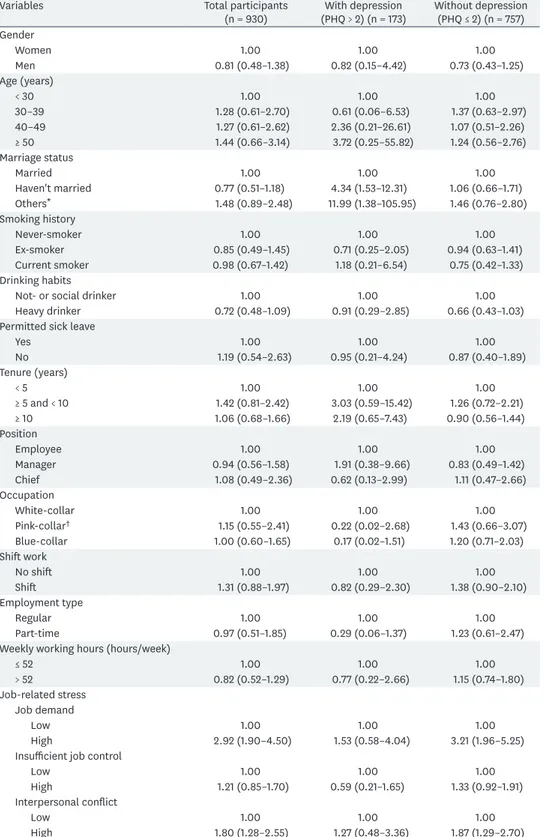
Regarding further analysis, we conducted multilevel logistic regression to determine the association between the variables and existence of recent presenteeism (Tables 2 and 3), and to present odds ratios (ORs). In Table 2, a simple univariate multilevel logistic analysis was conducted for each variable within total participants, participants with depression, and participants without depression. Technically, higher job demands (OR: 2.92, 95% CI:1.90–
4.50), and higher interpersonal conflict (OR: 1.80, 95% CI:1.28–2.55), showed significantly elevated OR. In participants with depression, results showed a significant relationship with a wide CI in marriage status while the relationship with other variables remained insignificant.
On the other hand, participants without depression presented that higher job-demand (OR:
3.21, 95% CI:1.96–5.25) and higher interpersonal conflict (OR: 1.87, 95% CI: 1.29–2.70) had significant OR regarding the presenteeism experience.
Further, multivariate multilevel analysis was conducted by including general and work- related characteristics (Table 3). Gender, age, marriage status, smoking history, and drinking habits were included as general characteristics, while permitted sick leave, tenure, position, occupation, shift-work, employment type, and weekly working hours were considered as work-related characteristics. In our study, we set 3 models for demonstrating the associations between job-related stress and presenteeism. Model 1 adjusted only general characteristics.
In model 2, only work-related factors were included. Model 3 included both general and work- related characteristics to adjust and investigate the relationship between job-related stress and presenteeism. These 3 models were used to conduct analyses between the total number of participants, participants with depression, and participants without depression.
Regarding all participants, higher job demands and higher interpersonal conflict were significant in every model. In the final model, OR of higher job demand was 3.29 (95% CI:
2.08–5.21), and that of higher interpersonal conflict was 1.87 (95% CI: 1.29–2.71). That tendency remained among participants without depression. They showed significantly elevated OR in job demand and interpersonal conflict in every model, while insufficient job control showed insignificant relationship with presenteeism. Among participants with depression, job-related stress showed insignificantly elevated OR.
DISCUSSION
In this study, we tried to demonstrate the association between job stress and the prevalence of presenteeism among workers from multiple enterprises, with stratification by the presence of depression. Using self-reported questionnaires, we collected data regarding general characteristics (gender, age, and marriage status), work-related variables (tenure, occupation, types of employment, and etc.), and psychosocial variables related to job-stress and depression.
The research results reveal that job-stress, especially higher job demands and higher
Table 2. ORs for presenteeism by univariate multilevel analysis of each variable
Variables Total participants
(n = 930) With depression
(PHQ > 2) (n = 173) Without depression (PHQ ≤ 2) (n = 757) Gender
Women 1.00 1.00 1.00
Men 0.81 (0.48–1.38) 0.82 (0.15–4.42) 0.73 (0.43–1.25)
Age (years)
< 30 1.00 1.00 1.00
30–39 1.28 (0.61–2.70) 0.61 (0.06–6.53) 1.37 (0.63–2.97)
40–49 1.27 (0.61–2.62) 2.36 (0.21–26.61) 1.07 (0.51–2.26)
≥ 50 1.44 (0.66–3.14) 3.72 (0.25–55.82) 1.24 (0.56–2.76)
Marriage status
Married 1.00 1.00 1.00
Haven't married 0.77 (0.51–1.18) 4.34 (1.53–12.31) 1.06 (0.66–1.71)
Others* 1.48 (0.89–2.48) 11.99 (1.38–105.95) 1.46 (0.76–2.80)
Smoking history
Never-smoker 1.00 1.00 1.00
Ex-smoker 0.85 (0.49–1.45) 0.71 (0.25–2.05) 0.94 (0.63–1.41)
Current smoker 0.98 (0.67–1.42) 1.18 (0.21–6.54) 0.75 (0.42–1.33)
Drinking habits
Not- or social drinker 1.00 1.00 1.00
Heavy drinker 0.72 (0.48–1.09) 0.91 (0.29–2.85) 0.66 (0.43–1.03)
Permitted sick leave
Yes 1.00 1.00 1.00
No 1.19 (0.54–2.63) 0.95 (0.21–4.24) 0.87 (0.40–1.89)
Tenure (years)
< 5 1.00 1.00 1.00
≥ 5 and < 10 1.42 (0.81–2.42) 3.03 (0.59–15.42) 1.26 (0.72–2.21)
≥ 10 1.06 (0.68–1.66) 2.19 (0.65–7.43) 0.90 (0.56–1.44)
Position
Employee 1.00 1.00 1.00
Manager 0.94 (0.56–1.58) 1.91 (0.38–9.66) 0.83 (0.49–1.42)
Chief 1.08 (0.49–2.36) 0.62 (0.13–2.99) 1.11 (0.47–2.66)
Occupation
White-collar 1.00 1.00 1.00
Pink-collar† 1.15 (0.55–2.41) 0.22 (0.02–2.68) 1.43 (0.66–3.07)
Blue-collar 1.00 (0.60–1.65) 0.17 (0.02–1.51) 1.20 (0.71–2.03)
Shift work
No shift 1.00 1.00 1.00
Shift 1.31 (0.88–1.97) 0.82 (0.29–2.30) 1.38 (0.90–2.10)
Employment type
Regular 1.00 1.00 1.00
Part-time 0.97 (0.51–1.85) 0.29 (0.06–1.37) 1.23 (0.61–2.47)
Weekly working hours (hours/week)
≤ 52 1.00 1.00 1.00
> 52 0.82 (0.52–1.29) 0.77 (0.22–2.66) 1.15 (0.74–1.80)
Job-related stress Job demand
Low 1.00 1.00 1.00
High 2.92 (1.90–4.50) 1.53 (0.58–4.04) 3.21 (1.96–5.25)
Insufficient job control
Low 1.00 1.00 1.00
High 1.21 (0.85–1.70) 0.59 (0.21–1.65) 1.33 (0.92–1.91)
Interpersonal conflict
Low 1.00 1.00 1.00
High 1.80 (1.28–2.55) 1.27 (0.48–3.36) 1.87 (1.29–2.70)
Data are presented odds ratio (95% confidence interval).
PHQ: Patient Health Questionnaire.
*Participants whom they were separated, divorced, or bereaved belong to this category; †Pink-collar indicates service or customer service workers.
interpersonal conflict, are highly related to the prevalence of presenteeism, and job-related stress is significantly correlated to presenteeism among participants without depression.
Presenteeism is reportedly related to stress according to preceding studies [20,40-42].
Job demands can overtax an employee's mental and physical resources, and help to make decisions about attending work while sick [12]. Previously, Oh et al. [29] reported a relationship between presenteeism and high stress; moreover, the tendency between presenteeism and high stress remained significant in the subgroup analysis for blue-collar workers. Another study by Ryu et al. [21], investigated the relationship between job-stress and presenteeism among Korean railroad workers. In that study, significantly elevated ORs were reported in the highest job stress group and high-risk psychosocial group [21]. Further, in our study, higher job demands and higher interpersonal conflicts were significantly related to presenteeism.
Another Korean study that investigated the association between nonstandard employment and presenteeism showed that nonstandard employment could increase the risk of presenteeism in short-term subcontract workers (OR: 1.29, 95% CI: 1.04–1.60) and long- Table 3. ORs for presenteeism related to job-related stress in multivariate multilevel analysis
Variables ORs for presenteeism
Model 1* Model 2† Model 3‡
Total participants (n = 930) Job demand
Low 1.00 1.00 1.00
High 3.28 (2.11–5.12) 2.93 (1.87–4.59) 3.29 (2.08–5.21)
Insufficient job control
Low 1.00 1.00 1.00
High 1.16 (0.81–1.64) 1.19 (0.82–1.73) 1.14 (0.78–1.67)
Interpersonal conflict
Low 1.00 1.00 1.00
High 1.77 (1.24–2.51) 1.92 (1.33–2.76) 1.87 (1.29–2.71)
Participants with depression (n = 173) Job demand
Low 1.00 1.00 1.00
High 2.15 (0.67–6.84) 1.43 (0.46–4.41) 2.59 (0.58–11.56)
Insufficient job control
Low 1.00 1.00 1.00
High 0.72 (0.22–2.35) 0.72 (0.20–2.54) 0.85 (0.18–4.03)
Interpersonal conflict
Low 1.00 1.00 1.00
High 0.86 (0.27–2.72) 1.14 (0.37–3.51) 0.70 (0.18–2.78)
Participants without depression (n = 757) Job demand
Low 1.00 1.00 1.00
High 3.57 (2.15–5.93) 3.19 (1.91–5.33) 3.56 (2.10–6.03)
Insufficient job control
Low 1.00 1.00 1.00
High 1.28 (0.88–1.85) 1.25 (0.84–1.86) 1.20 (0.80–1.81)
Interpersonal conflict
Low 1.00 1.00 1.00
High 1.89 (1.30–2.75) 2.00 (1.36–2.96) 1.99 (1.34–2.97)
Data are presented OR (95% confidence interval).
OR: odds ratio.
*Multivariate analysis of general characteristics, such as age (categorical), gender, marriage status, smoking history, and drinking habit; †Multivariate analysis of work-related characteristics such as permitted sick leave, tenure, position, occupation, shift-work, employment type, and weekly working hours; ‡Multivariate analysis of general characteristics, and work-related characteristics.
term subcontract workers (OR: 1.63, 95% CI: 1.12–2.36) [43]. The current study did not show significant differences between employment types; a future study with a larger population and more specific questionnaires for work-related factors may help to better understand the effects of working environmental factors on presenteeism.
In the field, there are several kinds of presenteeism scales such as the Stanford Presenteeism Scale (SPS), and the Health and Labour Questionnaire (HLQ), among others. While the WPAI-GH form asks for information regarding presenteeism in the past one week, the SPS asks for presenteeism occurring in the past one month, and the HLQ asks for presenteeism occurring in the past 2 weeks [27]. The difference in the recall periods between presenteeism instruments induces differences in recall bias [4]. With that reason, simple comparisons of the prevalence of presenteeism between studies can be limited.
Therefore, we mainly compared our results with that of 2 previous studies that used identical methodology to define presenteeism. One study reported the prevalence of presenteeism to be 47.8% among employees of an electronic enterprise, 46.6% of whom were blue-collar workers and 50.7% of whom were white-collar workers [29]. The other study reported the prevalence of presenteeism to be 52.0% among Korean railroad workers; 55.5% comprised the higher job-stress group and 65.6% comprised the high-risk stress group [21].
In our study, the prevalence of presenteeism was 77.74%, which was higher than that of preceding studies. The survey was conducted at the workplace; therefore, participants who were on sick leave and did not have presenteeism were understandably excluded at the survey step. Also, the survey was distributed to and collected from participants who agreed to and volunteered for this research. This study also received a strong backing from the labor federation and the chiefs of labor unions in each enterprise. Thus, workers who were eager to improve their workplace and who were more sensitive to their working environment could be recruited more easily than in other studies. This might have resulted in the exaggeration of the prevalence of presenteeism in their working environments.
The prevalence of depressive symptoms was 18.60% in this study. A previous study that used PHQ-2 for investigating depression among Korean farmers reported a prevalence rate of 12.5% for depression [44]. Another study that used the Center for Epidemiological Studies Depression to report depression among immigrant workers in Korea reported a 47.3%
prevalence rate in the higher job-demand group and 32.0% in the “normal job-demand”
group [45]. Considering the reported prevalence of depression and the validation results of PHQ-2 and its cut-off value [24] in previous studies, the prevalence of depression in our current study is quite relevant.
Moreover, job-related stress is usually defined by 7 different aspects such as physical environment, job demand, insufficient job control, interpersonal conflict, job insecurity, organizational system, lack of reward, and occupational climate [46]. However, when survey researchers underwent the pilot-study, most workers refused to answer the full questionnaire of the KOSS. Therefore, only job-demands, insufficient job control, and interpersonal conflicts, which were thought to be highly related to job-related stress, were investigated.
Future study designs should employ the full version of the KOSS and ensure a supportive investigating environment to better understand diverse working environments and full aspects of job-related stress.
Another limitation of this study is the low response rate to the questionnaires (51.7%). Returned questionnaires were 1,464 (81.3%) of 1,800 distributed papers. However, 534 questionnaires were not appropriate for analysis due to missing values regarding important variables such as presenteeism, job-related stress, or depression. The questionnaires were distributed via mail to the chiefs of labor union in each enterprise, and collected by the chiefs and sent back to the researchers by mail. During this process, researchers did not have a chance to contact actual participants, but only chiefs of labor unions, who did not have adequate background knowledge to explain the questionnaire and encourage workers to complete the questionnaire. Thus, incomplete questionnaires were excluded, thus lowering the response rate.
Despite the above limitations, our study demonstrates the associations between job- related stress and presenteeism using multilevel analysis for better accuracy. There was no significant relationship between job-related stress and presenteeism in participants with depression group. In the previous studies, researchers hypothesized that patients with depression were able to show diminished emotional reactivity to both positive and negative stimuli. It is called as “Emotion Context Insensitivity” which often features perceptions of the world as dull, flat, and empty [47]. With this hypothesis, workers with depression in this study might be a little insensitive to the job-stress or their surrounding environments.
In the similar context, Cocker et al. studied the factors related to presenteeism among workers reporting life time major depression, and they found that no ORs of work-related factors significantly elevated upon experience of presenteeism [48]. However, it is difficult to conclude that job-related stress is not an important factor affecting presenteeism in people with depression. To demonstrate the relationship in depression group, future studies with a larger population and less bias are needed.
CONCLUSIONS
It is suggested that higher job demands and interpersonal conflict are significantly related to presenteeism. Therefore, our study results suggest that management of job-stress
including lowering job demands and interpersonal conflict is an important strategy to reduce presenteeism in workers. To overcome the limitations of our study, a future study using a larger population, more accurate study structure, and specific definitions of psychological problems such as depression and that fully evaluates job stress is needed to demonstrate the relationship more precisely.
ACKNOWLEDGEMENTS
Over thousand workers were eager to participate in and support this study. We acknowledge their contributions with gratitude.
SUPPLEMENTARY MATERIAL
Supplementary Table 1
General characteristics of enrolled enterprises Click here to view
REFERENCES
1. French MT, Holtmann AG, McGeary KA, Zarkin GA. Substance use and workplace attendance. In:
Grossman M, Hsieh CR, editors. Economic analysis of substance use and abuse: the experience of developed countries and lessons for developing countries. Cheltenham: Edward Elgar Publishing; 2001. p. 239-53.
2. Wattles MG, Harris C. The relationship between fitness levels and employee's perceived productivity, job satisfaction, and absenteeism. J Exerc Physiol Online 2003;6(1):24-32.
3. Hanna AS, Menches CL, Sullivan KT, Sargent JR. Factors affecting absenteeism in electrical construction.
J Constr Eng Manage 2005;131(11):1212-8.
CROSSREF
4. Schultz AB, Edington DW. Employee health and presenteeism: a systematic review. J Occup Rehabil 2007;17(3):547-79.
PUBMED | CROSSREF
5. Jena AB, Baldwin DC Jr, Daugherty SR, Meltzer DO, Arora VM. Presenteeism among resident physicians.
JAMA 2010;304(11):1166-8.
PUBMED | CROSSREF
6. Martinez LF, Ferreira AI. Sick at work: presenteeism among nurses in a Portuguese public hospital. Stress Health 2012;28(4):297-304.
PUBMED | CROSSREF
7. van den Heuvel SG, Ijmker S, Blatter BM, de Korte EM. Loss of productivity due to neck/shoulder symptoms and hand/arm symptoms: results from the PROMO-study. J Occup Rehabil 2007;17(3):370-82.
PUBMED | CROSSREF
8. Dew K, Keefe V, Small K. ‘Choosing’ to work when sick: workplace presenteeism. Soc Sci Med 2005;60(10):2273-82.
PUBMED | CROSSREF
9. Levin-Epstein J. Presenteeism and paid sick days. Washington, D.C.: Center for Law and Social Policy; 2005.
10. Pichler S, Ziebarth NR. The pros and cons of sick pay schemes: testing for contagious presenteeism and noncontagious absenteeism behavior. J Public Econ 2017;156:14-33.
CROSSREF
11. Malhi L, Akkadechnunt T, Sirakamon S. Job stress and presenteeism among nurses in tertiary care hospitals, the Islamic Republic of Pakistan. Int J Evid Based Healthc 2016;14:S18.
CROSSREF
12. Bakker AB, Demerouti E, De Boer E, Schaufeli WB. Job demands and job resources as predictors of absence duration and frequency. J Vocat Behav 2003;62(2):341-56.
CROSSREF
13. Carayon P, Smith MJ, Haims MC. Work organization, job stress, and work-related musculoskeletal disorders. Hum Factors 1999;41(4):644-63.
PUBMED | CROSSREF
14. James GD, Cates EM, Pickering TG, Laragh JH. Parity and perceived job stress elevate blood pressure in young normotensive working women. Am J Hypertens 1989;2(8):637-9.
PUBMED | CROSSREF
15. Lin SH, Liao WC, Chen MY, Fan JY. The impact of shift work on nurses' job stress, sleep quality and self- perceived health status. J Nurs Manag 2014;22(5):604-12.
PUBMED | CROSSREF
16. Evans-Lacko S, Knapp M. Global patterns of workplace productivity for people with depression:
absenteeism and presenteeism costs across eight diverse countries. Soc Psychiatry Psychiatr Epidemiol 2016;51(11):1525-37.
PUBMED | CROSSREF
17. Peele PB, Tollerud DJ. Depression and occupational injury: results of a pilot investigation. J Occup Environ Med 2005;47(4):424-7.
PUBMED | CROSSREF
18. Roper KA. Individual, disease, and work-related factors associated with work patterns, presenteeism and sick pay policy of the colorectal cancer survivor after treatment [dissertation]. Boston, MA: University of Massachusetts Boston; 2014. 150 p.
19. Wang J, Smailes E, Sareen J, Schmitz N, Fick G, Patten S, et al. Three job-related stress models and depression: a population-based study. Soc Psychiatry Psychiatr Epidemiol 2012;47(2):185-93.
PUBMED | CROSSREF
20. Kwon M, Kim SL. The job stress and presenteeism of occupational health nurses in workplace in Korea.
Korean J Occup Health Nurs 2010;19(2):159-69.
21. Ryu IS, Jeong DS, Kim IA, Roh JH, Won JU. Association between job stress, psychosocial well-being and presenteeism, absenteeism: focusing on railroad workers. Korean J Occup Environ Med 2012;24(3):263-73.
22. Baek JT, Cho YC. The relationships between emotional labour, depressive symptoms and presenteeism among counselors in call centers. J Korea Acad Ind Coop Soc 2015;16(6):4086-97.
23. Löwe B, Kroenke K, Gräfe K. Detecting and monitoring depression with a two-item questionnaire (PHQ- 2). J Psychosom Res 2005;58(2):163-71.
PUBMED | CROSSREF
24. Arrieta J, Aguerrebere M, Raviola G, Flores H, Elliott P, Espinosa A, et al. Validity and utility of the Patient Health Questionnaire (PHQ)-2 and PHQ-9 for screening and diagnosis of depression in rural Chiapas, Mexico: a cross-sectional study. J Clin Psychol 2017;73(9):1076-90.
PUBMED | CROSSREF
25. Shin JH, Kim HC, Jung CH, Kim JB, Jung SW, Cho HJ, et al. The standardization of the Korean version of the Patient Health Questionnaire-2. J Korean Neuropsychiatr Assoc 2013;52(3):115-21.
26. Reilly MC, Zbrozek AS, Dukes EM. The validity and reproducibility of a work productivity and activity impairment instrument. Pharmacoeconomics 1993;4(5):353-65.
PUBMED | CROSSREF
27. Lofland JH, Pizzi L, Frick KD. A review of health-related workplace productivity loss instruments.
Pharmacoeconomics 2004;22(3):165-84.
PUBMED | CROSSREF
28. Lynch W, Riedel JE. Measuring employee productivity: a guide to self-assessment tools. Scottsdale, AZ:
Institute for Health and Productivity Management; 2001.
29. Oh SW, Jung KT, Park JY. The association of health risks with absenteeism and presenteeism. Korean J Occup Environ Med 2007;19(4):304-14.
30. Hox J. Multilevel modeling: when and why. In: Balderjahn I, Mathar R, Schader M, editors. Classification, data analysis, and data highways. Berlin: Springer; 1998. p. 147-54.
31. Diez-Roux AV. Multilevel analysis in public health research. Annu Rev Public Health 2000;21(1):171-92.
PUBMED | CROSSREF
32. Osborne JW. The advantages of hierarchical linear modeling. College Park, MD: ERIC Clearinghouse on Assessment and Evaluation; 2000.
33. McMahon JM, Pouget ER, Tortu S. A guide for multilevel modeling of dyadic data with binary outcomes using SAS PROC NLMIXED. Comput Stat Data Anal 2006;50(12):3663-80.
PUBMED | CROSSREF
34. D'Errigo P, Tosti ME, Fusco D, Perucci CA, Seccareccia F; Research group, Italian CABG Outcome Study.
Use of hierarchical models to evaluate performance of cardiac surgery centres in the Italian CABG outcome study. BMC Med Res Methodol 2007;7(1):29.
PUBMED | CROSSREF
35. Austin PC, Tu JV, Alter DA. Comparing hierarchical modeling with traditional logistic regression analysis among patients hospitalized with acute myocardial infarction: should we be analyzing cardiovascular outcomes data differently? Am Heart J 2003;145(1):27-35.
PUBMED | CROSSREF
36. Christiansen CL, Morris CN. Improving the statistical approach to health care provider profiling. Ann Intern Med 1997;127(8 Part 2):764-8.
PUBMED | CROSSREF
37. Alexandrescu R, Bottle A, Jarman B, Aylin P. Classifying hospitals as mortality outliers: logistic versus hierarchical logistic models. J Med Syst 2014;38(5):29.
PUBMED | CROSSREF
38. Ene M, Leighton EA, Blue GL, Bell BA. Multilevel models for categorical data using SAS® PROC GLIMMIX: the basics. SAS Global Forum 2015 Proceedings; 2015 Apr 26-29; Dallas, TX. Cary: SAS Institute; 2015 Apr. 459 p.
39. Roh H, Lee D, Kim Y. Prevalence of work-related musculoskeletal symptoms and their associations with job stress in female caregivers living in South Korea. J Phys Ther Sci 2014;26(5):665-9.
PUBMED | CROSSREF
40. Burton WN, Chen CY, Conti DJ, Schultz AB, Pransky G, Edington DW. The association of health risks with on-the-job productivity. J Occup Environ Med 2005;47(8):769-77.
PUBMED | CROSSREF
41. Jung MH, Lee YM, Arakida M. Stress and presenteeism in workers of small and medium enterprises.
Korean J Occup Environ Med 2007;19(1):47-55.
CROSSREF
42. Bae YH, Lee JH, Yoo HJ, Kim DE, Lee BR, Kim YH, et al. Associations between work-related
musculoskeletal pain, quality of life and presenteeism in physical therapists. J Korean Soc Occup Environ Hyg 2012;22(1):61-72.
43. Kim JY, Lee J, Muntaner C, Kim SS. Who is working while sick? Nonstandard employment and its association with absenteeism and presenteeism in South Korea. Int Arch Occup Environ Health 2016;89(7):1095-101.
PUBMED | CROSSREF
44. Suh YS, Cheon YH, Kim HO, Kim RB, Park KS, Yang HS, et al. Prevalence and risk factors of upper extremity musculoskeletal diseases among farmers in Gyeongnam. J Rheum Dis 2015;22(6):366-73.
45. Kim JK, Kim JE, Moon DH. Effect of occupational stress and sleep quality on depression among male immigrant workers manufacturing industry, Korea. J Korean Soc Occup Environ Hyg 2012;22(3):244-56.
46. Chang SJ, Koh SB, Kang D, Kim SA, Kang MG, Lee CG, et al. Developing an occupational stress scale for Korean employees. Korean J Occup Environ Med 2005;17(4):297-317.
47. Rottenberg J, Gross JJ, Gotlib IH. Emotion context insensitivity in major depressive disorder. J Abnorm Psychol 2005;114(4):627-39.
PUBMED | CROSSREF
48. Cocker F, Martin A, Scott J, Venn A, Otahal P, Sanderson K. Factors associated with presenteeism among employed Australian adults reporting lifetime major depression with 12-month symptoms. J Affect Disord 2011;135(1-3):231-40.
PUBMED | CROSSREF