ISSN 2234-3806 • eISSN 2234-3814
http://dx.doi.org/10.3343/alm.2015.35.1.15
Influence of Blood Lipids on Global Coagulation Test Results
Jung-Ah Kim, M.D.1, Ji-Eun Kim, M.S.2, Sang Hoon Song, M.D.1, and Hyun Kyung Kim, M.D.1,2
Department of Laboratory Medicine1 and Cancer Research Institute2, Seoul National University College of Medicine, Seoul, Korea Background: High levels of blood lipids have been associated with high levels of coagula-
tion factors. We investigated whether blood lipids influence the results of global coagula- tion tests, including prothrombin time (PT), activated partial thromboplastin time (aPTT), and thrombin generation assay (TGA).
Methods: PT, aPTT, and TGA, along with procoagulant and anticoagulant factors, were measured in 488 normal individuals. Vitamin K status was assessed with prothrombin-in- duced by vitamin K absence-II (PIVKA-II).
Results: The procoagulant factors II, VII, IX, X, and XI and anticoagulant factors protein C and protein S showed significant correlations with triglyceride, and the procoagulant fac- tors II, V, VII, IX, X, XI, and XII and anticoagulant factors antithrombin and protein C corre- lated with total cholesterol. There were no correlations of blood lipid levels with PIVKA-II levels. Subjects with high triglyceride levels (≥200 mg/dL) showed shorter PT values than those with lower triglyceride levels. However, aPTT value was not changed in terms of blood lipid levels. In both 1 and 5 pM tissue factor-induced TGAs, subjects in the high-tri- glyceride or high-cholesterol groups (≥240 mg/dL) had high levels of lag time, time-to- peak, and endogenous thrombin potential. Total cholesterol was a significant determinant of PT and TGA values.
Conclusion: High blood lipids were related with increased coagulation activity in a normal population. Our findings are expected to help interpret the global coagulation test results in individuals with high lipid levels.
Key Words: Blood coagulation tests, Triglycerides, Cholesterol, Blood coagulation factors
Received: May 12, 2014 Revision received: July 2, 2014 Accepted: October 19, 2014
Corresponding author: Hyun Kyung Kim Department of Laboratory Medicine, Seoul National University College of Medicine, 101 Daehak-ro, Jongno-gu, Seoul 110-744, Korea
Tel: +82-2-2072-0853 Fax: +82-2-747-0359 E-mail: [email protected]
© The Korean Society for Laboratory Medicine This is an Open Access article distributed under the terms of the Creative Commons Attribution Non-Commercial License (http://creativecom- mons.org/licenses/by-nc/3.0) which permits unrestricted non-commercial use, distribution, and reproduction in any medium, provided the original work is properly cited.
INTRODUCTION
Global coagulation assays, including prothrombin time (PT) and activated partial thromboplastin time (aPTT), are widely used in clinical laboratories for identification or monitoring of hemorrhagic conditions. However, these routine coagulation tests have limita- tions in terms of detecting some hemorrhagic diseases [1]. Re- cently, the thrombin generation assay (TGA) has been introduced as a new global coagulation assay that measures the whole co- agulation cascade and diagnoses the general state of the coagu- lation system [2]. TGA is based on the activation of coagulation
in the test plasma after addition of human relipidated recombi- nant tissue factor (TF) as a coagulation-triggering factor, which is suitable for replacing conventional thromboplastin in PT test [3]. The result is measured using a fluorescent substrate. TGA has been proven to reflect hemorrhagic and thrombotic diseases [2, 4-7] and is expected to be a good test for detecting hemo- static abnormalities, especially in patients with normal PT and aPTT results. In low-concentration TF physiological conditions, the TF factor VII complex mainly activates factor IX in associa- tion with factor VIII [8]. Therefore, low-concentration (1 pmol/L) TF-induced TGA is sensitive to factors VIII and IX compared with
the usual concentration (5 pmol/L) of TF-induced TGA that is independent of factor VIII and IX levels.
High blood lipid levels have been linked to increased coagula- tion factors [9-11]. Moreover, fat intake showed a strong associa- tion with increased coagulation factor VII [12, 13]. Hypercoagu- lability can be decreased by lipid-lowering drugs (statins) [14].
Because blood lipid levels are associated with coagulation factors, it is hypothesized that blood lipid levels affect coagula- tion test results. We investigated whether blood lipids influence the results of global coagulation tests including PT, aPTT, and TGA in a normal population.
METHODS
1. Study population and blood sampling
A total of 448 normal individuals (267 males and 181 females;
mean age, 55 yr; age range, 24-78 yr) who did not have a hos- pitalization history during the past 3 months was investigated in this study. These individuals’ medical history regarding hyper- tension or hypercholesterolemia and medication history was not collected. This study was approved by the Institutional Review Board of Seoul National University Hospital.
Peripheral blood was collected in commercial vacutainers (3.2% sodium citrate tube and serum separation tube; Becton Dickinson, San Jose, CA, USA). The whole bloods were centrifuged for 15 min at 1,550 g and the aliquots of supernatant plasma or serum were stored at −80°C for subsequent assays.
2. Coagulation assays
PT and aPTT were assayed by using the RecombiPlasTin (In- strumentation Laboratory, Milan, Italy) and SynthASil (Instru- mentation Laboratory) on an ACL 3000 (Beckman Coulter Inc., Fullerton, CA, USA). Procoagulant factor II, VII, and X levels were measured by a one-stage PT-based clotting assay. Proco- agulant factor VIII, IX, XI, and XII levels were measured by an aPTT-based clotting assay on the ACL 3000. Antithrombin, pro- tein C, and protein S activity was determined by using HemosIL liquid antithrombin, HemosIL Protein C, and HemosIL Free Pro- tein S (Instrumentation Laboratory).
3. Thrombin generation assay
Thrombin generation was measured in a Fluoroskan Ascent Flu- orometer (Thermo Lab systems, Helsinki, Finland) as described by Hemker et al. [15]. Thrombin generation was stimulated by two concentrations of TF (1 and 5 pmol/L). Briefly, 80 μL plasma was mixed with 20 μL of reagents containing TF and phospho-
lipid to a final concentration of 1 or 5 pmol/L TF. Then, 20 μL of a fluorogenic substrate mixed with CaCl2 was added. The thrombin generation amount was measured by using Thrombinoscope software (Diagnostica Stago, Asnieres, France). Four parame- ters including lag time, time-to-peak, peak thrombin, and en- dogenous thrombin potential (ETP) can be calculated from the thrombin generation curves (Fig. 1). Lag time is the starting point of thrombin generation, time-to-peak is the point to reach the peak thrombin height, peak thrombin is the maximum thrombin height, and ETP is the area under the thrombin gener- ation curve.
4. Chemistry assay
Glucose, albumin, total cholesterol, triglyceride, low density lipo- protein (LDL)-cholesterol, high density lipoprotein (HDL)-choles- terol, and high-sensitivity C-reactive protein (hs-CRP) were mea- sured using Toshiba 200FR (Toshiba, Tokyo, Japan). Glucose was measured with using SHINYANG SICDIA L-GLU kit (Shin- yang Chemical Co., Ltd., Seoul, Korea), albumins with SHIN- YANG SICDIA BCG (Shinyang Chemical Co.), total cholesterols with SHINYANG SICDIA T-CHO (Shinyang Chemical Co.), tri- glyceride with GPO-PAP Cobas kit (Roche Diagnostics, Mannheim, Germany), LDL-cholesterol with Randox direct LDL-cholesterol kit (Randox laboratories Ltd., Belfast, Northern Ireland), HDL- cholesterol with HDL-C plus 3rd generation kit (Roche Diagnos- tics) and hs-CRP with CRP-latex X2 kit (Denka Seiken Co., To- kyo, Japan).
Vitamin K status was assessed with prothrombin-induced by Fig. 1. Parameters of thrombin generation assay. Tissue factor addi- tion generates thrombin along the reaction time, and the resulting thrombin generation curve can be drawn as the above bell-shaped curve. Lag time is the point at which one-sixth of the peak thrombin height is reached; time-to-peak is the point at which the peak throm- bin height is reached. Peak thrombin is the maximum thrombin height, and endogenous thrombin potential (ETP) is the area under the thrombin generation curve.
Time (min) Tissue factor addition
Thrombin (nM)
Peak thrombin
Lag time ETP Time-to-peak
vitamin K absence-II (PIVKA-II) that was measured by Elitest ELISA kit (Eisai Co., Tokyo, Japan) on an LUMIPULSE G1200 (Fujirebio Inc., Tokyo, Japan).
5. Statistical analysis
We used IBM SPSS Statistics version 21 (IBM Corporation, Ar- monk, NY, USA) for all statistical analyses. Correlations were ex- pressed as Pearson correlation coefficients. Subgroup analyses for lipid profiles were performed by t-test. Multiple linear regres- sion analyses were performed to investigate the potential contrib- uting factor(s) to the levels of PT, aPTT, and TGA. A probability value (P) of less than 0.05 was considered significant.
RESULTS
1. Correlation of global coagulation test results with blood lipid levels
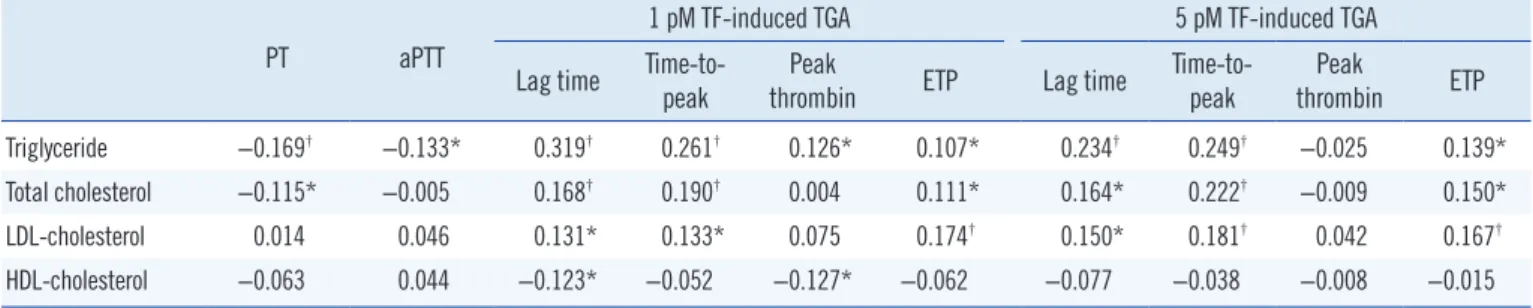
Correlations of four blood lipid levels (triglyceride, total choles- terol, LDL-cholesterol, and HDL-cholesterol) with global coagula- tion test results were analyzed (Table 1). PT negatively correlated with triglyceride and total cholesterol (P <0.001 and P =0.015, respectively). In addition, aPTT showed negative correlation with triglyceride (P =0.005). In 1 pmol/L TF-induced TGA, four pa- rameters—lag time, time-to-peak, peak thrombin, and ETP—
correlated with triglyceride (P <0.001, P <0.001, P =0.008, and P =0.024, respectively). Lag time, time-to-peak and ETP corre- lated with total cholesterol (P <0.001, P <0.001, and P =0.020, respectively) and LDL-cholesterol (P =0.006, P =0.005, and P <0.001, respectively); in addition, lag time and peak thrombin correlated with HDL-cholesterol (P =0.009 and P =0.008). In 5 pmol/L TF-induced TGA, lag time, time-to-peak, and ETP corre- lated with triglyceride (P <0.001, P <0.001, and P =0.003, re- spectively), total cholesterol (P =0.001, P <0.001, and P =0.002, respectively), and LDL-cholesterol (P =0.002, P <0.001, and
P <0.001, respectively).
2. Correlation of procoagulant and anticoagulant factors with blood lipid levels
There were significant correlations of some procoagulant and anticoagulation factors with blood lipid levels (Table 2). The pro- coagulant factors II, VII, IX, X, and XI and anticoagulant factors protein C and protein S showed significant correlations with tri- glyceride (P <0.001, P <0.001, P <0.001, P <0.001, P =0.004, P <0.001, and P <0.001, respectively) (data on protein S were missing in 204 normal participants). The procoagulant factors II, V, VII, IX, X, XI, and XII and anticoagulant factors antithrom-
Table 1. Correlation of global coagulation test results with lipid profile (n=448)
PT aPTT
1 pM TF-induced TGA 5 pM TF-induced TGA
Lag time Time-to-
peak Peak
thrombin ETP Lag time Time-to-
peak Peak
thrombin ETP
Triglyceride −0.169† −0.133* 0.319† 0.261† 0.126* 0.107* 0.234† 0.249† −0.025 0.139*
Total cholesterol −0.115* −0.005 0.168† 0.190† 0.004 0.111* 0.164* 0.222† −0.009 0.150*
LDL-cholesterol 0.014 0.046 0.131* 0.133* 0.075 0.174† 0.150* 0.181† 0.042 0.167†
HDL-cholesterol −0.063 0.044 −0.123* −0.052 −0.127* −0.062 −0.077 −0.038 −0.008 −0.015
Values are presented as correlation coefficients. *P <0.05; †P <0.001.
Abbreviations: PT, prothrombin time; aPTT, activated partial thromboplastin time; TF, tissue factor; TGA, thrombin generation assay; ETP, endogenous throm- bin potential; LDL, low-density lipoprotein; HDL, high-density lipoprotein.
Table 2. Correlation of blood lipid levels with coagulation factors (n=448)
Triglyceride Total
cholesterol LDL-
cholesterol HDL- cholesterol
Fibrinogen 0.003 0.016 0.034 −0.015
Factor II 0.219† 0.447† 0.334† 0.206†
Factor V 0.063 0.176† 0.188† 0.063
Factor VII 0.276† 0.275† 0.121 0.184†
Factor VIII −0.009 0.019 0.057 −0.008
Factor IX 0.337† 0.198† 0.181† −0.081
Factor X 0.400† 0.307† 0.227† −0.004
Factor XI 0.136* 0.171† 0.147* 0.056
Factor XII 0.094 0.095* 0.062 0.057
Antithrombin 0.116 0.253† 0.166† 0.148
Protein C 0.352† 0.401† 0.303† 0.085
Protein S‡ 0.258† 0.171 0.094 −0.035
PIVKA-II‡ −0.032 0.065 0.088 −0.030
Values are presented as correlation coefficients.
*P <0.05; †P <0.001; ‡Data on protein S and PIVKA-II were missing in 204 and 249 normal persons, respectively.
Abbreviations: LDL, low-density lipoprotein; HDL, high-density lipoprotein;
PIVKA-II, prothrombin-induced by vitamin K absence-II.
bin and protein C correlated with total cholesterol (P <0.001, P <0.001, P <0.001, P <0.001, P <0.001, P <0.001, P =0.044, P <0.001, and P <0.001, respectively). LDL-cholesterol also correlated with procoagulants II, V, IX, X, and XI and the antico- agulants antithrombin and protein C (P <0.001, P <0.001, P <
0.001, P <0.001, P =0.002, P <0.001, and P <0.001, respec- tively). HDL-cholesterol correlated with procoagulant factors II and VII (P <0.001 and P <0.001). Factor VIII and PIVKA-II lev- els did not show any correlation with blood lipid levels (data on PIVKA-II were missing in 249 normal participants).
3. Mean values of global coagulation test results in terms of blood lipid levels
Blood lipid levels were divided into two groups according to the National Cholesterol Education Program (NCEP) guidelines [16].
Subjects with high triglyceride levels (≥200 mg/dL) significantly showed shorter PT values than those with lower triglyceride lev- els (<200 mg/dL) (P =0.003) (Table 3). However, the mean value of aPTT was not changed according to blood lipid level mea- surements. In 1 and 5 pmol/L TF-induced TGA, subjects with high triglyceride levels showed higher levels of lag time (P <
0.001 and P <0.001), time-to-peak (P <0.001 and P <0.001), and ETP (P =0.005 and P =0.003) than those with low triglycer-
ide levels. Mean levels of PT and aPTT were not different in terms of total cholesterol. Subjects with high total cholesterol levels (≥240 mg/dL) showed high levels of lag time (P =0.032 and P =0.007), time-to-peak (P =0.009 and P = 0.001), and ETP (P =0.005 and P =0.006) in 1 and 5 pmol/L TF-induced TGA. According to LDL-cholesterol levels, ETP of 1 pmol/L TF- induced TGA was significantly different (P <0.001). Subjects with high HDL-cholesterol levels (≥60 mg/dL) had high levels of lag time (P =0.001) and time-to-peak (P =0.022) in 1 pmol/L TF-induced TGA.
4. Contributing factors to the results of global coagulation tests
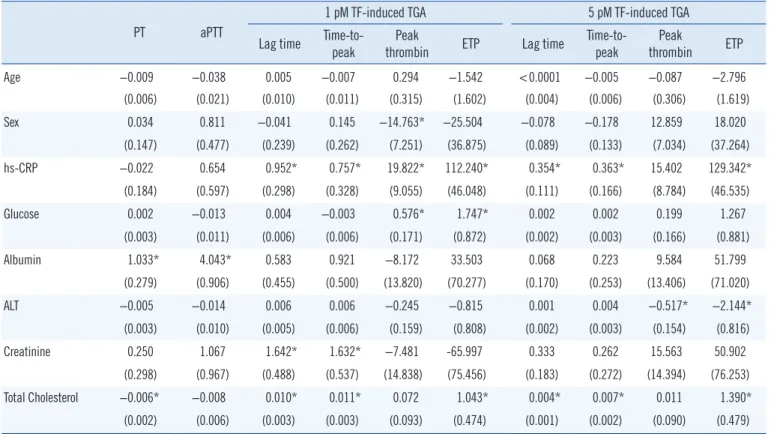
Multiple linear regression analyses were performed to investi- gate the potential independent contributor(s) to PT, aPTT, and TGA results (Table 4). The significant contributors to PT were al- bumin (P <0.001) and total cholesterol (P =0.001); albumin was also a contributor to the aPTT level (P <0.001). A lag time and time-to-peak of 1 pmol/L TF-induced TGA were significantly af- fected by hs-CRP (P =0.002 and P =0.022), creatinine (P =0.001 and P =0.003), and total cholesterol (P =0.001 and P =0.001).
The ETP of 1 pmol/L TF-induced TGA was determined by hs- CRP (P =0.015), glucose (P =0.046), and total cholesterol Table 3.Mean differences of global coagulation test results in terms of blood lipid levels
Triglyceride (mg/dL) Total cholesterol (mg/dL) LDL-cholesterol (mg/dL) HDL-cholesterol (mg/dL)
< 200 ≥ 200 < 240 ≥ 240 < 190 ≥ 190 < 60 ≥ 60
PT (sec) 12.2±1.3 11.6±1.2* 12.2±1.3 11.9±1.1 12.2±1.3 11.9±1.3 12.2±1.2 12.1±1.4
aPTT (sec) 33.3±4.1 32.2±4.4 33.2±4.1 33.1±4.1 33.2±4.1 32.0±3.6 33.1±4.1 33.6±4.3
1 pM TF-induced TGA
Lag time (min) 9.1±1.9 11.1±2.6† 9.3±2.0 10.0±2.4* 9.3±2.0 10.0±2.4 9.5±2.1 8.8±1.7*
Time-to-peak
(min) 12.9±2.1 14.8±2.9† 13.0±2.2 14.0±2.4* 13.1±2.2 13.8±2.5 13.2±2.3 12.7±1.8*
Peak thrombin (nM)
169.7±59.0 192.5±61.8* 171.7±59.3 172.4±63.6 171.4±59.3 185.8±72.3 174.2±60.0 164.3±57.8
ETP (nM∙min) 1,272.3±297.2 1,411.2±313.7* 1,272.9±293.5 1,416.2±352.1* 1,276.6±293.0 1,607.2±433.7† 1,296.7±307.1 1,248.0±279.4 5 pM TF-induced TGA
Lag time (min) 4.0±0.7 4.6±0.8† 4.0±0.7 4.4±0.7* 4.0±0.7 4.4±0.7 4.1±0.8 4.0±0.7 Time-to-peak
(min) 7.1±1.1 8.0±1.2† 7.1±1.1 7.7±1.2* 7.1±1.1 7.9±1.2* 7.2±1.2 7.1±1.0
Peak thrombin (nM)
267.9±58.0 263.7±62.0 267.6±57.6 267.2±66.3 267.8±57.7 258.5±81.0 267.3±59.6 268.1±54.5
ETP (nM∙min) 1,630.2±301.2 1,779.2±339.2* 1,631.5±304.4 1,777.4±311.6* 1,640.1±305.7 1,781.3±257.0 1,646.0±314.2 1,636.2±286.3 Values are presented as mean±standard deviation. *P <0.05; †P <0.001.
Abbreviations: LDL, low-density lipoprotein; HDL, high- density lipoprotein; PT, prothrombin time; aPTT, activated partial thromboplastin time; TF, tissue fac- tor, TGA, thrombin generation assay; ETP, endogenous thrombin potential.
(P =0.029). The lag time and time-to-peak of 5 pmol/L TF-in- duced TGA were mainly determined by hs-CRP (P =0.002 and P =0.030) and total cholesterol (P =0.001 and P =0.001). The ETP of 5 pmol/L TF-induced TGA was determined by hs-CRP (P =0.006), ALT (P =0.009), and total cholesterol (P =0.004).
DISCUSSION
This study demonstrated significant associations of global coag- ulation test results with blood lipid levels. The normal individuals with high triglyceride levels ( ≥200 mg/dL) showed definitively shorter PT values than those with lower triglyceride levels. In both 1 and 5 pM TF-induced TGA, lag time, time-to-peak, and ETP were increased in the high triglyceride or high cholesterol groups (≥240 mg/dL) compared with the lower triglyceride or cholesterol groups. Total cholesterol was revealed as a signifi- cant determinant of PT and TGA values.
It has been shown that patients with hypercholesterolemia or triglyceridemia had higher fibrinogen and factor VII levels and shorter PT and aPTT values than patients with lower cholesterol level [10, 11]. Similarly, our study showed significant correla-
Table 4. Determinants of global coagulation test results in multiple linear regression analysis
PT aPTT
1 pM TF-induced TGA 5 pM TF-induced TGA
Lag time Time-to-
peak Peak
thrombin ETP Lag time Time-to-
peak Peak
thrombin ETP
Age −0.009 −0.038 0.005 −0.007 0.294 −1.542 <0.0001 −0.005 −0.087 −2.796
(0.006) (0.021) (0.010) (0.011) (0.315) (1.602) (0.004) (0.006) (0.306) (1.619)
Sex 0.034 0.811 −0.041 0.145 −14.763* −25.504 −0.078 −0.178 12.859 18.020
(0.147) (0.477) (0.239) (0.262) (7.251) (36.875) (0.089) (0.133) (7.034) (37.264)
hs-CRP −0.022 0.654 0.952* 0.757* 19.822* 112.240* 0.354* 0.363* 15.402 129.342*
(0.184) (0.597) (0.298) (0.328) (9.055) (46.048) (0.111) (0.166) (8.784) (46.535)
Glucose 0.002 −0.013 0.004 −0.003 0.576* 1.747* 0.002 0.002 0.199 1.267
(0.003) (0.011) (0.006) (0.006) (0.171) (0.872) (0.002) (0.003) (0.166) (0.881)
Albumin 1.033* 4.043* 0.583 0.921 −8.172 33.503 0.068 0.223 9.584 51.799
(0.279) (0.906) (0.455) (0.500) (13.820) (70.277) (0.170) (0.253) (13.406) (71.020)
ALT −0.005 −0.014 0.006 0.006 −0.245 −0.815 0.001 0.004 −0.517* −2.144*
(0.003) (0.010) (0.005) (0.006) (0.159) (0.808) (0.002) (0.003) (0.154) (0.816)
Creatinine 0.250 1.067 1.642* 1.632* −7.481 -65.997 0.333 0.262 15.563 50.902
(0.298) (0.967) (0.488) (0.537) (14.838) (75.456) (0.183) (0.272) (14.394) (76.253)
Total Cholesterol −0.006* −0.008 0.010* 0.011* 0.072 1.043* 0.004* 0.007* 0.011 1.390*
(0.002) (0.006) (0.003) (0.003) (0.093) (0.474) (0.001) (0.002) (0.090) (0.479) Values are shown as regression coefficients (standard error). *P value<0.05.
Abbreviations: PT, prothrombin time; aPTT, activated partial thromboplastin time; TF, tissue factor; TGA, thrombin generation assay; ETP, endogenous throm- bin potential; hs-CRP, high-sensitivity C-reactive protein; ALT, alanine transaminase.
tions of total cholesterol and triglyceride levels with procoagulant factors II, VII, IX, and X except fibrinogen, implying that eleva- tion of procoagulant factors may contribute to short PT value in subjects with high blood lipids. Because there was no associa- tion of factor VIII with blood lipid levels in our study, subjects with hyperlipidemia also did not show a short aPTT value.
Besides procoagulant factors, anticoagulant factors such as protein C and protein S significantly correlated with triglyceride, whereas antithrombin and protein C correlated with total choles- terol. It is plausible that elevated procoagulant factors may be balanced by increased anticoagulant factors in hyperlipidemia and suggests a natural defense mechanism against athrombotic event. However, total hemostatic balance tends to shift to hyper- coagulability, considering that PT was short and ETP increased in hyperlipidemia.
It has also been reported that vitamin K-dependent coagula- tion factors correlated with blood lipid levels [17, 18]. Hence, vi- tamin K status may correlate with blood lipids. Our study as- sessed vitamin K status by measuring the circulating PIVKA-II level. There was no association between PIVKA-II and blood lipid levels. Our results eventually disclosed no apparent rela-
tionship between vitamin K status and blood lipid levels.
TGA recently emerged as a new coagulation test that provides useful information about hemorrhagic or thrombotic tendencies [2, 4-7]. TGA can measure the global hemostatic potential that is balanced by both procoagulant and anticoagulant factors [17].
ETP value represents total endogenous thrombin amount that can be generated by TF stimulation. The ETP value increases as procoagulant factors increase or anticoagulant factors decrease [17, 19]; therefore, our results showed that high levels of ETP were observed in hyperlipidemia, suggesting relatively high lev- els of procoagulant factors. Peak thrombin level is also changed similar to ETP values.
TGA’s lag time is mainly determined by factor VII, factor XII, and protein S levels [17, 19]. In other words, a decrease in fac- tor VII and XII or elevation of protein S can increase lag time. It has also been reported that procoagulant fibrinogen can para- doxically increase the lag time [20]. Our results showed that sub- jects with high lipid levels had increased lag times. Because high levels of protein S were associated with high triglyceride levels, the elevation of protein S in hypertriglyceridemia may in- crease lag time. Determining the exact cause of this paradoxical observation — that subjects with high lipid levels had increased lag times — needs further study.
Statins, the well-known lipid-lowing drugs not only decreases blood lipid levels but also reduces coagulation activity through the downregulation of TF in blood monocyte and endothelial cells [14]. Moreover, long-term statin treatment can reduce co- agulation activity in subjects with hypercholesterolemia [21]. In the same way, our data imply an association of hyperlipidemia with hypercoagulability.
This study has a few limitations. First, a prospective study would be necessary to verify the causal relationship suggested in this study, although our data demonstrated a clear relationship of blood lipid levels with global coagulation test results. Second, we could not assess other hypercoagulable status such as obe- sity, hormonal treatment, or socioeconomic factors that may af- fect global coagulation test results. Third, this study focused on effects of lipids on coagulation assay results only in a normal population. The effects of lipids on coagulation test results in patients with various diseases needs to be studied further.
Fourth, we could not get detailed medical or medication history of the study participants. However, we analyzed the correlation of current lipid levels with coagulation assay results.
In summary, our study showed significant associations between blood lipid levels and global coagulation test results. Of note, normal subjects with high triglyceride levels (≥200 mg/dL) ex-
hibited significantly shorter PT values than those with lower tri- glyceride levels. However, aPTT values were not changed in terms of blood lipid levels. In both 1 and 5 pM TF-induced TGA, subjects with high triglycerides or those in the high cholesterol groups (≥240 mg/dL) had high levels of lag time, time-to-peak, and ETP. Total cholesterol was shown as a significant determi- nant of PT and TGA values. These findings are expected to help interpret global coagulation test results in the population with high lipid levels.
Authors’ Disclosures of Potential Conflicts of Interest
No potential conflicts of interest relevant to this article were re- ported.
Acknowledgments
This research was supported by a grant of the Korea Health Technology R&D Project through the Korea Health Industry De- velopment Institute (KHIDI), funded by the Ministry of Health
&Welfare, Republic of Korea (grant number: HI13C0954).
REFERENCES
1. Kitchens CS. To bleed or not to bleed? Is that the question for the PTT?
J Thromb Haemost 2005;3:2607-11.
2. Dargaud Y, Trzeciak MC, Bordet JC, Ninet J, Negrier C. Use of calibrat- ed automated thrombinography +/- thrombomodulin to recognise the prothrombotic phenotype. Thromb Haemost 2006;96:562-7.
3. Tripodi A, Arbini A, Chantarangkul V, Mannucci PM. Recombinant tis- sue factor as substitute for conventional thromboplastin in the pro- thrombin time test. Thromb Haemost 1992;67:42-5.
4. Simioni P, Castoldi E, Lunghi B, Tormene D, Rosing J, Bernardi F. An un- derestimated combination of opposites resulting in enhanced thrombot- ic tendency. Blood 2005;106:2363-5.
5. Hron G, Kollars M, Binder BR, Eichinger S, Kyrle PA. Identification of pa- tients at low risk for recurrent venous thromboembolism by measuring thrombin generation. JAMA 2006;296:397-402.
6. Brandts A, van HylckamaVlieg A, Rosing J, Baglin TP, Rosendaal FR.
The risk of venous thrombosis associated with a high endogenous throm- bin potential in the absence and presence of activated protein C. J Thromb Haemost 2007;5:416-8.
7. Castoldi E, Govers-Riemslag JW, Pinotti M, Bindini D, Tans G, Berrettini M, et al. Coinheritance of Factor V (FV) Leiden enhances thrombin for- mation and is associated with a mild bleeding phenotype in patients ho- mozygous for the FVII 9726+5G>A (FVII Lazio) mutation. Blood 2003;
102:4014-20.
8. Osterud B and Rapaport SI. Activation of factor IX by the reaction prod- uct of tissue factor and factor VII: additional pathway for initiating blood coagulation. Proc Natl AcadSci U S A 1977;74:5260-4.
9. Branchi A, Rovellini A, Sommariva D, Gugliandolo AG, Fasoli A. Effect of three fibrate derivatives and of two HMG-CoA reductase inhibitors on
plasma fibrinogen level in patients with primary hypercholesterolemia.
Thromb Haemost 1993;70:241-3.
10. Chan P, Tomlinsoin B, Tsai CW, Pan WH, Lee YS. Thrombophilia in pa- tients with hypercholesterolemia. Metabolism 1996;45:966-9.
11. Chan P, Huang TY, Shieh SM, Lin TS, Tsai CW. Thrombophilia in pa- tients with hypertriglyceridemia. J Thromb Thrombolysis 1997;4:425-9.
12. Bowman R, Joosen AM, Welch AA, Luben RN, Khaw KT, Wareham NJ, et al. Factor VII, blood lipids and fat intake: gene-nutrient interaction and risk of coronary heart disease with the factor VII R353Q polymor- phism. Eur J Clin Nutr 2009;63:771-7.
13. Silveira A. Postprandial triglycerides and blood coagulation.Exp Clin En- docrinol Diabetes 2001;109:S527-32.
14. Undas A, Brummel-Ziedins KE, Mann KG. Statins and blood coagula- tion. Arterioscler Thromb Vasc Biol 2005;25:287-94.
15. Hemker HC, Giesen P, Al Dieri R, Regnault V, de Smedt E, Wagenvoord R, et al. Calibrated automated thrombin generation measurement in clotting plasma. Pathophysiol Haemost Thromb 2003;33:4-15.
16. Third report of the National Cholesterol Education Program (NCEP) ex- pert panel on detection, evaluation, and treatment of high blood choles-
terol in adults (Adult treatment panel III) final report. Circulation 2002;
106:3143-421.
17. Kim SY, Kim JE, Kim HK, Kim I, Yoon SS, Park S. Influence of coagula- tion and anticoagulant factors on global coagulation assays in healthy adults. Am J Clin Pathol 2013;139:370-9.
18. Hoffman CJ, Lawson WE, Miller RH, Hultin MB.Correlation of vitamin K- dependent clotting factors with cholesterol and triglycerides in healthy young adults. Arterioscler Thromb1994;14:1737-40.
19. Duchemin J, Pan-Petesch B, Arnaud B, Blouch MT, Abgrall JF. Influence of coagulation factors and tissue factor concentration on the thrombin generation test in plasma. Thromb Haemost 2008;99:767-73.
20. Omarova F, Uitte De Willige S, Ariëns RA, Rosing J, Bertina RM, Castol- di E. Inhibition of thrombin-mediated factor V activation contributes to the anticoagulant activity of fibrinogen γ’. J Thromb Haemost 2013;11:
1669-78.
21. Mayer J, Eller T, Brauer P, Solleder EM, Schäfer RM, Keller F, et al. Effects of long-term treatment with lovastatin on the clotting system and blood platelets. Ann Hematol 1992;64:196-201.