Association between Short Maternal Height and Low Birth Weight: A Hospital-based Study in Japan
Anthropometry measurements, such as height and weight, have recently been used to predict poorer birth outcomes. However, the relationship between maternal height and birth outcomes remains unclear. We examined the effect of shorter maternal height on low birth weight (LBW) among 17,150 pairs of Japanese mothers and newborns. Data for this analysis were collected from newborns who were delivered at a large hospital in Japan.
Maternal height was the exposure variable, and LBW and admission to the neonatal intensive care unit were the outcome variables. Logistic regression models were used to estimate the associations. The shortest maternal height quartile (131.0-151.9 cm) was related to LBW (OR 1.91 [95% CI 1.64, 2.22]). The groups with the second (152.0-157.9 cm) and the third shortest maternal height quartiles (158.0-160.9 cm) were also related to LBW. A P trend with one quartile change also showed a significant relationship. The relationship between maternal height and NICU admission disappeared when the statistical model was adjusted for LBW. A newborn’s small size was one factor in the relationship between shorter maternal height and NICU admission. In developed countries, shorter mothers provide a useful prenatal target to anticipate and plan for LBW newborns and NICU admission.
Keywords: Maternal Height; Low Birth Weight; Neonatal Intensive Care Unit Sachiko Inoue,1 Hiroo Naruse,2,3
Takashi Yorifuji,4 Tsuguhiko Kato,5 Takeshi Murakoshi,3 Hiroyuki Doi,6 and SV Subramanian7
1Department of Nursing, Okayama Prefectural University, Soja, Okayama, Japan; 2Department of Obstetrics, Kaba Memorial Hospital, Hamamatsu, Shizuoka, Japan; 3Department of Obstetrics, Seirei Hamamatsu General Hospital, Hamamatsu, Shizuoka, Japan; 4Department of Human Ecology, Okayama University Graduate School of Environmental and Life Science, Okayama, Japan;
5Department of Social Medicine, National Center for Child Health and Development, Tokyo, Japan;
6Department of Epidemiology, Okayama University Graduate School of Medicine, Dentistry, and Pharmaceutical Sciences, Okayama, Japan;
7Department of Social and Behavioral Sciences, Harvard School of Public Health, Boston, MA, USA Received: 19 June 2015
Accepted: 19 November 2015 Address for Correspondence:
Sachiko Inoue, PhD
Department of Nursing, Okayama Prefectural University, 111 Kuboki, Soja, Okayama 719-1197, Japan E-mail: [email protected]
http://dx.doi.org/10.3346/jkms.2016.31.3.353 • J Korean Med Sci 2016; 31: 353-359
INTRODUCTION
Several studies examining the relationship between maternal height and low birth weight showed that shorter maternal height was associated with reduced fetal growth and low birth weight (LBW) (1-4) and concluded that the primary reason for this as- sociation was undernutrition/malnutrition. In developed coun- tries, however, few studies are available on the effects of shorter maternal height on birth outcomes. Witter and Luke (5) report- ed that infants born from shorter women were symmetrically smaller than infants born from taller women in the United States.
Evidence for the effects of shorter maternal height on birth out- comes remains sparse among women in developed countries.
To the best of our knowledge, no studies of Japanese people have demonstrated the effect of shorter maternal height on new- borns’ health outcomes. Obstetric medical technology and ma- ternity health care in Japan differ from those in other countries.
First, Japan has one of the lowest infant mortality rates (2.3 per 1,000 births in 2011); medical technology including manage- ment in the neonatal intensive care unit (NICU), which is gen-
erally provided to both mothers and neonates, contributes to the low infant mortality rates. Second, Japan is rarely affected by food shortages; the food supply is currently stable at the na- tional level. Despite the sufficient food supply, the obesity rate is low (only 7 to 14% of the adults in their 20s and 30s in Japan have a BMI over 25.0, Ministry of Health, Labour, and Welfare, Japan, 2010 [6]), and obesity is not a major health concern among Japanese pregnant or non-pregnant women. Third, health guide- lines require frequent obstetrician/gynecologist visits during pregnancy; this also contributes to decreased health problems during pregnancy and at delivery and encourages child growth.
In this situation, however, LBW has increased by nearly 10% over the past two decades in Japan (7). At the same time, NICU ad- mission has been increasing and long-term admission is now a substantial problem in Japan.
In Japan, there is a greater focus on weight than on other an- thropometry measurements, and most studies conducted on Japanese mothers investigated maternal weight, body mass in- dex (BMI), and weight gain during pregnancy to evaluate their effect on birth outcomes (8-10). However, the effects of shorter
maternal height on birth outcomes are rarely investigated. The average height of Japanese women in their 20s and 30s is approx- imately 158 cm. This average value is similar to the average height of women in some low- to middle-income countries (11) but is shorter than that of women in developed countries. Therefore, we investigated the risk of shorter maternal height on LBW and subsequent NICU admission in Japan, where short stature is not an indicator of long-term exposure to undernutrition.
MATERIALS AND METHODS Data sources
Newborns delivered at Seirei Hamamatsu General Hospital in Shizuoka Prefecture, Japan, from 1997 to 2010 were eligible for inclusion in this study (n = 21,855) (8,12-14). Seirei Hamamatsu General Hospital is located in the western part of Shizuoka Pre- fecture and provides advanced medical care for higher risk preg- nant women with reproductive health problems. The partici- pants’ information was collected under general clinical practice and recorded in individual medical records. The data included age, sex, smoking habits, alcohol drinking habits, maternal and paternal occupations, and the condition of the neonates after delivery.
Participants
We included singleton newborns who were delivered after the 37th gestational week, who had live births (the Apgar score was
≥ 1 one minute after birth), and whose sex was known (Fig. 1, n = 17,162). Participants for whom maternal height was unknown or determined as incorrect (< 50 cm, > 220 cm) were excluded (n = 12). We only included neonates born after the 37th gesta- tional week to avoid confounding LBW with a mature birth and with a preterm birth (15). Ultimately, 17,150 participants were included in this study.
Exposure variables
Maternal height was the primary exposure variable in this study.
The distribution of maternal height among the participants rang- ed from 131.0 cm to 182.0 cm. We divided maternal height into four categories at quartile (Q) points: Q1, 131-151.9 cm; Q2, 152.0- 157.9 cm; Q3, 158.0-160.9 cm; and Q4, 161.0-181.0 cm. The high- est category (Q4) was used as a reference group in the statistical model. We also used this category as a continuous variable ac- cording to one quartile change (from Q1 to Q4 as 1 to 4) to check the dose-response relationship (P trend). Maternal height (cm) was used as a continuous value to assess the effect of a 1.0-cm change in height. Trend-test shows if there is an increased risk of LBW following 1 cm change of maternal height, as well as 1 quartile change (16). Height was measured by medical profes- sionals at the Seirei Hamamatsu General Hospital.
Outcome variables
To evaluate newborn birth outcomes (the outcome variable in this study), we used information on LBW and admission to the NICU. NICU admission immediately following delivery or dur- ing hospitalization for the delivery was counted as yes, and oth- er admissions were counted as no. Admission to the NICU after hospital discharge was not included because this information was not obtained. NICU admission may reflect newborns’ poor condition that was either related to or not related to LBW. All reasons for NICU admission were included. The possibility of healthy normal neonates’ admission to NICU is minimum among those participants as healthy neonates without any abnormal signs usually stay at obstetric department in Japan. LBW was defined as less than (<) 2,500 g (15).
Covariates
We considered several potential confounders, including mater- nal age, maternal BMI at baseline (pre-pregnancy), maternal smoking habits, paternal smoking habits, maternal alcohol drink- ing habits, and maternal occupational status. This information was obtained from mothers by trained obstetricians or midwives at the time of the prenatal examination when the expected due date was confirmed (~10 weeks of gestational age) and added or corrected at admission or delivery. Maternal age (continuous value) was adjusted using two methods to avoid collinearity as follows: 1) the individual value of maternal age minus the group mean maternal age of the participants; and 2) the square of (the individual value of maternal age minus the group mean mater- nal age of the participants). Maternal BMI (kg/m2) was calculat- ed as body weight (kg) divided by the square of height (m). Ma- ternal smoking habits were divided into three categories (no, quit smoking after conception, smoking during pregnancy).
Maternal alcohol drinking habits were assessed using dichoto- mous values (yes/no). Maternal occupation status was combin- ed with paternal occupational status as a proxy of socioeconom- Fig. 1. All newborns delivered at Seirei Hamamatsu General Hospital during the peri-
od of 1997-2010.
n = 17,150
Eligible participants for this analysis n = 21,855
n = 17,162
Excluded n = 4,693 (duplicated) under 37 weeks
not singleton birth still birth unknown infant sex
Excluded n = 12
missing and incorrect information of maternal height n = 11 missing information of birth weight n = 1
ic status and divided into seven categories: homemaker married to self-employed worker, homemaker married to company-em- ployed worker (salaried worker), homemaker married to pro- fessional worker, all other homemakers, company-employed worker, professional worker, and all other types of workers.
Statistical analysis
A descriptive analysis was conducted to show the demographic characteristics and lifestyles of the mothers, fathers, and new- borns. Small for gestational age (SGA) babies are those who are smaller in size than normal for their gestational age. In this study, SGA was defined as a weight below the 10th percentile for ges- tational age. We evaluated the relationships among maternal height, LBW, and NICU admission. Odds ratios (ORs) and 95%
confidence intervals (CIs) were estimated using logistic regres- sion. The two outcomes of LBW and NICU admission appeared to be correlated, and we ran three logistic regression models:
model 1 was not adjusted (crude model); model 2 was adjusted for maternal age, maternal BMI at baseline, maternal smoking
habits, paternal smoking habits, maternal alcohol drinking hab- its, and maternal occupational status (fully adjusted model);
and model 3 was adjusted for LBW in addition to the variables in model 2. Model 3 was designed to determine whether LBW played a role in the relationship between maternal height and NICU admission because newborns with LBW are more likely to be cared for in a NICU environment. We used SPSS version 20.0 for Mac OSX (IBM Japan, Tokyo, Japan) to conduct all of the statistical analyses in this study.
Ethical statement
This study was approved by the institutional review board of Okayama University on November 29, 2011 (No. 498), as well as the institutional review board of Seirei Hamamatsu General Hospital. At Seirei Hamamatsu General Hospital, the adminis- trative staff usually informs the patients that individual medical records may be used for clinical and epidemiologic research and that patients can refuse to allow their records to be includ- ed at any time. We strictly followed the clinical research guide- Table 1. Description of study participants who gave birth after 37 gestational weeks (n = 17,150)
Characteristics Total NICU admission (Yes) LBW (Yes)
No. % No. % No. %
Maternal height Q1 (131.00-151.99 cm) Q2 (152.00-157.99 cm) Q3 (158.00-160.99 cm) Q4 (161.00-181.00 cm)
3,779 4,472 3,999 4,898
22.0 26.1 23.3 28.6
448 435 353 410
12.1 9.9 9.0 8.5
432 364 299 310
11.4 8.1 7.5 6.3 Maternal age
< 25 25-34 35 ≤
2,081 12,268 2,797
12.1 71.6 16.3
227 1,132 287
11.1 9.4 10.4
200 962 243
9.6 7.8 8.7 Maternal BMI at baseline (BMI before pregnancy)
< 18.49 18.5-23.49 23.5-24.99 25.0 ≤
3,487 11,407 939 1,312
20.3 66.5 5.5 7.7
339 1,044 100 163
9.9 9.3 10.8 12.6
423 846 48 88
12.1 7.4 5.1 6.7 Maternal smoking habits
No
Quit after conception Smoking during pregnancy
16,152 329 482
95.2 1.9 2.8
1,507 42 74
9.5 12.9 15.6
1,297 31 60
8.0 9.4 12.4 Maternal alcohol habits
No Yes
16,196 775
95.4 4.6
1,549 74
9.7 9.7
1,332 57
8.2 7.4 Maternal occupational status
All other homemakers
Homemakers married to self-employed man Homemakers married to employee at company Homemakers married to professional Other worker
Office worker (OL) Professional worker
278 581 8,627 383 764 4,132 1,441
1.7 3.6 53.2 2.4 4.7 25.5 8.9
23 65 824 36 77 407 141
8.5 11.3 9.7 9.7 10.3 10.0 9.9
16 46 687 21 69 383 106
5.8 7.9 8.0 5.5 9.0 9.3 7.4 SGA
No Yes
15,756 1,359
92.1 7.9
1,080 560
7.0 41.9
571 832
3.6 61.2 LBW
No Yes
15,479 1,384
91.8 8.2
954 690
6.2 49.9 NICU, neonatal intensive care unit; BMI, body mass index; SGA, small for gestational age; LBW, low birth weight.
lines at Seirei Hamamatsu General Hospital with respect to the usage of individual information.
RESULTS
Descriptive analysis
The demographic characteristics and lifestyle habits of study participants are shown in Table 1. Mothers of shorter height were more likely to have LBW newborns, and these newborns were more likely to experience NICU admission (11.4% and 12.1%, respectively). Younger mothers ( < 25 years old) were more likely to have LBW newborns, and these newborns were more likely to be admitted to the NICU (9.6% and 11.1%, respec- tively); older mothers (> 35 years old) showed a similar pattern (8.7% and 10.4%, respectively). A lower maternal BMI was more likely to be associated with LBW. By contrast, a BMI greater than 25.0 was more likely to be associated with NICU admission. Mo- thers who smoked during pregnancy were more likely to have LBW newborns and newborns admitted to the NICU (12.4%
and 15.6%, respectively). There were no significant differences in the distribution of maternal alcohol drinking habits or ma-
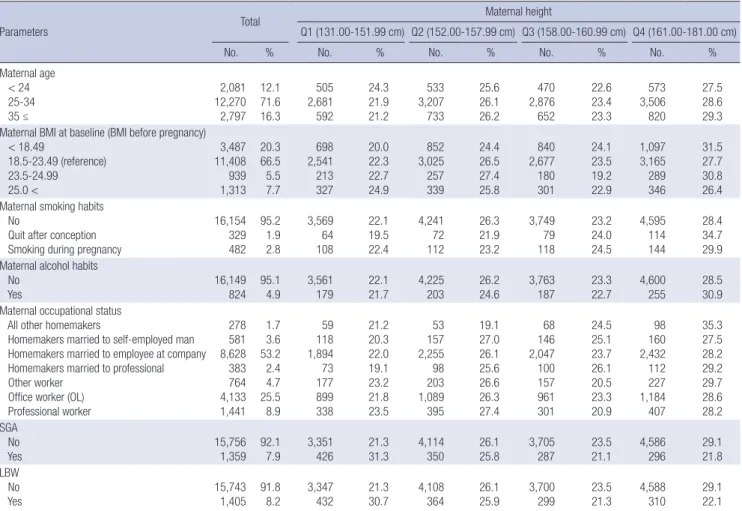
ternal occupational status with LBW and NICU admission. Ap- proximately 60% of LBW newborns were classified as SGA. De- scriptive data divided by each quartile point of height (Q1 to Q4) are shown in Table 2. The women in the shortest group (Q1) were more likely to have SGA and LBW babies than taller wom- en. By contrast, the women in the tallest group (Q4) were more likely to have non-SGA/non-LBW babies than shorter women.
There were no obvious differences between the 4 height groups regarding the distribution of other lifestyles or characteristics.
Maternal height and LBW
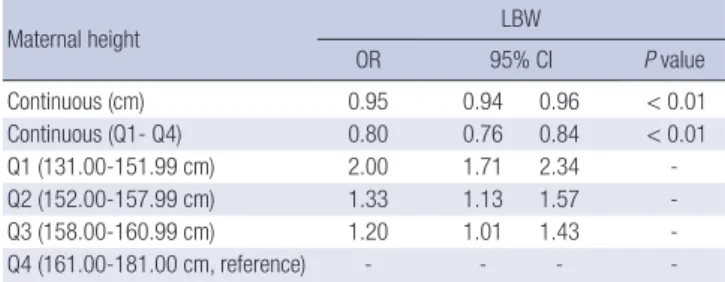
The relationship between maternal height and LBW was also evaluated (Table 3). In model 1, the shortest maternal height quartile (Q1) was related to LBW (OR 1.91 [CI 1.64, 2.22]). The second shortest (Q2) and third shortest (Q3) maternal height quartiles were also related to LBW (1.31 [1.12, 1.53] and 1.20 [1.01, 1.41], respectively). The results of the adjusted ORs and 95% CIs are shown in Table 2. In model 2, the height of mothers in Q1 remained related to LBW (2.00 [1.71, 2.34]), and the height of mothers in Q2 and Q3 was also related to LBW (1.33 [1.13, 1.57] and 1.20 [1.01, 1.43], respectively). These results showed
Table 2. Description of study participants by maternal height at quartile points (n = 17,150)
Parameters Total Maternal height
Q1 (131.00-151.99 cm) Q2 (152.00-157.99 cm) Q3 (158.00-160.99 cm) Q4 (161.00-181.00 cm)
No. % No. % No. % No. % No. %
Maternal age < 24 25-34 35 ≤
2,081 12,270 2,797
12.1 71.6 16.3
505 2,681 592
24.3 21.9 21.2
533 3,207 733
25.6 26.1 26.2
470 2,876 652
22.6 23.4 23.3
573 3,506 820
27.5 28.6 29.3 Maternal BMI at baseline (BMI before pregnancy)
< 18.49
18.5-23.49 (reference) 23.5-24.99 25.0 <
3,487 11,408 939 1,313
20.3 66.5 5.5 7.7
698 2,541 213 327
20.0 22.3 22.7 24.9
852 3,025 257 339
24.4 26.5 27.4 25.8
840 2,677 180 301
24.1 23.5 19.2 22.9
1,097 3,165 289 346
31.5 27.7 30.8 26.4 Maternal smoking habits
No
Quit after conception Smoking during pregnancy
16,154 329 482
95.2 1.9 2.8
3,569 64 108
22.1 19.5 22.4
4,241 72 112
26.3 21.9 23.2
3,749 79 118
23.2 24.0 24.5
4,595 114 144
28.4 34.7 29.9 Maternal alcohol habits
No Yes
16,149 824
95.1 4.9
3,561 179
22.1 21.7
4,225 203
26.2 24.6
3,763 187
23.3 22.7
4,600 255
28.5 30.9 Maternal occupational status
All other homemakers
Homemakers married to self-employed man Homemakers married to employee at company Homemakers married to professional Other worker
Office worker (OL) Professional worker
278 581 8,628 383 764 4,133 1,441
1.7 3.6 53.2 2.4 4.7 25.5 8.9
59 118 1,894 73 177 899 338
21.2 20.3 22.0 19.1 23.2 21.8 23.5
53 157 2,255 98 203 1,089 395
19.1 27.0 26.1 25.6 26.6 26.3 27.4
68 146 2,047 100 157 961 301
24.5 25.1 23.7 26.1 20.5 23.3 20.9
98 160 2,432 112 227 1,184 407
35.3 27.5 28.2 29.2 29.7 28.6 28.2 SGA
No Yes
15,756 1,359
92.1 7.9
3,351 426
21.3 31.3
4,114 350
26.1 25.8
3,705 287
23.5 21.1
4,586 296
29.1 21.8 LBW
No Yes
15,743 1,405
91.8 8.2
3,347 432
21.3 30.7
4,108 364
26.1 25.9
3,700 299
23.5 21.3
4,588 310
29.1 22.1 NICU, neonatal intensive care unit; BMI, body mass index; SGA, small for gestational age; LBW, low birth weight.
that the association remained after adjusting for potential con- founders. We also conducted an analysis with continuous val- ues of one quartile change. We performed this analysis using the original height value (cm); the relationships between short- er maternal height and LBW were also found in both of these analyses (P < 0.01).
Maternal height and NICU admission
With regard to the risk of NICU admission, crude ORs with 95%
CIs were estimated using logistic regression (model 1, Table 4).
The shortest maternal height quartile (Q1) and the second short- est maternal height quartile (Q2) were related to NICU admis- sion (1.47 [1.27, 1.69] and 1.17 [1.02, 1.35], respectively). How- ever, maternal height of the Q3 group was not related to NICU admission. In model 2, adjusted ORs and 95% CIs between ma- ternal height of Q1 and Q2 and NICU admission remained re- lated (1.48 [1.27, 1.71] and 1.20 [1.04, 1.39], respectively); how- ever, no relationship was found for Q3.
Model 3 was conducted to investigate the relationship between maternal height and NICU admission. When the model was
adjusted for LBW, the ORs between maternal height in Q1, Q2, and Q3 and NICU admission were decreased, and there was no relationship between maternal height and NICU admission.
DISCUSSION
The current study found that among mothers who had full-term births (birth after the 37th gestational week), shorter maternal height was associated with LBW. This relationship was stronger among the quartile of mothers with the shortest height. A rela- tionship between maternal height and NICU admission was also found in this study. However, this relationship was fully at- tenuated when the statistical model was adjusted for LBW. There- fore, LBW is involved in the relationship between maternal hei- ght and NICU admission. The relationship between maternal height and LBW was strong. This finding suggests that smaller newborns are more likely to be admitted to NICU and that the association between maternal height and NICU admission is not direct.
Witter and Luke (5) reported that shorter women are more likely to have smaller newborns than taller women. This previ- ous study was conducted with participants in the United States;
the results are consistent with our study results. Wills et al. (4) demonstrated a relationship between parental height and fetal growth in the United Kingdom. However, there was no clear as- sociation between maternal height and lower birth weight. Nu- tritional status is similar in these three countries; food supplies in the United States, the United Kingdom, and Japan are stable at the national level. Therefore, shorter height may not be a proxy for undernutrition; rather, it is more influenced by heritable fac- tors or other environmental factors.
Mothers who are short in height may have a narrow pelvis, resulting in limited intrauterine space. This may restrict intra- uterine fetal growth (17-19). Differences in the size of the pelvis depend on differences in individual body size, and this mecha- nism may be common in any setting. However, this is insuffi- Table 3. Adjusted odds ratios and confidence intervals for the relationship between
maternal height and LBW (n = 17,150)
Maternal height LBW
OR 95% CI P value
Continuous (cm) 0.95 0.94 0.96 < 0.01
Continuous (Q1- Q4) 0.80 0.76 0.84 < 0.01
Q1 (131.00-151.99 cm) 2.00 1.71 2.34 -
Q2 (152.00-157.99 cm) 1.33 1.13 1.57 -
Q3 (158.00-160.99 cm) 1.20 1.01 1.43 -
Q4 (161.00-181.00 cm, reference) - - - -
The model adjusted for maternal age, maternal BMI at baseline (BMI before pregnan- cy), maternal smoking habits, maternal alcohol habits, and maternal occupation sta- tus (the ORs and CIs for the covariates are not shown). Maternal age was entered into the model in 2 ways: (1) individual age minus the mean age of the group and (2) (individual age minus the mean age of the group)2. Q, quartile; NICU, neonatal inten- sive care unit; LBW, low birth weight; SGA, small for gestational age; OR, odds ratio;
CI, confidence interval.
Table 4. Odds ratios and confidence intervals for the relationship between maternal height and NICU admission in 3 models (n = 17,150) Parameters
NICU admission
Model 1 Model 2 Model 3
OR 95% CI OR 95% CI OR 95% CI
Maternal height Q1 (131.00-151.99 cm) Q2 (152.00-157.99 cm) Q3 (158.00-160.99 cm) Q4 (161.00-181.00 cm, reference)
1.47 1.17 1.05 -
1.27 1.02 0.91 -
1.69 1.35 1.22 -
1.48 1.20 1.07 -
1.27 1.04 0.92 -
1.71 1.39 1.25 -
1.17 1.10 1.02 -
0.99 0.94 0.86 -
1.37 1.29 1.20 - LBW
No (reference) Yes
- -
- -
- -
- -
- -
- -
- 15.44
- 13.53
- 17.61 Model 1: maternal height adjusted for maternal age. Model 2: maternal height adjusted for maternal age, maternal BMI at baseline (BMI before pregnancy), maternal smoking habits, maternal alcohol habits, and maternal occupation status. Model 3: in addition to model 2, adjusted for LBW. Maternal age was entered into each model in 2 ways: (1) in- dividual age minus the mean age of the group and (2) (individual age minus the mean age of the group)2. In model 3, the ORs and CIs for covariates are not shown (with the exception of LBW). Q, quartile; NICU, neonatal intensive care unit; LBW, low birth weight; SGA, small for gestational age; OR, odds ratio; CI, confidence interval.
cient to explain the mechanism of the relationship between ma- ternal height and LBW. There may be other reasons why the growth of newborns is restricted.
One strength of our study is that we investigated all of the de- liveries at one hospital during the period of 1997 to 2010 and had more than 17,000 participants, which may reduce selection bias. Furthermore, the large sample size should provide suffi- cient power to detect clinically relevant associations. Another strength is that the definition of LBW (birth weight < 2,500 g) is common and easy to compare with other study results. Addi- tionally, the measurement of maternal height and LBW rarely induce misclassifications because of accurate measurement tools for body size in Japan; this advantage expands the compa- rability of our study results.
There were also some limitations. First, this study was con- ducted using a dataset from one regional hospital in Japan, Seirei Hamamatsu General Hospital. Additionally, the hospital pro- vides advanced medical intervention and typically accepts high- risk pregnant women and patients in emergency situations. This situation can cause bias. Therefore, the generalizability of this study is limited. Second, NICU admission was a substitute indi- cator of poor birth outcome (i.e., poor condition of newborns).
The reasons for NICU admission are varied and may differ at the hospital/institute level or physician level. This leads to non- differential misclassification, with odds ratios toward the null value. However, there is no exact classification for the indica- tion of NICU admission. Therefore, this misclassification could happen by chance in any setting and would not cause signifi- cant bias. Third, the Japanese universal health care system is unique, and each country has different health insurance options for maternity care. However, we could not consider the effect of health insurance in this study. Furthermore, we did not consid- er the effect of undernutrition alone in this study because Japan is a developed country with a stable food supply. Generally, un- dernutrition status is related to household income (i.e., low-in- come status in Japan); other reasons for undernutrition involve individual diseases, including gastrointestinal disease, cancer, and eating disorders. However, we did not obtain information on household income or disease status. Only occupational sta- tus was used as a measurement of SES. Additionally, informa- tion regarding dietary habits was not collected in this study. Thus, we could not consider the effect of these variables related to in- dividual nutrition status. Therefore, we could not draw conclu- sions about the effects of short stature on birth weight or nutri- tional status.
In conclusion, our findings may suggest that being born small in Japan is more reflective of genetics/biology than social fac- tors such as nutrition status. Shorter mothers in developed coun- tries (who are likely not short due to nutritional deficits) provide a useful prenatal target to anticipate and plan for subsequent LBW and NICU admission. Maternal height as a screening mea-
surement may become a useful indicator in developed and de- veloping countries.
DISCLOSURE
The authors have no potential conflicts of interest to disclose.
AUTHOR CONTRIBUTION
Conception and design of study: Inoue S, Yorifuji T. Data collec- tion: Naruse H, Murakoshi T, Doi H. Analysis of data: Inoue S, Yorifuji T. Writing the first draft: Inoue S. Manuscript revision:
Inoue S, Naruse H, Yorifuji T, Naruse H, Kato T, Murakoshi T.
Agreement with manuscript results and conclusions: all authors.
ORCID
Sachiko Inoue http://orcid.org/0000-0003-1840-5631 Hiroo Naruse http://0000-0002-9424-0616
Takashi Yorifuji http://orcid.org/0000-0003-2543-5441 Tsuguhiko Kato http://orcid.org/0000-0002-6009-7962 Takeshi Murakoshi http://orcid.org/0000-0003-3212-1782 Hiroyuki Doi http://orcid.org/0000-0002-1485-6825 SV Subramanian http://orcid.org/0000-0003-2365-4165 REFERENCES
1. Jananthan R, Wijesinghe DG, Sivananthewerl T. Maternal anthropometry as a predictor of birth weight. Trop Agric Res 2009; 21: 89-98.
2. Kramer MS. The epidemiology of adverse pregnancy outcomes: an over- view. J Nutr 2003; 133: 1592S-15926S.
3. Ozaltin E, Hill K, Subramanian SV. Association of maternal stature with offspring mortality, underweight, and stunting in low- to middle-income countries. JAMA 2010; 303: 1507-16.
4. Wills AK, Chinchwadkar MC, Joglekar CV, Natekar AS, Yajnik CS, Fall CH, Kinare AS. Maternal and paternal height and BMI and patterns of fetal growth: the Pune Maternal Nutrition Study. Early Hum Dev 2010; 86: 535- 40.
5. Witter FR, Luke B. The effect of maternal height on birth weight and birth length. Early Hum Dev 1991; 25: 181-6.
6. Ministry of Health, Labour and Welfare (JP). The National Health and Nu- trition Survey: 2010. Available at http://www.mhlw.go.jp/stf/houdou/
2r98520000020qbb.html.
7. Organisation for Economic Co-operation and Development. Trends in low birth weight infants, selected OECD countries, 1980-2007. In: Health at a Glance 2009: OECD Indicators. Paris: OECD Publishing, 2009, p33.
8. Inoue S, Naruse H, Yorifuji T, Murakoshi T, Doi H, Kawachi I. Who is at risk of inadequate weight gain during pregnancy? Analysis by occupa- tional status among 15,020 deliveries in a regional hospital in Japan. Ma- tern Child Health J 2013; 17: 1888-97.
9. Takimoto H, Sugiyama T, Fukuoka H, Kato N, Yoshiike N. Maternal weight gain ranges for optimal fetal growth in Japanese women. Int J Gynaecol
Obstet 2006; 92: 272-8.
10. Tsukamoto H, Fukuoka H, Inoue K, Koyasu M, Nagai Y, Takimoto H. Re- stricting weight gain during pregnancy in Japan: a controversial factor in reducing perinatal complications. Eur J Obstet Gynecol Reprod Biol 2007;
133: 53-9.
11. Subramanian SV, Ackerson LK, Davey Smith G, John NA. Association of maternal height with child mortality, anthropometric failure, and anemia in India. JAMA 2009; 301: 1691-701.
12. Kashima S, Naruse H, Yorifuji T, Ohki S, Murakoshi T, Takao S, Tsuda T, Doi H. Residential proximity to heavy traffic and birth weight in Shizuo- ka, Japan. Environ Res 2011; 111: 377-87.
13. Yorifuji T, Naruse H, Kashima S, Murakoshi T, Kato T, Inoue S, Doi H, Kawa- chi I. Trends of preterm birth and low birth weight in Japan: a one hospi- tal-based study. BMC Pregnancy Childbirth 2012; 12: 162.
14. Yorifuji T, Naruse H, Kashima S, Murakoshi T, Tsuda T, Doi H, Kawachi I.
Residential proximity to major roads and placenta/birth weight ratio. Sci
Total Environ 2012; 414: 98-102.
15. Wilcox AJ. On the importance--and the unimportance--of birthweight.
Int J Epidemiol 2001; 30: 1233-41.
16. Mikami S, Hamano T, Fujii N, Nagasawa Y, Isaka Y, Moriyama T, Matsuhi- sa M, Ito T, Imai E, Hori M. Serum osteoprotegerin as a screening tool for coronary artery calcification score in diabetic pre-dialysis patients. Hy- pertens Res 2008; 31: 1163-70.
17. Subramanian SV, Özaltin E, Finlay JE. Height of nations: a socioeconomic analysis of cohort differences and patterns among women in 54 low- to middle-income countries. PLoS One 2011; 6: e18962.
18. Maternal anthropometry and pregnancy outcomes. A WHO Collabora- tive Study. Bull World Health Organ 1995; 73 Suppl: 1-98.
19. Zhang X, Cnattingius S, Platt RW, Joseph KS, Kramer MS. Are babies born to short, primiparous, or thin mothers “normally” or “abnormally” small?
J Pediatr 2007; 150: 603-7.