Three Dimensional Characteristics of the Airflow in Unidirectional Vehicle Tunnels
Sang Hyun Kim, Doo Young Kim, Pan Gyu Choi, Chang Woo Lee (Dong-A University)-
Abstract
Airflow distributions along tunnel and over the cross section are critical in selecting installation location of the velocity monitor to obtain the representative data for ventilation as well as fire safety systems. This paper aims at performing CFD and on-site studies to analyze the longitudinal and cross- sectional distributions of the air velocity in tunnels employing longitudinal and semi-transversal ventilation systems. This study can ultimately contribute to selecting the monitor type as well as the optimal installation locations in vehicle tunnel.
1. INTRODUCTION
Since typical flow patterns observed in unidirectional vehicle tunnels are transient pseudo-steady state flow fluctuating due to traffic speed and volumes, airflow distribution does not seem to be uniform along the tunnel axis as well as over the cross section. In most of the cases it is mandatory to have the velocity monitors installed for measuring the airflow direction and velocity. The measurements are critical in controlling airflow rate and subsequently pollution level inside the tunnels, while the data from monitors are essential in securing the airflow velocity to prevent the backlayering phenomenon in case of a tunnel fire. Therefore, the monitors should provide accurate representative values over the cross section. The monitors are usually installed to obtain the air velocities measured either over the line across the cross section or at a fixed location close to the tunnel wall. To find an appropriate location for the airflow monitor and measure the accurate representative velocity data, it is required to understand the three dimensional airflow distribution in tunnels.
This paper aims at analyzing the airflow distribution along the axis and over the cross section through the CFD method as well as the on-site studies.
한국암반공학회 국제학술회의
2008 / 2008.10.21 - 10.23
2. CFD Analysis
Selection of the monitor location along the tunnel axis is affected by the jet stream generated by the jet fan. Its influence should be avoided since the measurements are likely to be deviated from the representativeness. FLUENT is applied to the model tunnel described in Table 1. As shown, 8 jet fans are installed at intervals of 180 meters with two fans on the same cross section. The jet fans have specifications found in typical tunnel ventilation and smoke extraction fans.
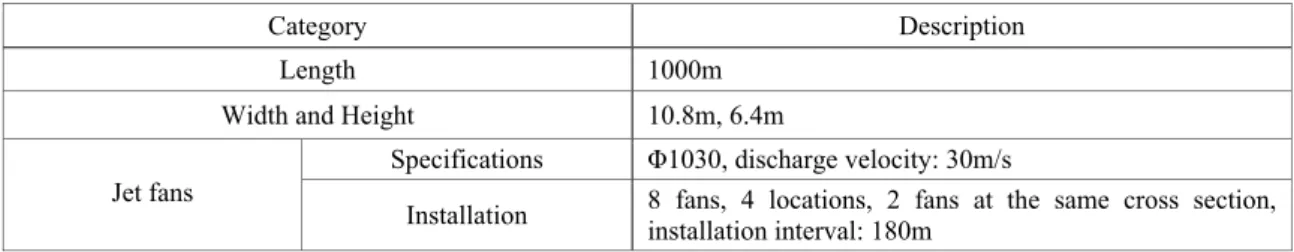
Table 1. The Target Tunnel Description
Category Description Length 1000m
Width and Height 10.8m, 6.4m
Specifications Φ1030, discharge velocity: 30m/s Jet fans
Installation 8 fans, 4 locations, 2 fans at the same cross section, installation interval: 180m
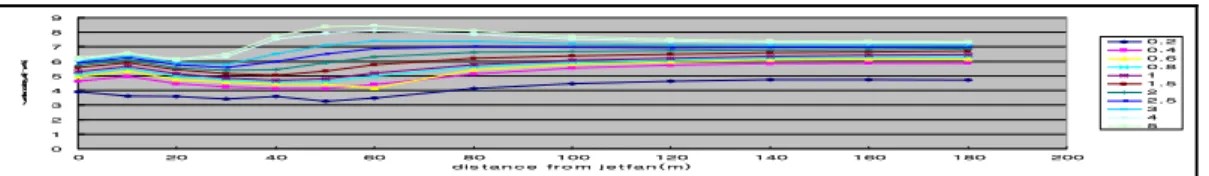
The following Fig. 1 shows the flow velocities along the tunnel over the cross section cut at the height of 3.4m parallel to the road surface. Cross-sectional patterns near the wall vary with the distance from jet fans and become uniform at approximately 145 meters downstream, while axial distribution reaches uniformity at about 200 meters from fans.
Fig. 1 Air flow Distribution along the Tunnel during Jet Fan Operation
Fig. 2-a delineates the results against the distance from the wall, while Fig. 2-b arranges the same output against the distance from the fans. The figures show that once the airflow reaches beyond 140m downstream of the fans and out of the influence of jet stream, the air velocity does not change significantly; it varies within 1m/s in the range of 40cm to 2.5m from the wall.
0 1 2 3 4 5 6 7 8 9
0 1 2 3 4 5 6
dis t a n c e f r o m w a ll( m)
velocity(m/s)
0 10 20 30 40 50 60 80 100 120 140 160 180
a. Velocity against the Distance from the Wall
0 1 2 3 4 5 6 7 8 9
0 20 40 60 80 100 120 140 160 180 200
d is t a n c e fr o m j e t fa n ( m)
velocity(m/s)
0.2 0.4 0.6 0.8 1 1.5 2 2.5 3 4 5
b. Velocity against the Distance from the Jet Fans
Fig. 2 Velocity Variation from the Wall over the Cross Section
A cross section cut vertically at distance of 30cm from the wall and at height of 3.4m is shown in Fig. 3.
Fig. 4-a shows velocities along the height, while velocity variation with the distance from fans is displayed in Fig. 4-b. Even though air velocity varies considerably with the height, velocity remains almost constant in the range of 0.6 and 3.6m from the bottom. Also it shows that velocity distribution near the wall becomes uniform beyond approximately 145m downstream of the jet fans.
Fig. 3 Velocity Profile by Height
0 1 2 3 4 5 6 7
0 0.5 1 1.5 2 2.5 3 3.5 4
h igh t ( m)
velocity(m/s)
5 31.5 56.5 81 108 132.5 157 182 206.5
a. Variation by distance from the jet fans
0 1 2 3 4 5 6 7
0 50 100 150 200 250
dis t a n c e f r o m j e t f a n ( m)
velocity(m/s)
0.4 0.6 1 1.5 2 2.5 3 3.4 3.6 3.8
b. Variation by distance from the wall Fig. 4 Velocity variation with height
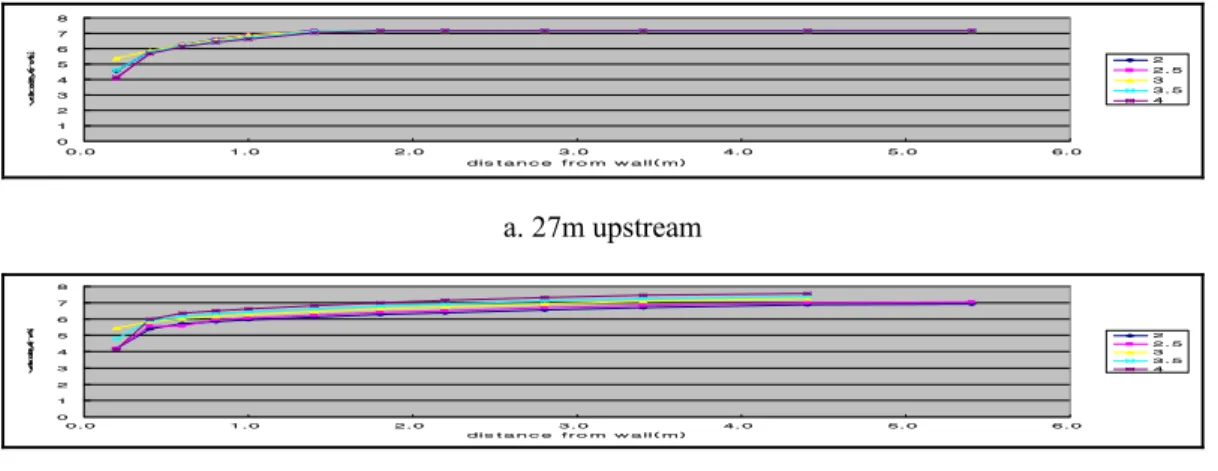
Fig. 5-a, b and c include the velocity profiles at 27m upstream, 145m downstream and 197m downstream of the jet fans. Zones with higher velocities are more or less centered in case of the upstream location.
a. 27m upstream b. 145m downstream c. 197m downstream Fig. 5 Velocity Profiles by Distance from the Jet fans
0 1 2 3 4 5 6 7 8
0.0 1.0 2.0 3.0 4.0 5.0 6.0
dis t a n c e fr o m w a ll( m)
velocity(m/s)
2 2.5 3 3.5 4
a. 27m upstream
0 1 2 3 4 5 6 7 8
0.0 1.0 2.0 3.0 4.0 5.0 6.0
dis t a n c e f r o m w a ll( m)
velocity(m/s)
2 2.5 3 3.5 4
b. 145m downstream
Fig. 6 Near-Wall Velocity Variation by Height
Fig. 5-a and b summarize the velocity variation by the distance from the wall on the vertical plane.
These results confirm the previous findings which were depicted in Fig. 4. Therefore, it is concluded that regardless of height above the road surface, the air velocity varies insignificantly in the range of 0.4 to 2m from the wall. In the tunnels open to traffic, outside this range toward the center the velocity is almost constant over the cross section due to the moving vehicles.
3. On-Site Study
A series of studies had been carried out at five different tunnels whose descriptions are made in Table 2.
The experiment was designed to study the three directional velocity variation with two 3-D velocity monitors, while measurements by ultrasonic velocity meters in tunnels were used for comparison purpose and traffic data were provided by the tunnel operators.
Table 2. On-site Study Tunnels
Installation Locations for the
Tunnel Type Length
(m) Case 1 Case 2 Ventilation system
Jangsung Highway 3450 668 3200 * Longitudinal (jet fan)
Pibanryong Highway 2040 100 1940 * Longitudinal (jet fan)
Sujungsan Urban 2356 400 1956 900 1456 Longitudinal (EP, jet fan)
Baekyangsan Urban 2340 300 2040 800 1240 Semi-transverse
Imgo-4 Highway 1667 780 * Longitudinal (jet fan)
3.1 Variation along the tunnel
In most of the long tunnels, two locations, usually one near the entrance and the other near the exit portal, are selected for velocity meters. Discrepancy between their measurements can generate serious results in case of a fire. To prevent the backlayering phenomenon, representative data have to be monitored from the meters. In this study, two velocity monitors were installed at the locations described in Table 2. Two sets of experiments were performed with one at 20% and 80% of the tunnel length and the other at 30% and 60%.
A. Jangsung Tunnel
Fig. 7 shows the variation of the measurements made at 668m and 3200m locations in the 3450m-long tunnel.
-4 -3 -2 -1 0 1 2 3 4 5 6 7
0:010:431:252:072:493:314:134:555:376:197:017:438:259:079:4910:3111:1311:5512:3713:1914:0114:4315:2516:0716:4917:3118:1318:5519:3720:1921:0121:4322:2523:0723:490:311:131:552:373:194:014:435:256:076:497:318:138:559:3710:1911:0111:4312:2513:0713:4914:3115:1315:5516:3717:1918:0118:4319:2520:0720:4921:3122:1322:5523:370:191:011:432:253:073:494:315:135:556:377:198:018:439:2510:0710:4911:3112:1312:5513:3714:1915:0115:4316:2517:0717:4918:3119:1319:5520:3721:1922:0122:4323:250:070:491:312:132:553:374:195:015:436:257:077:498:319:139:5510:3711:1912:0112:4313:2514:0714:4915:3116:1316:5517:3718:1919:0119:4320:2521:0721:4922:3123:1323:550:371:192:012:433:254:074:495:316:136:557:378:199:01
Time
Velocity(m/s)
Enterance Exit
a. Velocity Profiles at Two Locations
-0.8 -0.6 -0.4 -0.2 0 0.2 0.4 0.6
0:010:431:252:072:493:314:134:555:376:197:017:438:259:079:4910:3111:1311:5512:3713:1914:0114:4315:2516:0716:4917:3118:1318:5519:3720:1921:0121:4322:2523:0723:490:311:131:552:373:194:014:435:256:076:497:318:138:559:3710:1911:0111:4312:2513:0713:4914:3115:1315:5516:3717:1918:0118:4319:2520:0720:4921:3122:1322:5523:370:191:011:432:253:073:494:315:135:556:377:198:018:439:2510:0710:4911:3112:1312:5513:3714:1915:0115:4316:2517:0717:4918:3119:1319:5520:3721:1922:0122:4323:250:070:491:312:132:553:374:195:015:436:257:077:498:319:139:5510:3711:1912:0112:4313:2514:0714:4915:3116:1316:5517:3718:1919:0119:4320:2521:0721:4922:3123:1323:550:371:192:012:433:254:074:495:316:136:557:378:199:01
Time
Velocity Differences(m/s
b. Velocity Differences
0 2 4 6 8 10 12 14 16 18
0:010:431:252:072:493:314:134:555:376:197:017:438:259:079:4910:3111:1311:5512:3713:1914:0114:4315:2516:0716:4917:3118:1318:5519:3720:1921:0121:4322:2523:0723:490:311:131:552:373:194:014:435:256:076:497:318:138:559:3710:1911:0111:4312:2513:0713:4914:3115:1315:5516:3717:1918:0118:4319:2520:0720:4921:3122:1322:5523:370:191:011:432:253:073:494:315:135:556:377:198:018:439:2510:0710:4911:3112:1312:5513:3714:1915:0115:4316:2517:0717:4918:3119:1319:5520:3721:1922:0122:4323:250:070:491:312:132:553:374:195:015:436:257:077:498:319:139:5510:3711:1912:0112:4313:2514:0714:4915:3116:1316:5517:3718:1919:0119:4320:2521:0721:4922:3123:1323:550:371:192:012:433:254:074:495:316:136:557:378:199:01 Time
Traffic rate(veh/min
c. Traffic Rate
Fig. 7 Distribution of Velocity and Traffic Rate at Jansung Tunnel
Table 3 shows simple statistics and the mean value of the velocity differences is 0.05m/s. The two data sets are divided into two groups by the traffic rate, are paired and their differences are tested through t-test by the group. The results show as in Table 4 there is no difference between the two locations and its dependency on the traffic rate is not significant either.
Table 3. Simple Statistics for Jansung Tunnel
Near the Entrance Near the Exit Velocity Difference
Max 5.60 5.60 0.40
Min -3.00 -2.90 -0.60
Mean 1.94 1.99 -0.05
Std 1.62 1.60 0.12
C.V 0.83 0.80 -2.22
Table 4.. Results of t-test for Jansung Tunnel Group 1: Traffic Rate (1~5 veh/min)
Entrance Measurements Exit Measurements
Mean (m/s) 2.19 2.26
S.D. 1.93 1.90
Obs 3608 d.f. 7214 t statistics -1.90
Result Difference insignificant Group 2: Traffic Rate (>5 veh/min)
Entrance Measurements Exit Measurements
Mean (m/s) 2.89 3.00
S.D. 0.86 0.88
Obs 460 d.f. 918 t statistics -1.86
Result Difference insignificant
B. Pibanryong Tunnel
The measurements made at 100m and 1940m in 2040m-long Pibanryong tunnel are analyzed in the same way as in Jansung Tunnel. The statistical results conclude that there is no significant discrepancy between the two locations, and the traffic rate does not influence the difference considerably.
0 2 4 6 8 10 12
1:001:281:562:252:543:243:534:224:525:215:516:206:497:197:488:188:479:169:4610:0710:2110:4811:1611:4412:1212:4013:0813:3614:0414:3215:0015:2815:5616:2416:5217:2017:4818:1618:4419:1219:4020:0820:3621:0421:3222:0022:2822:5623:2423:520:200:481:161:442:122:403:083:364:044:325:005:285:566:246:527:207:488:168:449:129:4010:1210:4011:0811:3612:0412:3213:0013:2813:5614:2414:5215:2015:4816:1616:4417:1217:4018:0818:3619:0419:3220:0020:2820:5621:2421:5222:2022:4823:1623:440:120:401:081:362:042:323:003:283:564:244:525:205:486:166:447:127:408:088:369:049:3210:0010:2810:5611:2411:5212:2012:4813:1613:4414:1214:4015:0815:3616:0416:3217:0017:2817:5618:2418:5219:2019:4820:1620:4421:1221:4022:0822:3623:0423:32 Ti me
Velocity(m/s)
Entrance Exit
a. Velocity Profiles at Two Locations
-1 -0.8 -0.6 -0.4 -0.2 0 0.2 0.4 0.6 0.8 1
1:001:281:562:252:543:243:534:224:525:215:516:206:497:197:488:188:479:169:4610:0710:2110:4811:1611:4412:1212:4013:0813:3614:0414:3215:0015:2815:5616:2416:5217:2017:4818:1618:4419:1219:4020:0820:3621:0421:3222:0022:2822:5623:2423:520:200:481:161:442:122:403:083:364:044:325:005:285:566:246:527:207:488:168:449:129:4010:1210:4011:0811:3612:0412:3213:0013:2813:5614:2414:5215:2015:4816:1616:4417:1217:4018:0818:3619:0419:3220:0020:2820:5621:2421:5222:2022:4823:1623:440:120:401:081:362:042:323:003:283:564:244:525:205:486:166:447:127:408:088:369:049:3210:0010:2810:5611:2411:5212:2012:4813:1613:4414:1214:4015:0815:3616:0416:3217:0017:2817:5618:2418:5219:2019:4820:1620:4421:1221:4022:0822:3623:0423:32
Time
Velocity difference(m/s
b. Velocity Differences
0 5 10 15 20 25 30
1:001:281:562:242:523:203:484:164:445:125:406:086:367:047:328:008:288:569:249:5210:2010:4811:1611:4412:1212:4013:0813:3614:0414:3215:0015:2815:5616:2416:5217:2017:4818:1618:4419:1219:4020:0820:3621:0421:3222:0022:2822:5623:2423:520:200:481:161:442:122:403:083:364:044:325:005:285:566:246:527:207:488:168:449:129:4010:0810:3611:0411:3212:0012:2812:5613:2413:5214:2014:4815:1615:4416:1216:4017:0817:3618:0418:3219:0019:2819:5620:2420:5221:2021:4822:1622:4423:1223:400:080:361:041:322:002:282:563:243:524:204:485:165:446:126:407:087:368:048:329:009:289:5610:2410:5211:2011:4812:1612:4413:1213:4014:0814:3615:0415:3216:0016:2816:5617:2417:5218:2018:4819:1619:4420:1220:4021:0821:3622:0422:3223:0023:28 Time
Traffic rate(veh/min
c. Traffic Rate
Fig. 8 Distribution of Velocity and Traffic Rate at Pibanryong Tunnel
Table 5. Simple Statistics for Pibanryong Tunnel
Near the Entrance Near the Exit Velocity Difference
Max 9.6 9.8 0.8
Min 1.8 2.1 -0.8
Mean 6.24 6.24 0.003
S.D. 1.24 1.21 0.19
C.V 0.20 0.19 58.8
Table 6. Results of t-test for Pibanryong Tunnel Group 1: Traffic Rate (1~5 veh/min)
Entrance Measurements Exit Measurements Mean (m/s) 5.95 5.98
Variance 1.79 1.78
Obs 1818 d.f. 3634 t statistics -0.82
Result Difference insignificant Group 2: Traffic Rate (5~10 veh/min)
Entrance Measurements Exit Measurements Mean (m/s) 6.52 6.49
Variance 1.10 1.06
Obs 1703 d.f. 3404 t statistics 0.92
Result Difference insignificant Group 3: Traffic Rate (>10 veh/min)
Entrance Measurements Exit Measurements Mean (m/s) 6.59 6.53
Variance 1.01 0.97
Obs 568 d.f. 1234 t statistics 1.14
Result Difference insignificant
C. Sujungsan Tunnel
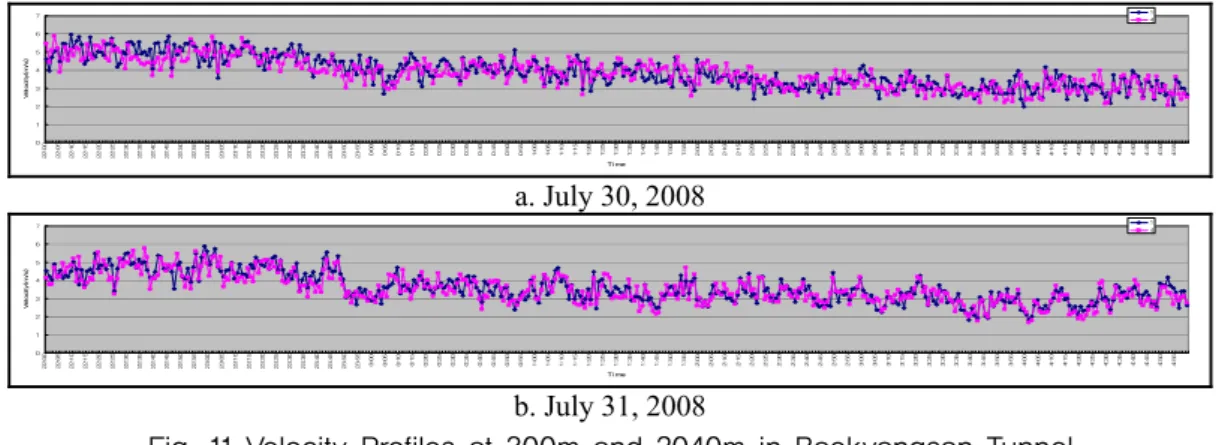
Fig. 9 shows the velocity distributions at two locations, 400m and 1956m in 2356m-long tunnel, while two figures are from the measurements made on different days, while Fig. 10 describes the velocity profiles of the measurements from 900m and 1456m. Table 7 includes the results of t-test for the group means. It concludes that as in the previous tunnels, there can not be found any significant discrepancy between the measurements made at two locations.
-1 0 1 2 3 4 5 6 7
22:00 22:05 22:10 22:15 22:20 22:25 22:30 22:35 22:40 22:45 22:50 22:55 23:00 23:05 23:10 23:15 23:20 23:25 23:30 23:35 23:40 23:45 23:50 23:55 0:00 0:05 0:10 0:15 0:20 0:25 0:30 0:35 0:40 0:45 0:50 0:55 1:00 1:05 1:10 1:15 1:20 1:25 1:30 1:35 1:40 1:45 1:50 1:55 2:00 2:05 2:10 2:15 2:20 2:25 2:30 2:35 2:40 2:45 2:50 2:55 3:00 3:05 3:10 3:15 3:20 3:25 3:30 3:35 3:40 3:45 3:50 3:55 4:00 4:05 4:10 4:15 4:20 4:25 4:30 4:35 4:40 4:45 4:50 4:55 Ti me
Velocity(m/s)
1 4
a. Measurements on July 23, 2008
-1 0 1 2 3 4 5
22:00 22:05 22:10 22:15 22:20 22:25 22:30 22:35 22:40 22:45 22:50 22:55 23:00 23:05 23:10 23:15 23:20 23:25 23:30 23:35 23:40 23:45 23:50 23:55 0:00 0:05 0:10 0:15 0:20 0:25 0:30 0:35 0:40 0:45 0:50 0:55 1:00 1:05 1:10 1:15 1:20 1:25 1:30 1:35 1:40 1:45 1:50 1:55 2:00 2:05 2:10 2:15 2:20 2:25 2:30 2:35 2:40 2:45 2:50 2:55 3:00 3:05 3:10 3:15 3:20 3:25 3:30 3:35 3:40 3:45 3:50 3:55 4:00 4:05 4:10 4:15 4:20 4:25 4:30 4:35 4:40 4:45 4:50 4:55 Ti me
Velocity(m/s)
1 4
b. Measurements on July 24, 2008
Fig. 9 Velocity Profiles at 400m and 1956m in Sujungsan Tunnel
Table 7. Results of t-test for Sujungsan Tunnel
Measurements at 400m Measurements at 1956m Measurements at 900m Measurements at 1456m
July 23, 2008 July 25, 2008
Mean (m/s) 2.09 2.14 2.27 2.21 S.D. 1.44 1.17 0.84 0.75
Obs 419 419
d.f. 836 836
t statistics -0.69 0.94
Result Difference insignificant Difference insignificant July 24, 2008 July 26, 2008
Mean (m/s) 2.17 2.20 2.25 2.21 S.D. 1.14 0.90 0.61 0.49
Obs 419 419
d.f. 836 836
t statistics -0.48 0.86
Result Difference insignificant Difference insignificant
-1 0 1 2 3 4 5
22:00 22:05 22:10 22:15 22:20 22:25 22:30 22:35 22:40 22:45 22:50 22:55 23:00 23:05 23:10 23:15 23:20 23:25 23:30 23:35 23:40 23:45 23:50 23:55 0:00 0:05 0:10 0:15 0:20 0:25 0:30 0:35 0:40 0:45 0:50 0:55 1:00 1:05 1:10 1:15 1:20 1:25 1:30 1:35 1:40 1:45 1:50 1:55 2:00 2:05 2:10 2:15 2:20 2:25 2:30 2:35 2:40 2:45 2:50 2:55 3:00 3:05 3:10 3:15 3:20 3:25 3:30 3:35 3:40 3:45 3:50 3:55 4:00 4:05 4:10 4:15 4:20 4:25 4:30 4:35 4:40 4:45 4:50 4:55 Ti me
Velocity(m/s)
2 3
a. Measurements on July 25, 2008
0 0.5 1 1.5 2 2.5 3 3.5 4 4.5 5
22:00 22:05 22:10 22:15 22:20 22:25 22:30 22:35 22:40 22:45 22:50 22:55 23:00 23:05 23:10 23:15 23:20 23:25 23:30 23:35 23:40 23:45 23:50 23:55 0:00 0:05 0:10 0:15 0:20 0:25 0:30 0:35 0:40 0:45 0:50 0:55 1:00 1:05 1:10 1:15 1:20 1:25 1:30 1:35 1:40 1:45 1:50 1:55 2:00 2:05 2:10 2:15 2:20 2:25 2:30 2:35 2:40 2:45 2:50 2:55 3:00 3:05 3:10 3:15 3:20 3:25 3:30 3:35 3:40 3:45 3:50 3:55 4:00 4:05 4:10 4:15 4:20 4:25 4:30 4:35 4:40 4:45 4:50 4:55 Ti me
Velocity(m/s)
2 3
b. Measurements on July 26, 2008
Fig. 10 Velocity Profiles at 900m and 1456m in Sujungsan Tunnel