1. INTRODUCTION1)
Competition occurs for resources: quantities of matter or energy for survival, growth or reproduction that are
†To whom correspondence should be addressed.
Department of Herbal Biotechnology, Daegu Haany University E-mail: [email protected]
consumed by organisms (Pugnaire and Valladares, 1999).
Most plants, due to their immobility, are affected by (Daejong, 1987) and interfere with activities of neighboring plants (Mark and Harper, 1977). Trees in forests protect one another against winds, storms and other environmental disturbances, while competing for light, water, nutrients, growing space (Kramer, 1988). Competition among trees occurs in the name of interactions among each tree in order to occupy the limited
19 years of change in community structure of Quercus acutissima dominant stand on Mt. Danseok-san in Gyeongju national park, South Korea
Ko, Jae Ki†
Department of Herbal Biotechnology, Daegu Haany University
경주 단석산 상수리나무 우점식분 군집구조의 19년간의 변화
고재기†
대구한의대학교 힐링산업학부 한약개발학전공
(Received : 01 August 2018, Revised: 12 August 2018, Accepted: 12 August 2018)
Abstract
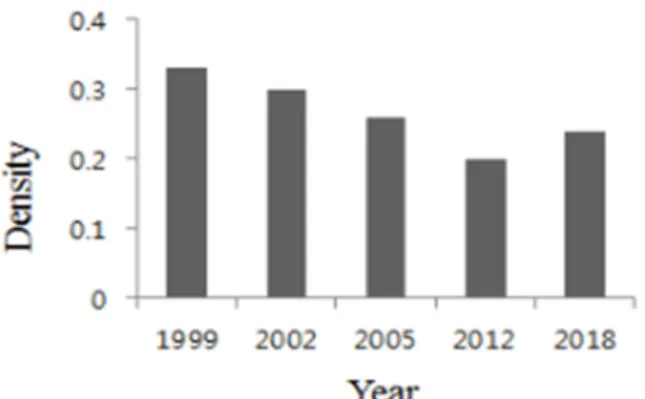
This study was carried out to clarify changes in community structure of Quercus acutissima dominant stand on the south slope of Mt. Danseok-san with fixed twenty quadrates. Five field surveys were conducted from Aug. 1999 to May 2018. During the period, the density lessened to 0.20 in 2012 comparing with 0.33 in 1999. However recent field study in 2018 showed moderate rising to 0.24. In 1999, the DBH class distribution of all trees formed reverse J curve.
However, the reverse J curve was torn down, forming bell curve. In 2018, the curve showed similar shape of reverse J shape on the group of young trees, forming bell shape on the group of mature trees. It reveals that DBH 13cm is on the threshold of trees competition trend where the downtrend in the trees are on uptrend. The most dominant Q.
acutissima formed bell curve. The peak of the curve shows the shift to the right of the graph as it gets lower by year.In case of Q. mongolica, shows a change in the shape of a low bell as the distribution curve increases. The oak stand in this study is in the process of changing from the initial stage of the secondary forest succession to the intermediate stage. The most dominant tree is Q. acutissima, and the sub-dominant tree is Q. mongolica in present.
Considering the age distribution of the two competing tree species, the succession of this stand is expected to transfer to the Q. mongolica-dominant community.
Key words : Basal area, competition, DBH class distribution, density, succession
요 약
본 연구는 경주 단석산 상부 남사면의 상수리나무 우점 식분의 군집구조 변화를 파악하기 위하여 고정 방형구 20개를 설치하고 1999년부터 2018년까지 5회의 매목조사를 실시하였다. 밀도는 1999년에 0.33에서 2012년에 0.20으로 감소하였으나 2018년에는 0.24로 다소 증가하였다. 전체 수목의 흉고직경계분포를 보면, 1999년에는 역J자 유사한 모양의 분포를 나타내었으나 그 후 분포가 변화되어 2018년에는 어린 개체들에서는 역J자 모양이, 성숙한 개체들에서는 종 모양이 나타나 전체적으로는 두 곡선이 연결된 형태의 분포를 나타내었다. 흉고직경 13cm이하에서는 수목들의 경쟁이 심하였으나 그 이상에서는 완화되는 것으로 나타났다.
최우점종인 상수리나무의 흉고직경계 분포는 종 모양의 분포를 보였고, 시간이 지남에 따라 흉고직경이 큰 쪽으로 분포가 이동하지만 개체수는 줄어들었고, 신갈나무는 낮은 종 모양의 분포가 점점 높아지는 변화를 보였다. 흉고직경계분포의 변화로 볼 때, 단석산의 상수리나무 식분은 이차천이의 초기 단계에서 중간 단계로 삼림천이가 진행 중인 것으로 판단이 되며, 현재 본 식분의 최우점종은 상수리나무이고 준우점종은 신갈나무이지만, 향후 신갈나무가 최우점종인 식분으로의 천이가 진행될 것으로 예상된다.
핵심용어 : 경쟁, 기저면적, 밀도, 천이, 흉고직경계 분포
resources which are required for its growth, depending on its relative size (Begon et al., 1996). Competitions occur in many ways in a small space when germination begins, to secure space as growth carries on (Huh et al., 2000).
Thus, there are competitions among each tree to acquire resources (Ryu and Lee, 2002). And such phenomena are essential processes not only in oak stands but in all forests and plant societies to occupy space for growth (Johnson et al., 2002).
This study is designated to research the competitiveness of the trees in a Quercus acutissima-dominant stand at the south slope of Mt. Danseok-san in Gyueongju National Park, South Korea. Moreover, some Q. mongolica, Q.
dentata, and Pinus densiflora, and other tree species were evaluated using density, basal area and DBH class distribution in order to determine the stand structure and the competitive relationships within and among the species therein.
2. MATERIALS AND METHODS
2.1 Overview of the Survey area
Gyeongju National Park consists of regions of Nam-san (466 m), Seondo-san (381 m), Sogeumgang-san (143 m), Ognyeo-bong (214 m), Toham-san (745 m),and Danseok-san (827 m), Daebon. Among them, Mt.
Danseok-san is the highest mountain in Gyeongju National Park.
In this study, Q. acutissima dominant stand with an elevation of 740-760m on the south slope of Mt.
Danseok-san was surveyed. And the survey area has a relatively uniform slope direction with the 20-25∘ slope degree.
2.2 Vegetation Survey
Diameter measurements were conducted in the Q.
acutissima dominant stand on the south slope of Mt.
Danseok-san by fixed twenty 10 m × 10 m quadrates shown in Figure 1. Five times field researches were conducted from Aug. 1999, Oct. 2002, Oct.2005, Oct. 2012, to May 2018.
As for woody plants of the tree and sub-tree layers that appeared in the study field, the Diameters of the Breast Height (DBH) were used for measurment.
2.3 Density and Basal area
The density and basal area of all the trees being measured were calculated and the change in year was compared with the species that emerged.
(a) (b)
Fig. 1. The studied area located on Mt. Danseok(740-760m above the sea level) in the southestern Korean peninsula (a). Twenty
quadrates (1-20) were represented(b).
2.4 Analysis of the DBH class distribution The DBH values of all the trees were divided into classes, and graphs show the number of trees in each class. The figures were compared by year and major tree species.
3. RESULTS AND DISCUSSION
3.1 Climate
To evaluate the climate in and around the survey area, the data of hythergraph of Gyeongju were collected, which Park (2012) composed to present the five-year (2006-2010) weather observation data from Gyeongju Agriculture Technology Center. The center is located closest to the survey area and the data shows that the mean temperature of the coldest month was at 1.4℃ and that of the warmest month was 25.6℃; and that the mean monthly precipitation was 19.0-235.6 mm, which falls under the typical summer rainfall in Korea. The Gyeongju climate diagram composed by Yim and Kim (1983) shows that the mean annual temperature was 13.3℃; the mean annual precipitation was 998 mm, which is concentrated in the summer season (from June to Sep.); the highest mean daily temperature in the warmest month was 31.5℃; and the lowest mean daily temperature in the coldest month was –5.6℃.
The ranges of the warmth index (WI) and the coldness index (CI) at the elevation of 700-800 m on Mt.
Danseok-san, where the survey area is positioned, are referred to as the Gyeongju temperature data estimated separately by Park (2012) of 74.8 < WI < 79.2 (℃・month) and -17.7 < CI < -19.9 (℃・month). Such WI range indicates that the survey region belongs to the northern cool-temperature forest zone(Yim and Kira, 1975) (Table 1).
Table 1. Distribution of warmth index(WI) and coldness index(CI) along the altitude on study area
Altitude(m) WI(℃・month) CI(℃・month)
700 79.2 -17.7
800 74.8 -19.9
3.2 Community structure
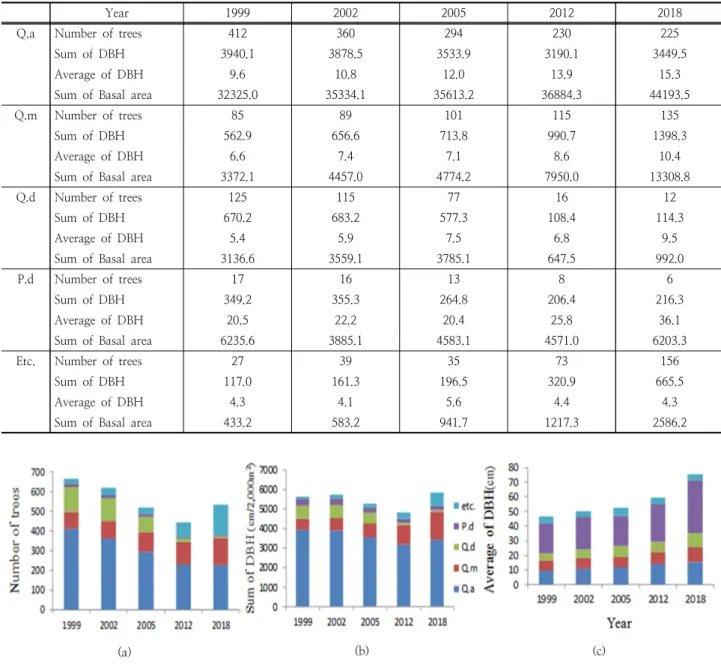
The number of tree species appearing in 20 Quadrates increased to 17 species in 2018 comparing with 8 species in 1999. However, the number of trees gradually decreased from 666 trees in 1999 to 442 trees in 2012. In 2018, it showed moderate rising to 534. In terms of tree species, the largest number of species appeared in the order of Q.
acutissima, Q. dentata, Q. mongolica, P. densiflora in 1999, while showing differences at present. While the number of Q. acutissima, Q. dentata, P. densiflora steadily decreased, the number of Q. mongolica and other species continued to increase. The density was 0.33 in 1999 showing decreasing to 0.20 in 2012. however in 2018 it indicated rising to 0.24.
This rising is responisble for the increase in number of other species in 2018 (Fig. 2, Fig. 3). Sum of DBH and sum of the basal area did not show any apparent trend.
These summations are estimated to show variability depending on the size and amount of dead trees. The rising of average number in DBH is attributed to influence of tree growth and life cycle of the trees (Table 2).
Fig. 2. Change of number of tree species(≥3cm DBH) in study area(2,000m2).
Fig. 3. Change of density for trees(≥3cm DBH)
Looking at the changes in the major species, in case of Q. acutissima, the number of trees gradually decreased, while the sum of basal area indicated increasing. The death of young trees and the steady growth of trees lead to increasing number of average DBH. In case of Q. mongolica,the number of trees, the sum of DBH, the average of DBH, and the sum of basal area have increased. Accordingly, Q. mongolica is expected to expand their dominance in this study area.
In 1999 although a large number of Q. dentata, were found in the sub-tree layer, many young trees have died and larger trees have kept growing. In case of P. densiflora there have been large trees in the coures of growth since 1999 in spite of declining number of the trees. (Table 3, Fig. 4).
Whittaker (1975) characterized the secondary succession of the oak-pine forest at Brookhaven National Laboratory, Long Island, and the general pattern can be described with 5 stages. According to this description, during the period of 30 to 35 years, the pitch pine trees (P. rigida), become dominant, forming a young pine woodland with shrubs, then so does scarlet and white oak (Q. coccine and Q. alba). By 50 years from the succession , trees form a young oak-pine forest with a well-developed shurb undergrowth at 4th stage. Based on the description and considering the species composition and tree size of the stand that studied, the oak (Q.acutissima) forest in this study is expected to have been formed after the pine (P. densiflora ) forest ended up being damaged during secondary succession owing to various causes.
Table 2. Number of species and trees, density(trees/m2), sum and average of DBH(cm) and sum of basal area(cm2) on study area(2,000m2).
Year 1999 2002 2005 2012 2018
Number of species 8 9 10 12 17
Number of trees 666 619 520 442 534
Density 0.33 0.30 0.26 0.20 0.24
Sum of DBH 5639.4 5734.9 5286.3 4816.5 5843.9
Average of DBH 8.5 9.3 10.2 10.9 10.9
Sum of Basal area 45502.5 50818.5 49797.4 51270.0 67283.8
3.3 DBH Class Distribution
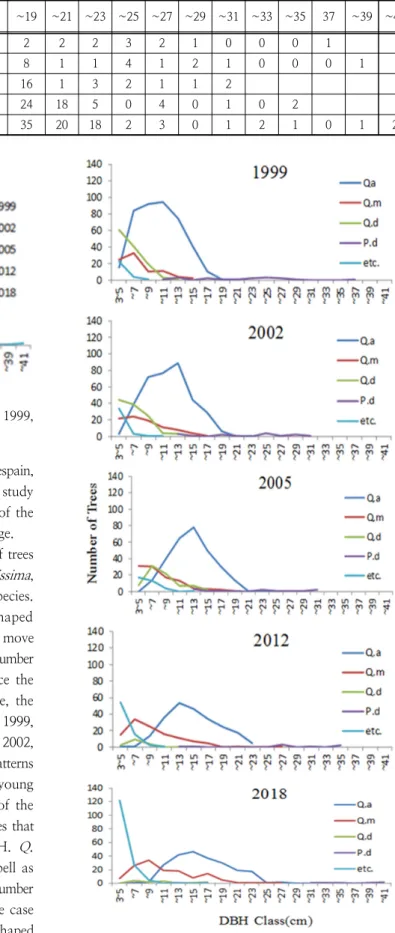
The number of trees in the 2cm class was compared with the DBH of all the trees based on the 20 surveyed quadrates by year. In 1999, the DBH class distribution of all trees formed a reverse J shaped distribution. However, with the declining number of young trees, the reverse J curve was torn down transfering to bell shaped distribution. In 2018, the curve showed similar shape of reverse J shape on the young trees and bell shape on the mature trees. The number of trees with DBH less than 13cm (except 3~5 cm) declined over time indicating that the competition of trees is severe.
However, the number of trees with higher DBH (13 ~
23 cm) increases over time which shows the competition of trees is relieved. Consequently,it reveals that DBH 13cm is on the threshold of trees competition trend where the downtrend in the tree population is on uptrend(Table 4, Fig. 5).
Daubenmire (1968) stated that the tree age distribution of a plant community shows its succession. The regeneration after a disturbance shows a reverse J-shaped distribution as the number of young trees increases in the initial stage, and changes to a bell-shaped distribution as the young tree population decline owing to shrinking reproduction rate.
In contrast, the DBH class distribution of the climax community without a disturbance shows a negative Table 3. Number of trees, sum and average of DBH(cm) and sum of basal area(cm2) of major four species and other species(Q.
acutissima(Q.a) Q. mongolica(Q.m), Q. dentata(Q.d), P. densiflora(P.d) and other species(Etc.) in study area(2,000m2).
Year 1999 2002 2005 2012 2018
Q.a Number of trees 412 360 294 230 225
Sum of DBH 3940.1 3878.5 3533.9 3190.1 3449.5
Average of DBH 9.6 10.8 12.0 13.9 15.3
Sum of Basal area 32325.0 35334.1 35613.2 36884.3 44193.5
Q.m Number of trees 85 89 101 115 135
Sum of DBH 562.9 656.6 713.8 990.7 1398.3
Average of DBH 6.6 7.4 7.1 8.6 10.4
Sum of Basal area 3372.1 4457.0 4774.2 7950.0 13308.8
Q.d Number of trees 125 115 77 16 12
Sum of DBH 670.2 683.2 577.3 108.4 114.3
Average of DBH 5.4 5.9 7.5 6.8 9.5
Sum of Basal area 3136.6 3559.1 3785.1 647.5 992.0
P.d Number of trees 17 16 13 8 6
Sum of DBH 349.2 355.3 264.8 206.4 216.3
Average of DBH 20.5 22.2 20.4 25.8 36.1
Sum of Basal area 6235.6 3885.1 4583.1 4571.0 6203.3
Etc. Number of trees 27 39 35 73 156
Sum of DBH 117.0 161.3 196.5 320.9 665.5
Average of DBH 4.3 4.1 5.6 4.4 4.3
Sum of Basal area 433.2 583.2 941.7 1217.3 2586.2
(a) (b) (c)
Fig. 4. Change of (a)number of trees, (b)sum of DBH and (c)sum of basal area for tree species; Q. acutissima(Q.a) Q. mongolica(Q.m), Q. dentata(Q.d), P. densiflora(P.d) and other species(etc.) in study area(2,000m2).
Fig. 5. DBH class distributions of all trees ≥3cm DBH in 1999, 2002, 2005, 2012 and 2018 year.
exponential or a J shaped distribution (Leak, 1975; Despain, 1983). According to these studies, vegetation in this study is in the process of changing from the initial stage of the secondary forest succession to the intermediate stage.
Changes in the relationship between the number of trees and DBH class by year were compared with Q.acutissima, Q. mongolica, Q.dentata, P. densiflora and other species.
The most dominant Q. acutissima formed bell shaped distribution. The peak of bell curve of Q. acutissima move to the right of the graph over time and the maximum number of trees gets lower by year. This indicates that since the DBH of the trees increases with the growth of tree, the number of trees decrease. In the case of Q.dentata, in 1999, it showed a low reverse J shaped distribution, and in 2002, a low half bell curve, without apparent distribution patterns later. This is the result of a sharp decline in the young trees by year. P. densiflora was on the right side of the graph without clear distribution patterns. This indicates that as the number of trees is small and large in DBH. Q.
mongolica, shows a change in the shape of a low bell as the distribution curve increases. This is because as the number of trees increases, so does the growth of trees. In the case of other species, in 2012, it showed a low reverse J shaped distribution, and in 2018, it showed a distinct reverse J shaped distribution(Figure 6). Considering these changes of DBH class distribution pattern in Figure 6, the number of
Fig. 6. DBH class distributions of trees ≥3cm DBH;
Q. acutissima(Q.a) Q. mongolica(Q.m), Q. dentata(Q.d), P. densiflora(P.d) and other species(etc.) in 1999, 2002, 2005,
2012 and 2018 year.
Table 4. Number of trees each DBH class(cm) of study area.
Class
year 3~5 ~7 ~9 ~11 ~13 ~15 ~17 ~19 ~21 ~23 ~25 ~27 ~29 ~31 ~33 ~35 37 ~39 ~41
1999 123 162 122 109 82 43 12 2 2 2 3 2 1 0 0 0 1
2002 103 105 117 93 103 49 30 8 1 1 4 1 2 1 0 0 0 1
2005 56 88 83 85 93 56 33 16 1 3 2 1 1 2
2012 72 60 44 53 65 55 39 24 18 5 0 4 0 1 0 2
2018 129 58 43 49 61 55 54 35 20 18 2 3 0 1 2 1 0 1 2
Q.acutissima, Q.dentata and P. densiflora had decreased and Q. mongolica and other species had increased, but so far Q.acutissima is the most dominant species. The most dominant Q. acutissima, and the sub-dominant Q.
mongolica in the surveyed area, it indicates that the stand is in a progressive state when Q. mongolica invades gradually on the resources pre-occupied by the Q. acutissima in the area. Moreover, considering the age distribution of the two competing tree species, the succession of this community is expected to progress to the Q. mongolica dominant community. This expectation is supported by the fact that Q. mongolica is the characteristic tree species in the broadleaf forests of cool temperature zone in the central Korea, which is the typical forest type in the deciduous broadleaf forest zone in the Korean peninsula (Yim, 1977), also based on the study of Jang and Yim (1985) which states that Q.
mongolica is the tree species that forms the climatic climax forests around the summit areas of dried-up mountains.
3.4 Comparison of Association
To summarize, the result of comparing 19 recorded tree species from 1999 to 2018 with differential species and companions based on analysis of association structure on the Sawtooth Oak forest in South Korea (Song, 2007) says that the stand is classfied in Quercetum mongolico- acutissimae typicum subass. nov of Quercetum mongolico- acutissimae ass. nov in Quercion acutissimae. The19 recorded tree species from 1999 to 2018 are composed of following species such as Q. acutissima, Q. dentata, Q. mongolica, P.
densiflora, Fraxinus rhynchophylla, F. sieboldiana, Rhododendron schlippenbachii, Pyrus ussuriensis, Symplocos chinensis for. pilosa, Lespedeza maximowiczii, Sorbus alnifolia, Lindera obtusiloba, Cornus controversa, L. erythrocarpa, Styrax obassia, Acer mono, Corylus heterophylla var.
thunbergii, Prunus sargentii, Ligustrum obtusifolium.
ACKNOWLEDGEMENT
I am grateful to the president and officials of Daegu Haany university for giving me year of research to carry out this study.
And I thank to the members of Daegu Haany university ecology lab for their help in field research and data management.
REFERENCES
Begon, M, Harper, JL and Townsend, CR(1996). Ecology:, Individuals, Populations and Communities(3rd ed.).
Blackwell Science Ltd. Malden.
Daubenmire, R(1968). Plant communities: A Textbook of Plant Synecology. Harper & Row, London.
Dejong, TJ, Klinkhamer, PGL and Metz, JAJ(1987). Selection for biennial life histories in plants, Vegetatio, 70, pp.149-156. [https://www.jstor.org/stable/20038144?
seq=1#page_scan_tab_contents]
Despain, DG(1983). Nonpyrogenous climax lodgepole pine communities in Yellowston National Park, Ecology, 64, pp. 231-234. [DOI http://doi.org/10.2307/1937070]
Huh, MK, Huh, HW and Kim, CH( 2000). Three Species Associations with Spatial Autocorrelation Analysis in Community, The Korean J. of Ecology, 23(1), pp. 17-23.
[Korean Literature]
Jang, YS and Yim, YJ(1985). Vegetation Types and Their Structures of the Piagol, Mt. Chiri, The Korean J. of Botany, 28, pp. 165-175. [Korean Literature]
Johnson, PS, Shifley, SR and Rogers, R(2002). The ecology and silviculture of oaks, CABI Publishing, New York.
Kramer, H(1988). Waldwachstumslehre, Blackwell Wissenschafts-Verlag, Hamburg und Berlin.
Leak, WB(1975). Age distribution in virgin red spruce and northern hardwoods, Ecology, 56, pp. 1451-1454. [DOI http://doi.org/10.2307/1934714]
Mark, RN and Harper, JL(1977). Interference in dune annuals: spatial pattern and neighborhood effects, J. of Ecology, 65, pp. 345-363. [DOI http://doi.org/10.
2307/2259487]
Park, SH(2012). The vegetation of Mt. Danseok, Master's Thesis, Daegu Haany University, Gyungsan, S.Korea.
[Korean Literature]
Pugnaire, F and Valladares, F(1999). Handbook of Functional Plant Ecology, Marcel Dekker Inc, New York.
Ryu, MI and Lee, JH(2002). Population Ecology, Seoul National University Press, Seoul. [Korean Literature]
Song, MS(2007). Analysis of distribution and association structure on the Sawtooth Oak(Q. acutissima) Forest in Korea, Ph.D. Dissertation, Changwon National University, Changwon, S.Korea. [Korean Literature]
Whittaker, RH(1975). Communities and Ecosystems(2nd ed.), Macmillan Publishing Co. Inc., New York.
Yim, YJ and Kim, SD(1983). Climate-diagram map of Korea, The Korean J. of Ecology, 6(4), pp. 261-272.
Yim, YJ and Kira, T(1975). Distribution of forest vegetation and climate in the korean peninsula: I. Distribution of some indices of thermal climate, Japanese J. of Ecology, 25, pp. 77-88.
Yim, YJ(1977). Distribution of forest vegetation and climate in the korean peninsula: IV. Zonal distribution of forest vegetation in relation to thermal gradient, Japanese J. of Ecology, 27, pp. 269-278.