논문 2014-51-4-13
3차원 시각 주의 모델과 이를 이용한
무참조 스테레오스코픽 비디오 화질 측정 방법
( 3D Visual Attention Model and its Application to No-reference Stereoscopic Video Quality Assessment )
김 동 현*, 손 광 훈***
( Donghyun Kim and Kwanghoon Sohnⓒ)
요 약
최근 사용자에게 직접 입체감을 제공하는 3차원 영상기술에 대한 관심이 증대함에 따라 스테레오스코픽 비디오 화질 측정 기술개발은 중요한 주제로 많은 연구자에게 관심을 받고 있다. 특히, 스테레오스코픽 비디오 화질 측정에 중요한 역할을 하는 인간시각특성을 고려한 연구가 활발히 진행되지 않고 있어 본 논문에서 스테레오스코픽 비디오를 시청할 때 자극되는 다수의 인간시각특성 요소인 깊이, 움직임, 컬러, 휘도, 대조 등을 고려하여 3차원 시각 주의 모델을 제안한다. 또한, 본 논문에서는 실 제 3차원 영상 특정 영역의 화질 열화 정도를 측정하는데 제안된 3차원 시각 주의 모델을 사용하여 무참조 스테레오스코픽 비 디오 화질 측정 방법을 제안하였다. 제안 방법을 검증하기 위해 주관평가를 실시하여 기존의 스테레오스코픽 비디오 화질 측 정 방법보다 평균 평가점에서 더 높은 연관성을 보였다. 게다가, 3차원 시각 주의 모델을 이용하여 스테레오스코픽 비디오의 관심영역 추출 결과는 공간적, 시간적 요소를 고려하여 추출된 관심영역에 비해 실제 관심영역과 더욱 유사함을 주관적으로 보여 제안 방법의 효율성을 보였다.
Abstract
As multimedia technologies develop, three-dimensional (3D) technologies are attracting increasing attention from researchers. In particular, video quality assessment (VQA) has become a critical issue in stereoscopic image/video processing applications. Furthermore, a human visual system (HVS) could play an important role in the measurement of stereoscopic video quality, yet existing VQA methods have done little to develop a HVS for stereoscopic video. We seek to amend this by proposing a 3D visual attention (3DVA) model which simulates the HVS for stereoscopic video by combining multiple perceptual stimuli such as depth, motion, color, intensity, and orientation contrast. We utilize this 3DVA model for pooling on significant regions of very poor video quality, and we propose no-reference (NR) stereoscopic VQA (SVQA) method. We validated the proposed SVQA method using subjective test scores from our results and those reported by others. Our approach yields high correlation with the measured mean opinion score (MOS) as well as consistent performance in asymmetric coding conditions. Additionally, the 3DVA model is used to extract information for the region-of-interest (ROI). Subjective evaluations of the extracted ROI indicate that the 3DVA-based ROI extraction outperforms the other compared extraction methods using spatial or/and temporal terms.
Keywords: 3D Visual Attention Model, No-reference (NR) stereoscopic video quality assessment, Region-of-interest (ROI) extraction, Subjective video evaluation.
* 학생회원, ** 정회원, 연세대학교 전기전자공학과
(School of Electrical and Electronic Engineering, Yonsei University)
ⓒ Corresponding Author(E-mail: [email protected])
접수일자: 2013년12월11일, 수정일자: 2014년3월13일, 수정완료: 2014년3월26일
Ⅰ. Introduction
Digital video has become an indispensable means to represent and communicate information in daily life. However, distortions unavoidably appear during video acquisition, compression, transmission, processing, and reproduction. In order to maintain and improve quality, it is important to design a video quality assessment (VQA) that can automatically predict perceptual quality degradation as the human visual system (HVS) perceives it[1].
VQA can be classified into subjective and objective assessments. The only currently reliable method to assess the video quality perceived by a human observer is to ask human subjects for their opinion, which is termed subjective VQA. However, meaningful subjective assessment requires many participants and takes a long time. Therefore, design of an objective VQA that can be implemented in real-time has received much recent attention. Various objective VQA methods have been proposed for standardization and progressed by ITU-R working Party 6Q, ITU-T Study Group 9, and Video Quality Expert Group (VQEG).
Objective quality scores are easily obtained using pre-defined quality assessment methods. The mean squared error (MSE) and a related measurement, the peak signal-to-noise ratio (PSNR), are the most commonly used measurements of image or video quality. They can be implemented in an automatic or real-time system. The MSE and PSNR are calculated by summing differences between the original image and the distorted image and have low computational complexity. However, they only exploit differences in pixel values at the same position between two images, and their results differ from subjective assessments in certain condition[2].
Different from these traditional quality assessment methods, the Structural SIMilarity (SSIM) index is designed based on a top-down philosophy[3]. Under the assumption that the HVS is highly adapted to
extract structural information from the viewing field, the SSIM index measures structural information as a good approximation of perceived image distortion. By implementing the SSIM with a local moving window, a spatial SSIM map between the original and distorted images is calculated. Then, a final score is computed by either simple averaging or a more advanced pooling strategy[4]. The SSIM index has achieved substantial success compared with the MSE and PSNR in terms of correlation with subjective results. In addition, its low computational complexity compared with other quality assessment methods makes it more appropriate for practical applications.
Recently, following the success of High Definition (HD) video, three dimensional (3D) imaging has attracted public attention as the next-generation technology of broadcasting systems. 3D video (3DV) creates depth perception by binocular parallax[5]. The simplest and currently most commercialized 3DV format is stereoscopic video which contains two viewpoint video sequences. For example, 3D cinema and glass-type 3DTV are based on stereoscopic video. Thus, research on 3DV quality should start with stereoscopic video. However, quality assessment methods for 3DV have not been studied intensively.
In this paper, a no-reference (NR) stereoscopic VQA (SVQA) method is proposed by using 3D-visual-attention-based pooling. The 3D visual attention (3DVA) model is based on the hypothesis that a HVS for stereoscopic video can be accurately simulated based on three features: spatial and temporal information, and depth perception, since these features have substantial impacts on human quality judgments. For NR SVQA, the 3DVA is used for pooling on significant regions of very poor quality. The proposed NR SVQA measures blurring and blocking distortions based on wavelet coefficients. These distortions generally appear in compressed stereoscopic video, since they are usually compressed by block-based video compression such as H.264/MVC. The 3DVA-based pooling can obtain
object information which may improve the performance of the VQA methods for compressed stereoscopic video.
The remainder of this paper is organized as follows. Section Ⅱ reviews conventional VQA methods for 3DV. We describe how to generate the 3DVA model in Section Ⅲ. In Section Ⅳ, we propose a NR SVQA method by using the 3DVA-based pooling for evaluating the quality of compressed stereoscopic video. Experimental results of the proposed 3DVA-based SVQA method and the results applied for other applications of the 3DVA model are presented in Section Ⅴ. Finally, our conclusions are given in Section Ⅵ.
Ⅱ. Video Quality Assessment Methods for 3D Video
Several broadcasting companies have become interested in production of high quality 3DV.
According to the types of input data, 3DV systems are classified into several categories such as multi-view video (MVV), multi-view video plus depth (MVD) video, and stereoscopic video systems.
Among them, since the stereoscopic video system is the easiest of these to implement, this system has been adopted by a number of broadcasting companies.
For broadcast, the stereoscopic videos are compressed by block-based video codec before transmission.
Although 3D technologies are rapidly emerging, the perceptual quality of stereoscopic video has not been intensively studied. A few objective quality assessment methods for stereoscopic images or videos have been proposed[6~10]. Several full-reference (FR) stereoscopic image quality assessment (SIQA) methods that use depth information have been proposed[6~7, 10]. For example, Benoit proposed a SIQA that incorporates measurements of 2D quality with depth distortion[6]. Indices of image quality and stereoscopic sense have also been proposed based on the absolute disparity images[10]. Several NR SIQA
methods are also proposed[9].
Currently, Seo proposed an SVQA method which evaluates the blocking and blurring artifacts in edge regions and the difference in video quality between two views[9]. These methods are based on segmented local features, edge, and disparity. However, an important hypothesis in the eld of video quality assessment methods is that the locally very poor quality regions substantially affect the overall subjective perception of quality[7~8]. Previously mentioned research has focused on the analysis of global statistics for stereoscopic video contents to evaluate the quality of the stereoscopic video.
In practice, a number of researches have devoted to analyze the local statistics for measuring the monoscopic image or video quality. Among them, some researches are based on the spatial pooling methods such as salient regions[11-13]. Some have used salient map extraction methods such as the Neuromorphic Vision C++ Toolkit (NVT)[11], SaliencyToolBox (STB)[12] and Gaze-Attentive Fixation Finding Engine (GAFFE)[13]. The other methods are based on temporal pooling such as motion information[14~16]. The temporal pooling method is only used to design weights to pool local spatial quality indices into a single quality score for the video[15], and a VQA that estimates spatiotemporal distortions through temporal analysis of spatial perceptual distortion maps was presented[16]. TetraVQA utilizes motion estimation within a VQA framework, where motion-compensated errors are computed between the references and distorted images[14]. However, there has not been enough eort to consider the HVS for stereoscopic video and for quality assessment of 3DV. Therefore, this suggests the need to extract the significant regions of very poor quality that substantially affect the overall quality scores, and to emphasize those regions when evaluating the overall objective quality score of stereoscopic video.
Ⅲ. 3D Visual Attention Model for Stereoscopic Video
In this section, we explain how to generate a visual attention model for stereoscopic video. The 3DVA model focuses on three features to simulate the HVS. First, the human visual saliency model of stationary images is considered as the spatial factor in the 3DVA model. A well-known method of computing the spatial factor is based on bottom-up visual cues such as intensity, orientation, and color[17]. Second, motion is considered as the temporal factor in the 3DVA model since it is an important feature in human perception. For the temporal factor, we obtain the motion information from successive frames. Depth perception is also an important factor in simulating the HVS for stereoscopic video, because it makes people feel more realistic while watching the 3DV[18]. Therefore, we consider depth perception as the third factor in the 3DVA model. Finally, to obtain the complete 3DVA model, we combine the spatial, temporal, and depth factors with a linear function as shown in (1) and Fig. 1.
(1) where , and denote the spatial, temporal and depth term, respectively, and is the completed 3DVA model. and are the weighted coefficients for spatial, temporal and depth factors respectively. Generally, the weighted coefficient of depth is the highest of these, since the HVS is most sensitive to depth perception while watching the
그림 1. 3D 시각 주의 모델 제작 흐름도 Fig. 1. Flow chart of 3D Visual Attention Model.
3DV[19]. Therefore, are empirically set as 0.2, 0.32, and 0.48, respectively.
3.1. Spatial Factor
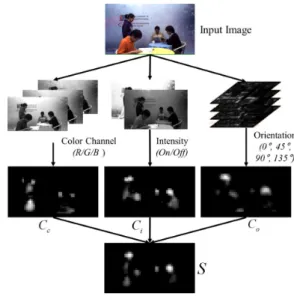
We adopt the human visual saliency model to implement the spatial factor in the SVA. Generally, the 2D saliency model with stationary features[11] is the most commonly used. This model generates the saliency map based on seven multi-scale low-level features including color contrast (Red/Green and Blue/Yellow), intensity contrast, and four orientations (0, 45, 90, 135 degrees) as shown in Fig. 2.
For static scenes, retinal input is processed in parallel by seven multi-scale low-level features, which detect local spatial discontinuities using simulated center and surround neurons.
Center-surround differences are computed as point-wise differences across pyramid levels, and six features are computed for each of the seven multi-scale low-level features, yielding a total of 42 features. Finally, all features are combined into three conspicuity maps (color , intensity and orientation ) and the saliency map is computed with the normalized summation strategy.
그림 2. “Cafe” 영상의 공간적인 요소 추출 과정 Fig. 2. Operation of spatial factor extraction with a
“Cafe” sequence.
(a) Cone (b) Ground truth (c) 19.59 dB (d) 35.65 dB (e) 23.86 dB
(f) Teddy (g) Ground truth (h) 20.82 dB (i) 36.04 dB (j) 27.35 dB 그림 3. Middlebury 스테레오 이미지[23]에 다양한 탐색 범위를 적용하여 추출한 깊이 영상 결과.
적용 탐색 범위 (c), (h) 0~30, (d), (i) 0~60, and (e), (j) 0~120
Fig. 3. Results of depth estimation with correct and incorrect search range for Middlebury stereo image[23]. The search range is set as (c), (h) 0~30, (d), (i) 0~60, and (e), (j) 0~120, respectively.
3.2. Temporal Factor
In the temporal factor of the 3DVA, motion information is one of the major stimuli perceived by a HVS. To estimate the rough motion information of objects between consecutive frames, we use the block-based motion estimation algorithm[20] which is the most popular and widely used. We used 16x16 blocks and predicted motion information of the same size as macro-blocks in neighboring frames. The horizontal and vertical motion vectors of current frame are combined into the motion as follows:
(2) where ∙ denotes the magnitude of the motion vector, and is motion information which is represented by horizontal and vertical motion vectors and , respectively. Typically, the motion magnitude that minimizes some cost measure involving the candidate and the target macro-blocks is selected as follows:
arg
≤ ≤
(3)
where is a window size, which is set to 16, and is a search range of the block-based method for estimating the temporal factor in the 3DVA model, which is set to 32. Generally, this robust motion information represents the human attention regions for a static camera arrangement. However, for video with camera motion, this information includes the motion of background area, which should not draw the attention of the viewer. To achieve this, the final motion information is generated considering the content of the 2D saliency map, because regions with high saliency capture higher human attention. Therefore, the final temporal factor in the 3DVA model is defined as follows:
∙ (4)
where is a linear normalization function which adjusts the motion value from 0 to 255, where the value 255 indicates the most attention.
3.3. Depth Factor
In 3DV, depth perception is an important factor for simulating the HVS because it provides the visual
ability to perceive the world in 3D as well as the distance of an object. For example, people are usually more interested in foreground regions than background regions, and the regions going out of the screen are also attractive when viewing stereoscopic video. In this subsection, the block-based disparity estimation method[21] is used to obtain depth information as well as when we obtain the temporal factor. The depth factor is obtained as follows:
(5)
arg
≤ ≤
(6) where and denote the depth values of left image and right image, respectively, and belongs to the corresponding search range of
. The search range for the depth term is usually specied by the minimum and maximum magnitude of the disparity vectors. However, the disparity search range is a significant parameter, because if it is too small, it leads to getting trapped in local minima and if it is too wide it requires more computation time (especially for large images). To obtain the accurate depth information, we used the histogram based search range estimation algorithm[22]. Fig. 3 shows the importance of the correct search range. Then, to extract the perceptually significant depth map, we use the normalization function and perceptually segmented function as follows:
′ (7)
(8)where is an each depth value, and threshold value is set as max min × , empirically.
Ⅳ. No-reference Stereoscopic Video Quality Assessment using
3D-Visual-Attention-Based Pooling
It is believed that the information represented in the primary visual cortex is integrated in the subsequent brain area[24]. However, little is unfortunately known about the nature of the actual integration taking place in the brain[25~26]. In order to simulate this process, HVS-based pooling is applied to the local distribution measurement map by giving dierent weights for the regions in the map so as to compute a scalar objective quality score. Although a lot of research has been done to investigate the perceptual error map, much less has been done for studying HVS-based pooling.
In this section, we propose SVQA methods to measure the objective quality of the compressed stereoscopic video using 3DVA-based pooling. Since we consider the relation with the factors in simulating the HVS for stereoscopic video and present the 3DVA model, the 3DVA can represent the viewer's ROI while viewing the stereoscopic video. Therefore, the 3DVA-based pooling is expected to improve the performance of the SVQA methods. In our previous work[27], the depth perception and motion cue were used to weight the indices of PSNR and SSIM. However, blurring and blocking distortions appear in the compressed video due to block-based video compression. To evaluate the distortions of compressed stereoscopic video, we propose an NR SVQA which is based on our previous works[28~29]. However, our previous work evaluated the compressed distortion in a single image. We build on this work to measure the quality of stereoscopic video, and we measure the distortions of compressed stereoscopic video using 3DVA-based pooling.
We used the inherent sharpness ( ) of a given image to measure the blurring distortion[28]. We verified that the degree of perceived sharpness is affected not only by the total amount of
high-frequency () components, but also by the content of an image, such as spatial activity. We improve on our previous work to measure the blurring distortions of compressed stereoscopic video, and we dene the spatial activity with the 3DVA model as . To estimate the perceived sharpness of the stereoscopic video, the is used as follows:
∙
max min
(9) where is the morphological gradient of location , and are the horizontal and vertical sizes of the image, respectively.
Wavelet decomposition is used to obtain the information of the in an image of each view.
The wavelet decomposition is a general way to reveal both the spatial and the frequency properties of an image. It divides the information of an image into approximated and detailed sub-signals. The approximated sub signal represents the general trend of pixel while the other sub signals represent detailed features in three directions: vertical, horizontal, and diagonal. In this subsection, the diagonal details are used to represent the frequency properties since the vertical and horizontal details are dependent on the edges. The diagonal wavelet coefficients can be computed as follows:
∙ (10)where denotes a diagonal wavelet function composed of two impulse responses of horizontal and vertical high-pass filters. Then, the blurring distortion score (BL) using 3DVA-based pooling for each video is calculated as (11), and then an overall blurring distortion score for 3DV ( ) is calculated with an averaging function.
∙
(11)
(12)
The block-based video compression methods cause severe blocking distortions due to coarse quantization for Discrete Cosine Transform (DCT) coefficients close to zeros. To evaluate the blocking distortion for stereoscopic video, an image of each view is first divided into square blocks equal to the macro-block and also transformed into the wavelet domain as (10).
The wavelet images consist of the approximated and detailed sub-signals, which are represented in vertical, horizontal and diagonal directions. We showed that the properties of wavelet images are varied according to the degree of a blocking distortion[29]. The blocking distortion is evaluated based on the distribution of the sub-signals of the wavelet transform constructed as follows:
or
or (13)where and are the amplitude of the bin of the distribution of the horizontal and vertical sub-signals, respectively. is the size of a local block, and and are the horizontal and vertical sub-signals of the wavelet transform. A local blocking distortion score is based on the distribution of the sub-signals and calculated using the relative magnitudes of peak and non-peak bins as follows:
i f ≠
(14) where is a horizontal blocking distortion score of
the block. and denote the peak and non-peak bins, respectively. is the number of peak bins, and is the number of non-peak bins. When all the bins have the same magnitude, the degree of blocking distortion is set to 1, which means the most severely distorted. The vertical blocking distortion can be similarly evaluated. Then, the overall blocking distortion for a stereoscopic video is computed by summing the local blocking distortion scores as follows:
∙ ∙ (15) where is set to 0.5, because the horizontal blocking distortion is equally as important as the vertical blocking distortion. We improve the previous work[29]
to evaluate the blocking distortion of stereoscopic video, and we use the 3DVA model for pooling the overall blocking distortion of 3DV as follows:
∙
∙ (16)where is the overall blocking distortion score for stereoscopic video, and are the 3DVA model of left and right video, respectively. Then, the overall compressed distortions score 3D..QS is
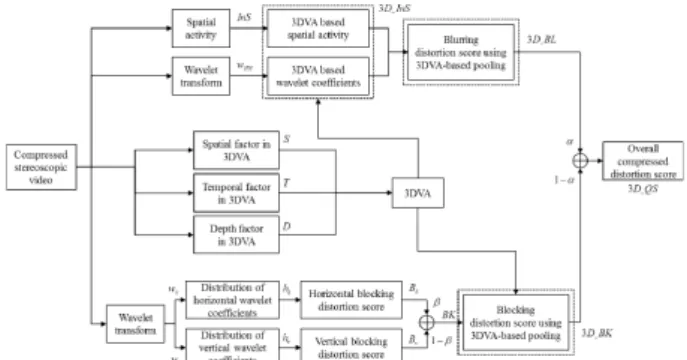
그림 4. 제안하는 3차원 시각 주의 모델 기반의 무참조 스테레오스코픽 비디오 화질 측정 방법 Fig. 4. Flow chart of the proposed NR SVQA using
3DVA-based pooling
obtained by combining the blurring and blocking scores for 3DV with an averaging function as shown in (17) and Fig. 4.
∙ ∙ (17) where is a weighted coefficient, which is set to 0.5.
Ⅴ. Experimental Results
In this section, we performed experiments to demonstrate the performance of the proposed NR SVQA method that uses 3DVA-based pooling for several compressed stereoscopic sequences.
In order to evaluate the performance of the proposed method, we follow the suggestions of the VQEG report[30]. As recommended in report[30], we used the four performance measures including the Pearson correlation coefficient (PCC, indicates the prediction accuracy), Spearman rank-order correlation coefficient (SROCC, indicates the prediction monotonicity), root mean squared error (RMSE, indicates the prediction consistency), and mean absolute error (MAE, indicates the prediction consistency). Note that, for a well-defined metric, the values of PCC and SROCC should be high and the values of RMSE and MAE should be low.
5.1. Database
Table 1 summarizes the experimental environment for the subjective assessment. In the experiments, we used the two stereoscopic videos from 3dtv.at[31]
(“Heidelberg1” and “Heidelberg2”:1280x720, 10sec) and three stereoscopic video from MPEG 3DV test sequences[32~34] (“Cafe”, “Poznan..Hall2” and
“Undo_Dancer”:1920x1080, 10sec). These stereoscopic videos are encoded by Joint Multi-view Video Codec 8.05 (JMVC 8.05)[35]. Since an ocial rate control algorithm has not been proposed yet, various QP (Quantization Parameter) values were used to construct databases with the symmetrically and asymmetrically compressed stereoscopic video (115
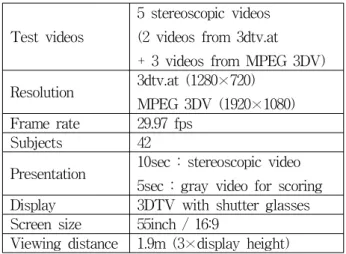
Test videos
5 stereoscopic videos (2 videos from 3dtv.at + 3 videos from MPEG 3DV) Resolution 3dtv.at (1280×720)
MPEG 3DV (1920×1080) Frame rate 29.97 fps
Subjects 42
Presentation 10sec : stereoscopic video 5sec : gray video for scoring Display 3DTV with shutter glasses Screen size 55inch / 16:9
Viewing distance 1.9m (3×display height)
표 1. 주관평가를 위한 실험 환경
Table 1. Experimental Environment for Subjective Assessment.
videos). These databases are available with DMOS[36]. We conducted subjective assessment using the double stimulus continuous quality scale (DSCQS) according to ITU-R Recommendation BT. 500[37]. We recruited 42 subjects on campus, with ages from 19 to 29; 2 subjects were experts, and 30 subjects had experience in watching stereoscopic video at least once. Thus, the 40 subjects were non-expert, and they were not concerned with 3DVA-based pooling in their normal work. All participants passed a color vision test. The videos were randomly displayed on 3DTV with shutter glasses. For each video, all participants conducted the test using a continuous linear scale with five grades: Excellent, Good, Fair, Poor, and Bad. The dierence mean opinion score (DMOS) was computed for each video and scaled into the range from 0 to 5.
5.2. Performance of the Proposed NR SVQA using 3D-Visual-Attention-based Pooling We used a 3DVA model, obtained from stereoscopic video compressed by JMVC 8.05, as weights for classical VQA method such as PSNR, to verify the 3DVA-based pooling for stereoscopic video as follows:
′
′∙ log
(18) where and are the horizontal and vertical size of an image of the original video, and ′ is an image of compressed video. is the pixel value of the 3D visual attention model. The values of the 3D visual attention model directly adjust the weight. Then, the PSNR for 3DV is calculated by using the MSE for 3DV. is the maximum value of a pixel (typically,
=255).
Since the 3DVA model achieved by dierent videos may not have the same intensity level which will severely affect the final result, we first modify the 3DVA model as follows:
(19)
where denotes the normalized 3DVA model.
The 3DVA-based pooling for SVQA can adjust the weight directly to calculate PSNR for 3DV (3D_PSNR).
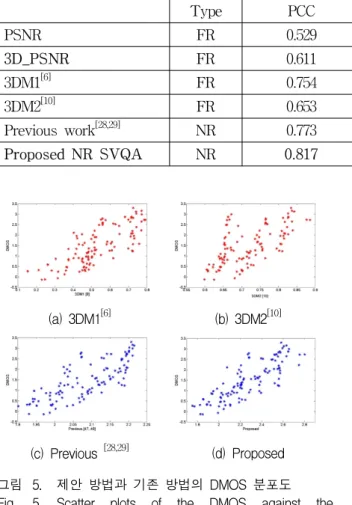
We obtained the index of the PSNR for 3DV and compared it with the conventional PSNR as shown in Table 2. According to Table 2, the 3DVA-based pooling can improve the performance of PSNR. Table 2 also presents the results of the proposed NR blurring, blocking and combined VQA using 3DVA-based pooling for compressed stereoscopic video, and they compared with the our previous works[28~29] and the other methods[6, 10]. Fig. 5 shows the scatter plots of the DMOS against the proposed NR SVQA and the other methods. As shown in Table 2 and Fig. 5, the Pearson correlation coefficient (PCC) and the Spearman rank-order correlation coefficient (SROCC) of the proposed method score 0.817 and 0.831, respectively.
The proposed NR SVQA method shows higher correlation with subjective scores and consistent performance. Note that the proposed NR SVQA method
Type PCC SROCC RMSE MAE
PSNR FR 0.529 0.512 0.759 0.625
3D_PSNR FR 0.611 0.677 0.692 0.597
3DM1[6] FR 0.754 0.755 0.587 0.496
3DM2[10] FR 0.653 0.669 0.678 0.544
Previous work[28,29] NR 0.773 0.788 0.567 0.454
Proposed NR SVQA NR 0.817 0.831 0.516 0.401
표 2. 기존 방식과의 결과 비교
Table 2. Performance Comparison.
(a) 3DM1[6] (b) 3DM2[10]
(c) Previous [28,29] (d) Proposed 그림 5. 제안 방법과 기존 방법의 DMOS 분포도 Fig. 5. Scatter plots of the DMOS against the
proposed method and the other methods is based on the 3DVA-based pooling, while the other methods did not consider the features of 3DV, and our proposed approach outperforms the other assessment methods.
5.3. The 3D-Visual-Attention-based ROI Extraction
In this subsection, we perform the 3DVA-based ROI extraction to support our decision to use 3DVA-based pooling for SVQA.
Fig. 6 shows the results of the 3DVA-based ROI extraction for a test sequence. Fig. 6 (a) renders one view of stereoscopic video. Fig. 6 (b)-(d) show feature maps of spatial, temporal, and depth factors, respectively. In these feature maps, white pixels indicate high attention region and black pixels
indicate low attention region in the stereoscopic video. Fig. 6 (e) shows the proposed 3DVA which is combined with spatial, temporal, and depth factors.
In order to verify the proposed 3DVA, the regions of interest (ROI) are extracted by using each feature for 3DV as shown in Fig. 6 (f)-(j). For using as persuasive reference, we obtained the human saliency map by performing eye-tracking experiments with the SmartEye Pro[38] as depicted in Fig. 6 (f). Fig. 6 (g) exhibits the extracted region of interest (ROI) based on static image saliency only. Fig. 6 (c) illustrates motion information and Fig. 6 (h) shows the ROI extracted on the basis of motion information only. Generally, large motion contrast areas are very likely to be high attention areas. Fig. 6 (d) shows the depth factor in the 3DVA model extracted by the block-based disparity estimation method with the search range estimation method described in Section 3.3. Fig. 6 (i) shows the extracted ROI using the depth factor in the 3DVA model. Fig. 6 (e) shows the nal 3DVA model and Fig. 6 (j) exhibits the extracted ROI based on the proposed 3DVA model for stereoscopic video. We can see that Fig. 6 (j) can simulate the HVS better for all sequences compared with Fig. 6 (g)-(i). Therefore, we can conclude that the proposed 3DVA model simulates the HVS well by fusing static image saliency, motion, and depth information. Additionally, though there are noises in both the depth map and the static saliency, the 3DVA model was still able to obtain satisfactory attention regions by jointly using depth, motion, and
(a) (b) (c) (d) (e)
(f) (g) (h) (i) (j)
그림 6. “Cafe” 영상에 3차원 시각 주의 모델 기반의 ROI 추출 결과. (a) 원본 스테레오스코픽 영상, (b) Saliency 지도 (공간적 요소), (c) 움직임 정보 (시간적 요소), (d) 변이 지도 (깊이 요소), (e) 스테레오스코픽 비디오를 위한 3차 원 시각 주의 모델, (f) 동공 추적 장비를 이용한 실제 실험자의 Saliency 지도, (g) 공간적 요소 기반의 ROI 추 출 결과, (h) 시간적 요소 기반의 ROI 추출 결과, (i) 3차원 시각 주의 모델 기반의 ROI 추출 결과
Fig. 6. The 3D-visual-attention-model-based ROI extraction results of the “Cafe” sequence. (a) One view of stereoscopic video; (b) Static image saliency map (Spatial factor); (c) Motion information (Temporal factor); (d) Disparity map (Depth factor); (e) Final 3D visual attention model for stereoscopic video; (f) Extracted ROI using human saliency map by performing eye-tracking experiments; (g) Extracted ROI using spatial factor; (h) Extracted ROI using temporal factor; (i) Extracted ROI using depth factor; (j) Extracted ROI based on the 3D visual attention model.
texture information and depressing noise in each channel.
Ⅵ. Conclusion
In this paper, to consider the HVS for stereoscopic video and eciently measure the quality of stereoscopic video, we propose the no-reference SVQA method that uses 3DVA-based pooling. The 3DVA is generated based on three factors: spatial, temporal, and depth features. They are very important features for simulating HVS when viewing stereoscopic video.
For measuring the blurring and blocking distortions which generally appear in compressed video, we propose the NR SVQA using the wavelet coecients obtained from the compressed stereoscopic video. For the proposed NR SVQA, the 3DVA is used for pooling on signicant regions which correspond with human perceptual attention. Our experimental results demonstrate that, the proposed NR SVQA method provides consistent results and outperform in various coding conditions for MPEG 3DV and 3dtv.at databases. This improvement comes from the fact that 3DVA-based pooling can obtain object
information which may improve the performance. As another application, the 3DVA is used to extract ROI.
Both objective and subjective evaluations of extracted ROIs indicated that the 3DVA-based on ROI extraction outperforms the other extraction methods using spatial or/and temporal terms. In future work, we will extend our research to enhance measurements to provide more effective performance.
REFERENCES
[1] H. Lee, “3D video and human factors,” Journal of The Institute of Electronics Engineers of Korea, Vol. 37, no. 9, pp. 84-92, September 2010.
[2] Z. Wang and A. C. Bovik, “Mean squared error: Love it or leave it? A new look at signal fidelity measures,” IEEE Signal Processing Magazine, Vol. 26, no. 1, pp.
98-117, January 2009.
[3] Z. Wang, A. C. Bovik, H. R. Sheikh and E. P.
Simoncelli, “Image quality assessment: From error visibility to structural similarity,” IEEE Trans. on Image Processing, Vol. 13, no. 4, pp.
600-612, April 2004.
[4] Z. Wang, and X. Shang, “Spatial pooling strategies for perceptual image quality
assessment,” in Proc. of IEEE Int. Conf. on Image Processing, pp. 2945-2948, Atalanta, USA, October 2006.
[5] D. Min, and K. Sohn, “Virtual view rendering for 2D/3D freeview video generation,” Journal of The Institute of Electronics Engineers of Korea, Vol. 45, no. 4, pp. 22-31, July 2008.
[6] A. Benoit, P. Le Callet, P. Campisi, R. Cousseau,
“Quality assessment of stereoscopic images,”
EURASIP Journal on Image and Video Processing, Vol. 2008, pp. 1-13, December 2008.
[7] M. Lambooij, W. IJsselsteijn, D. G. Bouwhuis and I. Heynderickx, “Evaluation of stereoscopic images: beyond 2d quality,” IEEE Trans. on Broadcasting, Vol. 57, no. 2, pp. 432-444, June 2011.
[8] A. K. Moorthy, C. C. Su, A. Mittal and A. C.
Bovik, “Subjective evaluation of stereoscopic image quality,” Signal Processing: Image Communication, Vol. 28, no. 8, pp. 870-883, September 2012.
[9] Z. M. P. Sazzad, S. Yamanaka, Y. Kawayokeita and Y. Horita, “Stereoscopic image quality prediction,” in Proc. Int. Workshop on Quality of Multimedia Experience, pp. 180-185, San Diego, USA, July 2009.
[9] J. Seo, X. Liu, D. Kim and K. Sohn, “An objective video quality metric for compressed stereoscopic video,” Circuits, Systems, and Signal Processing, Vol. 31, no. 3, pp. 1089-1107, July 2012.
[10] J. Yang, C. Hou, R. Xu, J. Lei, “New metric for stereo image quality assessment based on HVS,”
Int. Journal of Imaging Systems and Technology, Vol. 20, no. 4, pp. 301-307, November 2010.
[11] L. Itti, C. Koch and E. Niebur, “A model of saliency-based visual attention for rapid scene analysis,” IEEE Trans. on Pattern Analysis and Machine Intelligence, Vol. 20, no. 11, pp.1254-1259, November 1998.
[12] D. Walther, and C. Koch, “Modeling attention to salient proto-objects,” Neural Networks, Vol. 19, no. 9, pp. 1395-1407, November 2006.
[13] U. Rajashekar, I. van der Linde, A. C. Bovik and L. K. Cormack, “Gaffe: A gaze-attentive fixation finding engine,” IEEE Trans. on Image Processing, Vol. 17, no. 4, pp. 564-573, April 2008.
[14] M. Barkowsky, J. Bialkowski, B. Eskoer, R.
Bitto and A. Kaup, “Temporal trajectory aware video quality measure,” IEEE Journal of Selected Topics in Signal Processing, Vol. 3, no. 2, pp. 266-279, April 2009.
[15] L. Itti and C. Koch, “Feature combination strategies for saliency-based visual attention systems,” Journal of Electronic Imaging, Vol.
10, no. 1, pp. 161-169, January 2001.
[16] A. Ninassi, O. Le Meur, P. Le Callet and D.
Barba, “Considering temporal variations of spatial visual distortions in video quality assessment,” IEEE Journal of Selected Topics in Signal Processing, Vol. 3, no. 2, pp. 253-265, April 2009.
[17] L. Itti and C. Koch, “Computational modeling of visual attention,” Nature reviews neroscience, Vol. 2, no. 3, pp. 194-203, March 2001.
[18] W. Epstein and S. Rogers, Perception of space and motion, Academic Press., pp. 69-117, 1995.
[19] D. R. Prott, J. Stefanucci, T. Banton and W.
Epstein, “The role of effort in perceiving distance,” Psychological Science, Vol. 14, no. 2, pp. 106-112, March 2003.
[20] R. Li, B. Zeng and M. L. Liou, “A new three-step search algorithm for block motion estimation,” IEEE Trans, on Circuits and Systems for Video Technology, Vol. 4, no. 4, pp.
438-442, August 1994.
[21] J. Karathanasis, D. Kalivas and J. Vlontzos
“Disparity estimation using block matching and dynamic programming,” in Proc. IEEE Int. Conf.
on Electronics, Circuits, and Systems, Vol. 2, pp.
728-731, Rodos, Greece, October 1996.
[22] D. Min, S. Yea, Z. Arican, and A. Vetro
“Disparity search range estimation: enforcing temporal consistency,” in Proc. IEEE Int. Conf.
on Acoustics Speech and Signal Processing, pp.
2366-2369, Dallas, USA, March 2010.
[23] http://www.middlebury.edu/stereo
[24] S. Zeki, J. Watson, C. Lueck, K. Friston, C.
Kennard, R. Frackowiak, “A direct demonstration of functional specialization in human visual cortex,” The Journal of Neuroscience, Vol. 11, no. 3, pp. 641-649, March 1991.
[25] I. P. Howard, and B. J. Rogers, Seeing in Depth, Oxford Univ. Press, 2008.
[26] S. J. Watt, K. Akeley, M. O. Ernst, M. S.
Banks, “Focus cues aect perceived depth,”
Journal of Vision, Vol. 5, no. 10, pp. 834-862 December 2005.
![Fig. 3. Results of depth estimation with correct and incorrect search range for Middlebury stereo image [23]](https://thumb-ap.123doks.com/thumbv2/123dokinfo/5071235.559624/5.892.88.808.758.1062/results-depth-estimation-correct-incorrect-search-middlebury-stereo.webp)