Tuberc Respir Dis 2012;72:433-440
CopyrightⒸ2012. The Korean Academy of Tuberculosis and Respiratory Diseases. All rights reserved.
The Effect of Body Composition on Pulmonary Function
Jung Eun Park, M.D., Jin Hong Chung, M.D., Kwan Ho Lee, M.D., Kyeong Cheol Shin, M.D.
Department of Internal Medicine, Regional Center for Respiratory Disease, Yeungnam University Medical Center, Yeungnam University College of Medicine, Daegu, Korea
Background: The pulmonary function test is the most basic test method to diagnosis lung disease. The purpose of this study was to research the correlation of the body mass index (BMI), the fat percentage of the body mass (fat%), the muscle mass, the fat-free mass (FFM) and the fat-free mass index (FFMI), waist-hip ratio (WHR), on the forced expiratory volume curve.
Methods: Between March and April 2009, a total of 291 subjects were enrolled. There were 152 men and 139 female (mean age, 46.3±9.92 years), and they were measured for the following: forced vital capacity (FVC), forced expiratory volume at 1 second (FEV1), and forced expiratory flow during the middle half of the FVC (FEF25-75) from the forced expiratory volume curve by the spirometry, and the body composition by the bioelectrical impedance method. Correlation and a multiple linear regression, between the body composition and pulmonary function, were used.
Results: BMI and fat% had no correlation with FVC, FEV1 in male, but FFMI showed a positive correlation. In contrast, BMI and fat% had correlation with FVC, FEV1 in female, but FFMI showed no correlation. Both male and female, FVC and FEV1 had a negative correlation with WHR (male, FVC r=−0.327, FEV1 r=−0.36; p<0.05;
female, FVC r=−0.175, FEV1 r=−0.213; p<0.05). In a multiple linear regression of considering the body composition of the total group, FVC explained FFM, BMI, and FFMI in order (r2=0.579, 0.657, 0.663). FEV1 was explained only fat% (r2=0.011), and FEF25-75 was explained muscle mass, FFMI, FFM (r2=0.126, 0.138, 0.148).
Conclusion: The BMI, fat%, muscle mass, FFM, FFMI, WHR have significant association with pulmonary function but r2 (adjusted coefficient of determination) were not high enough for explaining lung function.
Key Words: Pulmonary Function Tests; Body Compostion; Factor Analysis, Statistical
Address for correspondence: Jin Hong Chung, M.D.
Department of Intenal Medicine, Yeungnam University Hospital, 170, Hyeonchung-ro, Nam-gu, Daegu 705-717, Korea
Phone: 82-53-620-3840, Fax: 82-53-654-8386 E-mail: [email protected]
Received: Jan. 10, 2012 Revised: Jan. 30, 2012 Accepted: Mar. 29, 2012
Introduction
Pulmonary function test is one of the basic and essen- tial tests for diagnosis and assessment of pulmonary dis- eases such as pulmonary dysfunction, chronic ob- structive pulmonary disease (COPD) and asthma1,2. Factors affecting pulmonary functions include age, body weight and height, and gender. Since those factors are significantly associated with pulmonary functions, they
are used for equation of regression calculating predicted normal values of pulmonary functions test. Correlation between body composition such as body mass index (BMI), waist measure, fat mass and pulmonary functions has been studied since later 1950s. However, study re- sults of correlation between pulmonary functions and body composition have been different from each other.
In addition, since the mechanism of body composition affecting pulmonary functions has not been fully under- stood, body composition is not used as a factor for equation predicting pulmonary function2,3.
According to Maiolo et al.4, correlation between forced vital capacity (FVC) and BMI, waist measurement and fat mass is more significant than that between forced expiratory volume at 1 second (FEV1) and BMI, waist measurement and fat mass. Fat accumulation in
thoracic and abdominal cavities arise changes in respira- tory function including sluggish thoracic movements and pulmonary compliance in thoracic cavity, reduced inspiratory capacity and falling of diaphragm4. Waist-hip ratio (WHR) which is associated with body fat dis- tribution also has a correlation with pulmonary func- tion5. Compared with females who usually have an in- tensive peripheral fat distribution, central obesity is common in males. As a result, difference in correlation according to changes in body composition is larger in males then in females6.
Fat free mass (FFM) is mainly composed of muscles, and is associated with physical activities and accord- ingly, pulmonary function can be enhanced through physical efforts7. As a result of a large-scale study on the correlation between hand grip strength, and FVC and FEV1, a significant positive correlation was con- firmed. This means that FFM can independently affect respiratory muscles regardless of physical activities8. Low FFM reduces FEV1, and reflects reduction in respi- ratory muscle mass5. FFM index and FFM/height2 (fat-free mass index [FFMI]) are values calculating FFM based on the consideration of body size.
In the present study, we confirmed whether use of values of body composition and fat distribution in the body in addition to factors such as age, body weight, height and gender is useful or not for predicting results of pulmonary function test, and investigated effects body composition and fat distribution on pulmonary function.
Materials and Methods
1. SubjectsMales and females in their 20s through 70s of age who underwent pulmonary function tests and body composition analysis (BCA) at Yeungnam University Hospital Health Promotion Center between April 2009 and June 2009 participated in the present study.
Excluding candidates who have history of hypertension, diabetes, malignant tumor, heart diseases and respira- tory diseases such as acute respiratory infection, tuber-
culosis, COPD, asthma, pulmonary fibrosis, bron- chiectasis, and pleural diseases, a total of 291 subjects were finally selected for the present study. Numbers of male and female subjects were 152 and 139, re- spectively, with a mean age of 46.
2. Methods
Pulmonary function test was conducted by measuring FVC, FEV1 and mean forced expiratory flow during the middle half of the FVC (FEF25-75) at a forced expiratory curve using a spirometry (Vmax 229; Sensor Medics, Yorba Linda, CA, USA).
Through a bioelectrical impedance method using Inbody 2.0 (Biopass, Seoul, Korea), body composition values including body weight, height, BMI (kg/m2), body fat percentage (fat percentage, fat%, %), muscle mass (kg), FFM (kg), FFMI (FFM/height2) and WHR were measured.
3. Statistical processing
SPSS version 18.0 (SPSS Inc., Chicago, IL, USA) was used for statistical processing. Difference according to gender was investigated using unpaired independent t-test. In order to find out correlation between pulmo- nary function and body composition factors, mainly FVC, FEV1 and FEF25-75 were used. In addition, effects of body composition factors on pulmonary function were investigated using multiple linear regression. In or- der for correcting mutual functions among body compo- sition factors, the factors which are highly associated with the result of pulmonary function test were inves- tigated using stepwise selection upon consideration of multicollonearity in multiple linear regression and then, prediction on pulmonary functions test was indirectly calculated using body composition factors. Regresiven- ess was expressed using adjusted coefficient of determi- nation r2. Statistical significance level was set at less than 0.05.
Results
Mean age of the subjects was 46.3, and means of
Table 1. Characteristics of the study group
Total (n=291) Male (n=152) Female (n=139) p-value*
Age, yr 46.3±9.92 46.8±10.08 45.8±9.87 0.381
Height, m 1.64±0.08 1.7±0.05 1.58±0.05 0.000
Body weight, kg 63.2±10.81 69.1±10.22 56.9±7.38 0.000
BMI, kg/m2 23.3±3.05 23.8±3.06 22.7±2.94 0.002
Fat, % 26.5±6.95 22.3±5.48 30.9±5.46 0.000
Muscle, kg 43.7±8.68 50.5±5.62 36.5±4.66 0.000
FFM, kg 46.5±8.78 53.4±5.97 39.0±3.94 0.000
FEMI, kg/m2 17.0±2.01 18.4±1.56 15.6±1.31 0.000
Waist-hip ratio 0.929±0.54 0.897±0.03 0.965±0.78 0.305
FVC, L 3.56±0.81 4.12±0.63 2.94±0.46 0.000
FEV1, L 4.31±23.10 5.95±31.9 2.51±0.41 0.187
FEF25-75, L 3.32±1.09 3.57±1.22 3.02±0.84 0.000
Values are mean±SD.
*Independent t-test between male and female, p<0.05.
BMI: body mass index; Fat, %: fat percentage of body mass; FFM: free fat mass; FFMI: free fat mass index; FVC: forced vital capacity; FEV1: forced expiratory volume at 1 second; FEF25-75: mean forced expiratory flow during the middle half of the FVC.
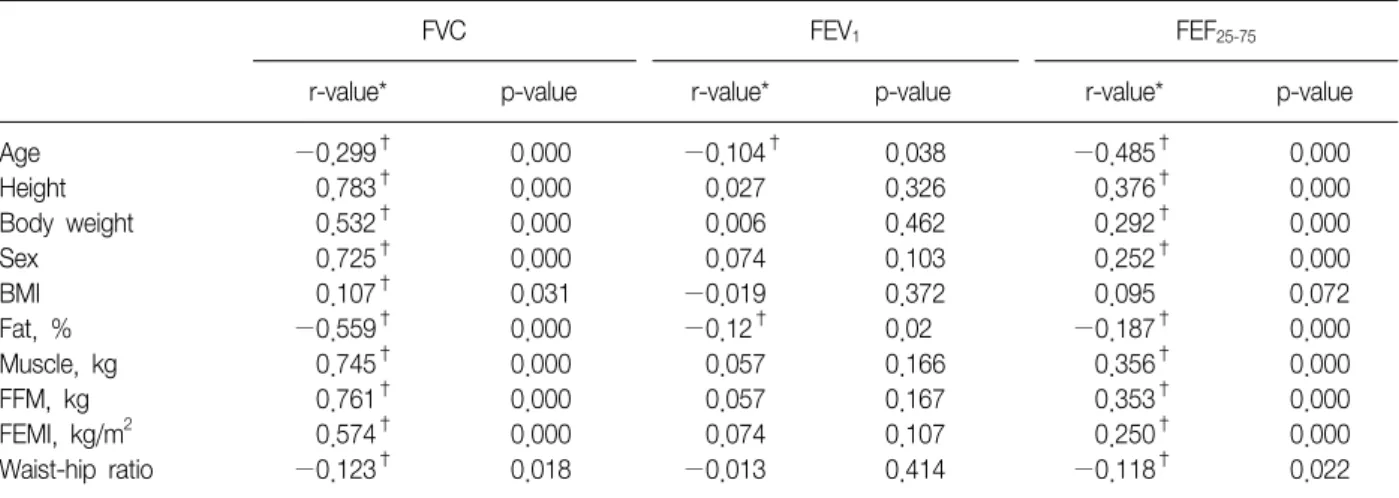
Table 2. Inter-correlations between the variables (total, n=291)
FVC FEV1 FEF25-75
r-value* p-value r-value* p-value r-value* p-value
Age −0.299† 0.000 −0.104† 0.038 −0.485† 0.000
Height 0.783† 0.000 0.027 0.326 0.376† 0.000
Body weight 0.532† 0.000 0.006 0.462 0.292† 0.000
Sex 0.725† 0.000 0.074 0.103 0.252† 0.000
BMI 0.107† 0.031 −0.019 0.372 0.095 0.072
Fat, % −0.559† 0.000 −0.12† 0.02 −0.187† 0.000
Muscle, kg 0.745† 0.000 0.057 0.166 0.356† 0.000
FFM, kg 0.761† 0.000 0.057 0.167 0.353† 0.000
FEMI, kg/m2 0.574† 0.000 0.074 0.107 0.250† 0.000
Waist-hip ratio −0.123† 0.018 −0.013 0.414 −0.118† 0.022
*Correlation coefficient. †p<0.05.
FVC: forced vital capacity; FEV1: forced expiratory volume at 1 second; FEF25-75: mean forced expiratory flow during the middle half of the FVC; BMI: body mass index; Fat, %: fat percentage of body mass; FFM: free fat mass; FFMI: free fat mass index.
height and body weight were 1.64 m and 63.2 kg, respectively. No significant difference in age, WHR and FEV1 was found between males and females. Among body composition factors, females showed significantly higher level only in body fat percentage than males, while males showed higher levels in all the remaining factors such as muscle mass, FFM and FFMI (p<0.05) (Table 1).
In both males and females, FVC showed positive cor- relations with age, gender and BCA, and negative corre-
lations with age, body fat percentage and WHR. FEV1
showed significant negative correlations with age and body fat percentage. FEF25-75 showed correlations with BCA excluding BMI, and like FVC, showed negative correlations with age, body fat percentage. Therefore, factors associated with all of FVC, FEV1, and FEF25-75
were age and body fat percentage, and in cases of eld- erly subjects or higher body fat percentage, values of pulmonary function test results were lower showing negative correlations (Table 2).
Table 3. Inter-correlations between the variables (male, n=152)
FVC FEV1 FEF25-75
r-value* p-value r-value* p-value r-value* p-value
Age −0.509† 0.000 −0.667† 0.000 −0.531† 0.000
Height 0.506† 0.000 0.494† 0.000 0.286† 0.000
Body weight 0.271† 0.000 0.308† 0.000 0.239† 0.002
BMI 0.06 0.231 0.107 0.095 0.127 0.059
Fat, % −0.151 0.32 −0.123 0.065 −0.012 0.441
Muscle, kg 0.446† 0.000 0.476† 0.000 0.317† 0.000
FFM, kg 0.447† 0.000 0.476† 0.000 0.318† 0.000
FEMI, kg/m2 0.221† 0.003 0.269† 0.000 0.221† 0.005
Waist-hip ratio −0.327† 0.000 −0.36† 0.000 −0.221 0.003
*Correlation coefficient. †p<0.05.
FVC: forced vital capacity; FEV1: forced expiratory volume at 1 second; FEF25-75: mean forced expiratory flow during the middle half of the FVC; BMI: body mass index; Fat, %: fat percentage of body mass; FFM: free fat mass; FFMI: free fat mass index.
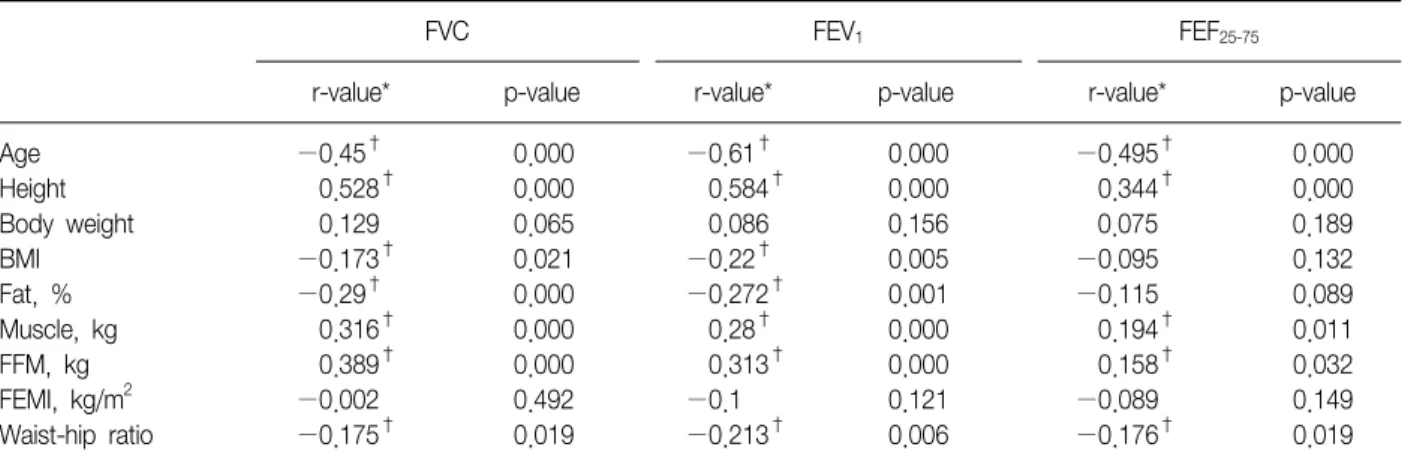
Table 4. Inter-correlations between the variables (female, n=139)
FVC FEV1 FEF25-75
r-value* p-value r-value* p-value r-value* p-value
Age −0.45† 0.000 −0.61† 0.000 −0.495† 0.000
Height 0.528† 0.000 0.584† 0.000 0.344† 0.000
Body weight 0.129 0.065 0.086 0.156 0.075 0.189
BMI −0.173† 0.021 −0.22† 0.005 −0.095 0.132
Fat, % −0.29† 0.000 −0.272† 0.001 −0.115 0.089
Muscle, kg 0.316† 0.000 0.28† 0.000 0.194† 0.011
FFM, kg 0.389† 0.000 0.313† 0.000 0.158† 0.032
FEMI, kg/m2 −0.002 0.492 −0.1 0.121 −0.089 0.149
Waist-hip ratio −0.175† 0.019 −0.213† 0.006 −0.176† 0.019
*Correlation coefficient. †p<0.05.
FVC: forced vital capacity; FEV1: forced expiratory volume at 1 second; FEF25-75: mean forced expiratory flow during the middle half of the FVC; BMI: body mass index; Fat, %: fat percentage of body mass; FFM: free fat mass; FFMI: free fat mass index.
In case of male, no significant correlations with FVC, BMI, and body fat percentage were found. Instead, pos- itive correlations with muscle indexes such as muscle mass, FFM, and FFMI were found while significant neg- ative correlations with WHR which is an obesity index were found. Both FEV1 and FEF25-75 did not show sig- nificant correlations with BMI and body fat percentage.
FEF25-75 did not show a correlation with WHR, either.
Accordingly, in case of male, FVC, FEV1, and FEF25-75
did not show significant correlations with BMI and body fat percentage (Table 3).
In case of female, factors associated with all of FVC,
FEV1, and FEF25-75 were age, height, BMI, body fat per- centage, muscle mass, FFM and WHR, and no sig- nificant correlation was found between body weight and FFMI (Table 4).
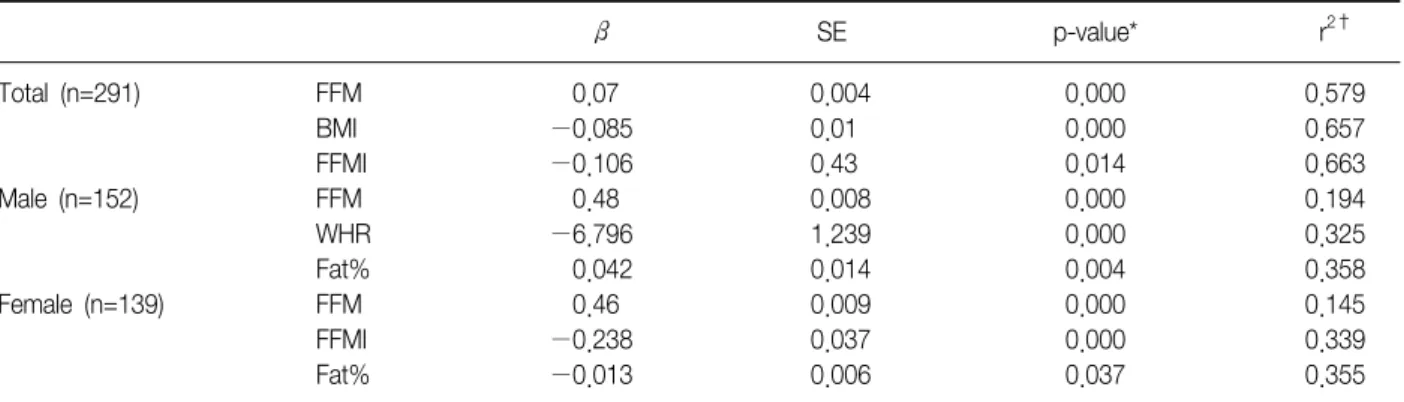
As a result of multiple linear regression, in terms of FVC in both males and females, most statistical sig- nificance was found in FFM followed by BMI and FFMI (p<0.05). Changes in FVC upon completion of correct- ing FFM and BMI could be explained by 66% through the changes in FFMI. In case of male, the most sig- nificance was observed in free mass followed by WHR and body fat percentage (p<0.05), while in case of fe-
Table 5. Results of multiple regression analysis for the FVC including body composition (BMI, fat%, muscle, FFM, FFMI, and WHR)
β SE p-value* r2†
Total (n=291) FFM 0.07 0.004 0.000 0.579
BMI −0.085 0.01 0.000 0.657
FFMI −0.106 0.43 0.014 0.663
Male (n=152) FFM 0.48 0.008 0.000 0.194
WHR −6.796 1.239 0.000 0.325
Fat% 0.042 0.014 0.004 0.358
Female (n=139) FFM 0.46 0.009 0.000 0.145
FFMI −0.238 0.037 0.000 0.339
Fat% −0.013 0.006 0.037 0.355
*p<0.05. †Adjusted coeffiecient of determination.
FVC: forced vital capacity; BMI: body mass index; Fat%: fat percentage of the body mass; FFM: fat-free mass; FFMI: fat-free mass index; WHR: waist-hip ratio; β: regression coefficient; SE: standard error.
Table 6. Results of multiple regression analysis for the FEV1 including body composition (BMI, fat%, muscle, FFM, FFMI, and WHR)
β SE p-value* r2†
Total (n=291) Fat% −0.399 0.194 0.041 0.011
Male (n=152) FFM 0.05 0.007 0.000 0.222
WHR −7.248 1.156 0.000 0.380
Fat% 0.062 0.013 0.000 0.462
FFMI 0.162 0.057 0.005 0.487
Female (n=139) FFM 0.033 0.009 0.000 0.091
FFMI −0.224 0.03 0.000 0.345
WHR −0.089 0.036 0.015 0.368
*p<0.05. †Adjusted coeffiecient of determination.
FEV1: forced expiratory volume at 1 second; BMI: body mass index; Fat%: fat percentage of the body mass; FFM: fat-free mass;
FFMI: fat-free mass index; WHR: waist-hip ratio; β: regression coefficient; SE: standard error.
male, FVC was most significantly observed in FFM fol- lowed by FFMI and body fat percentage. After correct- ing FFM and WHR in males, and correcting FFM and FFMI in females, changes in FVC occurred by changes in body fat percentage in males and females were 35%
and 35%, respectively (p<0.05) (Table 5).
In terms of FEV1, body fat percentage was the only factor significantly associated with in both males and females. When body fat percentage increased by 1%, FEV1 decreased by 399 mL. Most significance in male was observed in FFM followed by WHR, body fat per- centage and FFMI. After these 3 were corrected, and 1 unit of FFMI was increased, FEV1 increased by 162 mL or 48%. In case of females, most influence was ob-
served in FFM followed by FFMI and WHR. When FFM and FFMI were corrected, FEV1 decreased by 89 mL with an increase in WHR by 0.01 (Table 6).
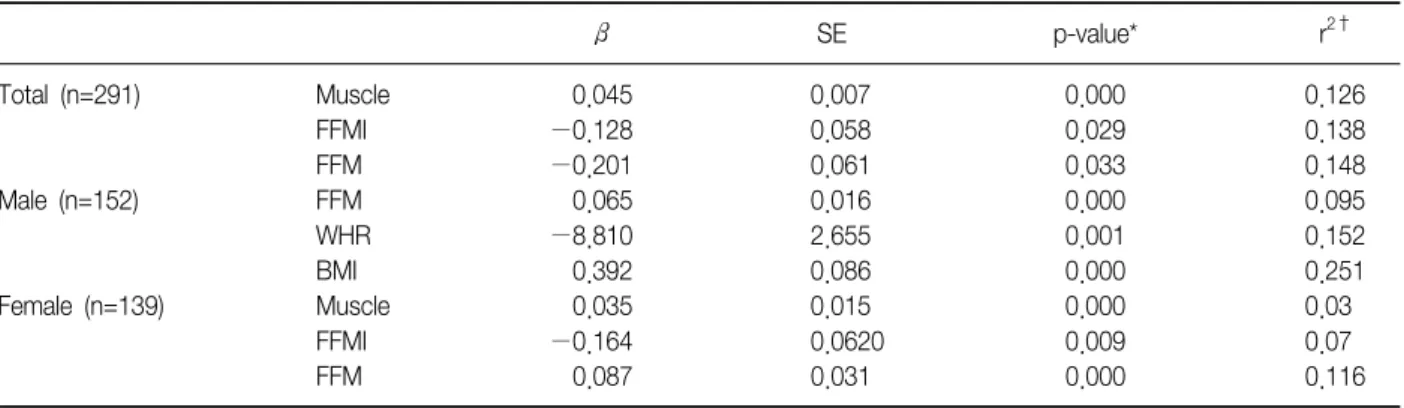
In terms of FEF25-75, most significance in both males and females was observed in muscle mass followed by FFMI and FFM: in males, in the order of FFM, WHR and BMI, and in females, same order as in both males and females (Table 7).
Not only body composition factors, but predicted val- ues of pulmonary function test as well as height, body weight, age and gender were obtained as significant fac- tors (p<0.05) using multiple linear regression, and pro- gressiveness was expressed as adjusted coefficient of determination r2 (Table 8). In addition, adjusted co-
Table 7. Results of multiple regression analysis for the FEF25-75 including body composition (BMI, fat%, muscle, FFM, FFMI, and WHR)
β SE p-value* r2†
Total (n=291) Muscle 0.045 0.007 0.000 0.126
FFMI −0.128 0.058 0.029 0.138
FFM −0.201 0.061 0.033 0.148
Male (n=152) FFM 0.065 0.016 0.000 0.095
WHR −8.810 2.655 0.001 0.152
BMI 0.392 0.086 0.000 0.251
Female (n=139) Muscle 0.035 0.015 0.000 0.03
FFMI −0.164 0.0620 0.009 0.07
FFM 0.087 0.031 0.000 0.116
*p<0.05. †Adjusted coeffiecient of determination.
FEF25-75: mean forced expiratory flow during the middle half of the forced vital capacity; BMI: body mass index; Fat%: fat percentage of the body mass; FFM: fat-free mass; FFMI: fat-free mass index; WHR: waist-hip ratio; β: regression coefficient; SE: standard error.
Table 9. The comparison of r2 according to variables (total, n=291)
Variables* r2†
FVC Height, weight, sex, age 0.655
Height, weight, sex, age+Fat%, FFMI, WHR 0.673
All variables‡ 0.682
FEV1 Height, weight, sex, age 0.002
Height, weight, sex, age+Fat%, FFMI, WHR 0.003
All variables‡ 0.002
FEF25-75 Height, weight, sex, age 0.147
Height, weight, sex, age+Fat%, FFMI, WHR 0.149
All variables‡ 0.148
*All variables were meant height, weight, sex, age, BMI, fat%, muscle, FFM, FFMI, and WHR. †Adjusted coeffiecient of determination.
‡This variables were independent of p-value.
FVC: forced vital capacity; Fat%: fat percentage of the body mass; FFMI: fat-free mass index; WHR: waist-hip ratio; FEV1: forced expiratory volume at 1 second; FEF25-75: mean forced expiratory flow during the middle half of the FVC.
Table 8. The FVC, FEV1, and FEF25-75 equation fomular by multiple linear regression analysis (stepwise method)
Equation fomular (total, n=291) r2†
FVC (L) =(−0.861)+(3.079 )*Height+(−0.454)*Sex+(−0.019)*Age+(0.024)*FFM+(−0.014)*Fat% 0.717
FEV1 (L) =14.884+(−0.399)*Fat% 0.011
FEF25-75 (L) =3.950+(−0.05)*Age+(0.039)*Muscle 0.325
*This was meant significant factors (p<0.05) among all variables, height, weight, sex, age, BMI, fat%, muscle, FFM, FFMI, and WHR. †Adjusted coeffiecient of determination.
FVC: forced vital capacity; FEV1: forced expiratory volume at 1 second; FEF25-75: mean forced expiratory flow during the middle half of the FVC; FFM: fat-free mass; Fat%: fat percentage of the body mass.
efficients of determination of pulmonary function test prediction equation reflecting height, body weight, age and gender, and adjusted coefficients of determination
of body composition factors, and adjusted coefficients of determination including all factor were compared (Table 9).
Discussion
Pulmonary function test is a basic and essential test for diagnosis and assessment of pulmonary dysfunction, pulmonary diseases, and treatment effects. Predicted normal values of pulmonary functions test is calculated by an equation of regression reflecting gender, age, height, and body weight due to the significant correla- tion with pulmonary functions test values2. Since other body measures have also been reported to have correla- tions with the result of pulmonary functions test, studies to find an equation of regression of pulmonary func- tions values according to other body measures have continued1. Among body measures, body weight and BMI are conveniently used, but they are not differ- entiated by fat mass or muscle mass. In addition, appli- cation to males and people with low body weight is not appropriate compared with females and overweight people. Since fat distribution in the body is not consid- ered in body weight and BMI, studies on correlation be- tween pulmonary function and fat distribution in the body have also been conducted these days6,9. Mengesha investigated correlations between pulmo- nary function and body composition in European males and females. In both males and females, age and height showed a significant correlation with FVC and FEV1, and in case of males, FVC and FEV1 showed correlations with body weight, body fat percentage and FFM, but in case of females, no significance was observed10. By comparison, significant correlation was observed in both males and females in the present study. In case of male, FVC and FEV1 showed significant correlations with muscle mass and FFM, FFMI and WHR, and FEF25-75 showed significant correlations with muscle mass, FFM and FFMI. In case of female similar to males, significant correlations were also observed with BMI and body fat percentage, and with a 1% increase in body fat percentage, 13 mL of FVC decreased.
In case of male, FFMI showed a positive correlation with FVC and FEV1, which is opposite to body fat percentage. Therefore, FFMI and body fat percentage are appropriate but BMI is not because BMI is ex-
pressed as the ratio of weight to the square of height.
In case of female, FFMI shows same level of reverse effects on expiratory reserve volume and inspiratory ca- pacity and accordingly, offset effects occur. According- ly, BMI or body fat percentage can be used, not FFMI2,11. In case of male in the present study, FVC and FEV1 did not show correlation with BMI and body fat percentage, but showed significant correlation with FFMI. In case of female, correlation was found between BMI and body fat percentage, but no significant correla- tion with FFMI was found. This was because FFM com- posed most of the body weight in males, and body fat percentage of females was higher than that of males.
In accordance with the increasing attention on obe- sity, studies on correlation between the results of pul- monary functions test and obesity have been con- ducted. In particular, correlation between waist measure and WHR were investigated. As a result, waist measure showed negative correlation with FVC and FEV1, and with a 1 cm increase in waist measure, 13 mL and 11 mL reductions in FVC and FEV1, respectively were ob- served12,13. Distribution of body fat also affects pulmo- nary function: the larger the waist measure or WHR were meaning the more fat distribution in upper body, the less the pulmonary function was. With an increasing abdominal fat deposition, thoracic volume reduces and consequently, not only vital capacity but power of respi- ratory muscles decrease deteriorating mechanical effi- ciency of thorax. In addition, pulmonary capacity de- clines and as a result of shallow and rapid respirations, respiratory dead space increases, and eventually trache- al obstruction and partial atelectasis develop3. In addi- tion, large WHR usually results in a high risk of devel- oping visceral abdominal obesity. Levels of systemic in- flammatory cells such as cytokine including leptin, C-re- ative protein and fibrinogen are high in obesity cells, and systemic inflammation is considered to be asso- ciated with deteriorating pulmonary functions14. In the present study, pulmonary function and WHR in case of male were confirmed to have negative correlation. In case of male, when WHR increased by 0.01, FVC de- creased by 67.9 mL, FEV1 decreased by 72.4 mL and
FEF25-75 decreased by 88.1 mL.
Multiple body composition factors were confirmed to have correlations with the results of pulmonary func- tions test. However, adjusted coefficient of determi- nation was not high according to multiple linear re- gression excluding height, age and body weight (Tables 5∼7). Pulmonary functions prediction formula was ob- tained using significant variables (p<0.05) by conduct- ing a stepwise method of multiple linear regression on the variables including height, body weight, age and gender (Table 8). The pulmonary functions prediction formula which took into consideration of body compo- sition factors did not have a higher adjusted coefficient of determination than the current pulmonary functions prediction formula which took into consideration of height, age, body weight and gender only (Table 9).
In other words, correlation was found but the prediction formula based on the body composition factors did not show enough explicability to replace the current pulmo- nary functions prediction formula.
In the present study, only FVC, FEV1, and FEF25-75
were measured and accordingly, correlations with addi- tional pulmonary functions test values such as total lung capacity, inspiratory capacity and functional residual ca- pacity were not described. Correlation with smoking was also not discussed. Another limitation of the pres- ent study is that the waist-hip measures were not meas- ured but calculated at Inbody and consequently, differ- ences may exist.
In conclusion, not only age, gender and body weight, body fat percentage, muscle mass, FFM, FFMI and WHR also affect FVC, FEV1, and FEF25-75. In order to use these factors for a pulmonary functions prediction formula, additional studies may be required in the future.
References
1. Miller A. Lung function testing: selection of reference values and interpretative strategies. Am Rev Respir Dis 1992;146(5 Pt 1):1368-9.
2. Kim SR, Choi US, Choi JH, Koh HJ. Association of body fat and body mass index with pulmonary function in
women in their forties. J Korean Acad Fam Med 2003;24:827-32.
3. Park JY, Pack JH, Park HJ, Bae SW, Shin KC, Chung JH, et al. The effect of body mass index, fat percent- age, and fat-free mass index on pulmonary function test: with particular reference to parameters derived from forced expiratory volume curve. Tuberc Respir Dis 2003;54:210-8.
4. Maiolo C, Mohamed EI, Carbonelli MG. Body composi- tion and respiratory function. Acta Diabetol 2003;40 Suppl 1:S32-8.
5. Wannamethee SG, Shaper AG, Whincup PH. Body fat distribution, body composition, and respiratory func- tion in elderly men. Am J Clin Nutr 2005;82:996-1003.
6. Chen Y, Horne SL, Dosman JA. Body weight and weight gain related to pulmonary function decline in adults: a six year follow up study. Thorax 1993;48:
375-80.
7. Amara CE, Koval JJ, Paterson DH, Cunningham DA.
Lung function in older humans: the contribution of body composition, physical activity and smoking. Ann Hum Biol 2001;28:522-36.
8. Burchfiel CM, Enright PL, Sharp DS, Chyou PH, Rodriguez BL, Curb JD. Factors associated with varia- tions in pulmonary function among elderly Japanese- American men. Chest 1997;112:87-97.
9. Chen Y, Rennie D, Cormier YF, Dosman J. Waist cir- cumference is associated with pulmonary function in normal-weight, overweight, and obese subjects. Am J Clin Nutr 2007;85:35-9.
10. Mengesha YA, Mekonnen Y. Spirometric lung function tests in normal non-smoking Ethiopian men and women. Thorax 1985;40:465-8.
11. Cotes JE, Chinn DJ, Reed JW. Body mass, fat percent- age, and fat free mass as reference variables for lung function: effects on terms for age and sex. Thorax 2001;56:839-44.
12. Santana H, Zoico E, Turcato E, Tosoni P, Bissoli L, Olivieri M, et al. Relation between body composition, fat distribution, and lung function in elderly men. Am J Clin Nutr 2001;73:827-31.
13. Harik-Khan RI, Wise RA, Fleg JL. The effect of gender on the relationship between body fat distribution and lung function. J Clin Epidemiol 2001;54:399-406.
14. Ochs-Balcom HM, Grant BJ, Muti P, Sempos CT, Freudenheim JL, Trevisan M, et al. Pulmonary function and abdominal adiposity in the general population.
Chest 2006;129:853-62.