RESEARCH ARTICLE
Impact of variability in estimated glomerular filtration rate on major clinical outcomes: A nationwide population-based study
Soojin Lee1,2, Sehoon Park3,4, Yaerim KimID5, Yeonhee Lee1,2, Min Woo Kang1,2, Semin Cho1,2, Yong Chul Kim1, Seung Seok HanID1,6, Hajeong LeeID1, Jung Pyo Lee1,6,7, Kwon Wook Joo1,2,6, Chun Soo Lim1,6,7, Yon Su Kim1,2,3,6, Kyungdo Han8*, Dong Ki KimID1,2,6*
1 Department of Internal Medicine, Seoul National University Hospital, Seoul, Korea, 2 Department of Internal Medicine, Seoul National University College of Medicine, Seoul, Korea, 3 Department of Biomedical Science. Seoul National University College of Medicine, Seoul, Korea, 4 Department of Internal Medicine, Armed Forces Capital Hospital, Gyeonggi-do, Korea, 5 Department of Internal Medicine, Keimyung University School of Medicine, Daegu, Korea, 6 Kidney Research Institute, Seoul National University College of Medicine, Seoul, Korea, 7 Department of Internal Medicine, Seoul National University Boramae Medical Center, Seoul, Korea, 8 Department of Statistics and Actuarial Science, Soongsil University, Seoul, Korea
*[email protected](KH);[email protected](DKK)
Abstract
Background
The estimated glomerular filtration rate (eGFR), commonly estimated using the serum creat- inine value, often fluctuates throughout the serial measurement. The clinical significance of GFR variation among the general population with normal renal function has not yet been demonstrated. Thus, we explored the impact of GFR variability on adverse clinical outcomes.
Methods
A nationwide retrospective cohort study using the Korean National Health Insurance System database was performed. National health screening examinees who underwent creatinine measurement�3 times between 2012 and 2016 were considered. Those with eGFR under 60 mL/min/m2were excluded. The fluctuation of eGFR was represented with variability inde- pendent of the mean (VIM) index; which was calculated by the standard deviation divided by the exponent of the regression coefficient of the mean. Then, the risks of myocardial infarc- tion (MI), stroke and death were assessed according to the quartiles of the VIM
Results
Of total 3,538,500 participants, 0.29% of myocardial infarction (MI), 0.14% of stroke, 0.36%
of deaths were observed during the median follow up of 3.27 years. Participants with the highest VIM index, which represents the highest eGFR variability, were significantly associ- ated with an increased risk of MI (hazard ratio [HR]; 1.10, 95% confidence interval [95% CI];
1.04–1.16), stroke (HR: 1.16; 95% CI 1.09–1.23), and death (HR: 1.18; 95% CI 1.12–1.24).
a1111111111 a1111111111 a1111111111 a1111111111 a1111111111
OPEN ACCESS
Citation: Lee S, Park S, Kim Y, Lee Y, Kang MW, Cho S, et al. (2020) Impact of variability in estimated glomerular filtration rate on major clinical outcomes: A nationwide population-based study. PLoS ONE 15(12): e0244156.https://doi.
org/10.1371/journal.pone.0244156 Editor: Ping-Hsun Wu, Kaohsiung Medical University Hospital, TAIWAN
Received: June 16, 2020 Accepted: December 4, 2020 Published: December 17, 2020
Copyright:© 2020 Lee et al. This is an open access article distributed under the terms of theCreative Commons Attribution License, which permits unrestricted use, distribution, and reproduction in any medium, provided the original author and source are credited.
Data Availability Statement: All relevant data are within the manuscript and itsSupporting Informationfiles.
Funding: The present study was funded from Seoul National University Hospital (3020180050).
The funders had no role in the study design, data collection and analysis, or decision to submit for publication.
Competing interests: All authors have declared that no competing interests exist.
The elevated risk of adverse events was consistent after the multivariate adjustment with potential confounding factors, except the risk of MI (HR 1.06; 95% 1.00–1.06).
Conclusions
Increased eGFR variability exhibited an association with major clinical outcomes, indicating that monitoring eGFR variability might be a useful parameter for predicting the adverse outcomes.
Introduction
The creatinine-based estimated glomerular filtration rate (eGFR) is the most widely used parameter to represent kidney function and stage the grade of chronic kidney disease (CKD) [1]. A single measured low eGFR exhibited an independent association with an increased risk of cardiovascular events, cardiovascular mortality, and all-cause mortality in CKD patients [2–
4]. In the general population, a subtle decrease in eGFR within the normal range was also asso- ciated with cardiovascular and all-cause mortality [5]. However, in subjects with preserved kidney function, eGFR differs considerably even with a slight change in serum creatinine and may vary within the tests. Thus, further investigations are needed to interpret the significance of eGFR fluctuations.
Previous reports tried to investigate more suitable indicators to reflect the changes in eGFR, such as the rate of eGFR decline or eGFR trajectory, to assess the prognosis among the CKD patients [6–9]. However, the evidence is still uncertain about using the same indicators to pre- dict outcomes among the general population whose renal function is relatively preserved. In this context, the fluctuation of several laboratory parameters was assessed and successfully pre- dicted the risk of cardiovascular events and mortality in the healthy population [10–14].
Currently, more accessible medical services and regular national health check-ups enable patients and even healthy individuals to undergo periodic laboratory examinations, including kidney function tests. Serial eGFR measurements may facilitate clinicians to detect the decline in kidney function early; however, it is indeterminate for interpreting eGFR variations in the general population. The present study aimed to determine the clinical significance of the vari- ability in multiple measurements of eGFR among individuals whose renal function is relatively preserved. We tried to examine whether eGFR variability could appropriately predict the risks of adverse outcomes and be applied to discriminate high-risk populations who require earlier intervention. Therefore, the current study was conducted using a nationwide, population- based dataset.
Material and methods Ethical consideration
The study was approved by the Institutional Review Board of Seoul National University Hospi- tal (IRB No. E-1801-027-913), and the designated government approved the approach to the database of the National Health Insurance System (NHIS). All authors followed the latest ver- sion of the Declaration of Helsinki throughout the study. As it was a retrospective study using fully anonymous and unidentifiable data without any additional intervention, informed con- sent was waived.
Study population
A population-based cohort study was performed using the National Health Screening examina- tion results obtained from the NHIS database [15]. The NHIS is a single organization managed by the Korean government and provides insured medical service to all Korean residents. The NHIS also offers the National Health Screening examination program, which includes general health check-ups and surveys, including lifestyle questionnaires. Non-office workers receive an annual examination, and the remaining office workers undergo a biannual examination.
All adult participants who underwent the National Health Screening examination with at least three creatinine measurements were screened between 2012 and 2016. Those with 1) missing creatinine values, 2) eGFR under 60 mL/min/1.73 m2at every measurement, 3) a pre- vious diagnosis of cardiovascular disease, or 4) previous kidney transplantation, or renal replacement therapy before of the initial creatinine measurement were excluded (Fig 1). Then, the risks of myocardial infarction (MI), stroke, and death were assessed.
Data collection
The NHIS dataset contains demographic information (e.g., age, sex, socioeconomic status, underlying diseases), claims data (e.g., prescription history, outpatient clinic visits and hospital admission), and health examination data (e.g., lifestyle questionnaires and laboratory exam results). The comorbidities and diagnosed disease information in the claims data were presented as International Classification of Disease, 10th Revision (ICD-10) codes. Height, weight, and blood pressure were measured by trained clinicians. Laboratory examination results included serum creatinine, the lipid profile, fasting glucose values sampled after overnight fasting, and uri- nalysis results. Samples were obtained in the NHIS-certified centers, which undergo quality con- trol regularly according to the standard guidelines. Smoking and alcohol consumption status were collected by self-reported questionnaires during the regular health examination.
Variability in eGFR
The glomerular filtration rate (GFR) was estimated with the Modification of Diet in Renal Dis- ease (MDRD) equation, using the serum creatinine value measured with a non-isotope
Fig 1. Flow diagram of study participants. The diagram indicates the inclusion and exclusion criteria for the study populations.
https://doi.org/10.1371/journal.pone.0244156.g001
dilution mass spectrometry (IDMS) assay by the Jaffe kinetic method [16]. To reflect the varia- tion in eGFR values measured more than 3 times through the health examinations, variability independent of the mean (VIM) index was used [17]. It was calculated by the following equa- tion: 100 x standard deviation/meanβ.β was a regression coefficient, which was a natural loga- rithm of the standard deviation over the natural logarithm of the mean. The study participants were classified into the four quartiles (Q) of the VIM, and Q4, the highest quartile, represented the participants with the highest eGFR variability.
Study outcomes
The primary outcome was newly developed MI, stroke, and death. The outcomes were defined with ICD-10 codes (MI; I21 or I22, stroke; I63 or I 64), which were newly issued more than twice in the claims data during the hospital admission or outpatient clinic visits. The death data were obtained from Statistics Korea. All participants were followed up from the initial eGFR measure- ment to the time of the cardiovascular events, death, or until the end of the follow-up period.
Statistical analysis
Continuous variables are presented as medians (interquartile ranges), and categorical variables are presented as numbers (percentages). The incidence rate (IR) was calculated by the number of incident cases divided by the entire follow up duration (person-year). Multivariate Cox regression analysis was used to assess the hazard ratios (HRs) and 95% confidence intervals (CIs) of the study outcomes. A multivariate adjusted Cox proportional hazard model was addi- tionally constructed with adjustment variables including age, sex, BMI, smoking, drinking habits, income status, underlying comorbidities and baseline eGFR.
To minimize the potential impact of the annual change in eGFR values on the variability in eGFR, additional analyses were performed after dividing the patients into 3 groups according to the slope of eGFR value: decline, stable and increase group. In addition, subgroup analyses were performed to assess whether mortality increases with elevated eGFR variability according to the underlying diseases and lifestyle habits.
All analyses were performed using SAS version 9.4 (SAS Institute Inc, USA). A P-value under 0.05 was considered statistically significant.
Results
Baseline characteristics
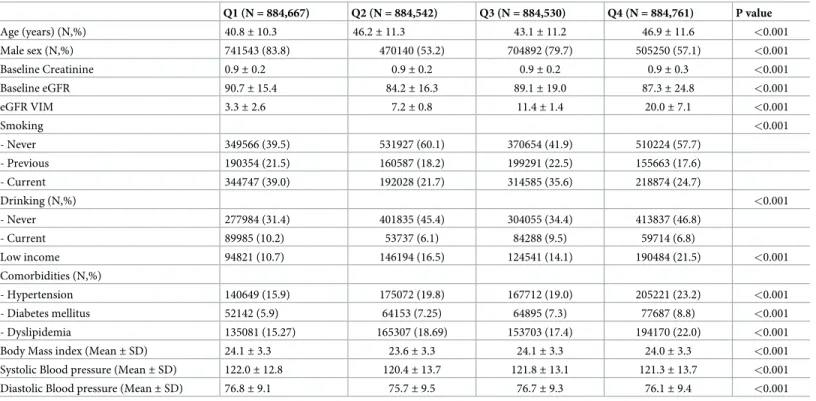
The baseline characteristics of the study participants according to the quartiles of eGFR vari- ability are presented inTable 1. Q4 group participants showed the highest VIM index, which represented the highest variability in eGFR. The participants in the Q4 group were older and more frequently diagnosed with hypertension, diabetes, and dyslipidemia (P < 0.001) than the participants in the low variability quartile groups.
Risk of adverse outcomes according to eGFR variability
A total of 3,538,500 participants satisfied the inclusion criteria for the outcome analyses. Dur- ing the median follow up of 3.27 (3.04–3.56) years, 10,697 myocardial infarction (MI) (0.37%), 10,273 stroke (0.30%), and 13,217 death (0.29%) events were observed among all participants.
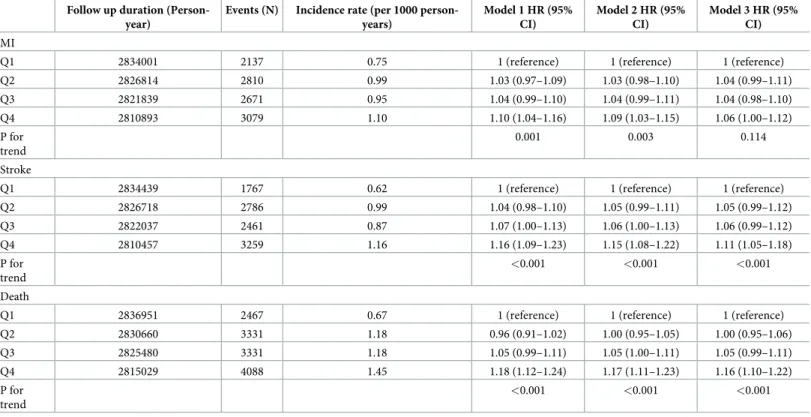
Participants with the highest eGFR variability exhibited overall increased incidence rates and elevated risk of adverse outcomes, compared to those with the lower eGFR variability (Table 2 andFig 2), namely MI (hazard ratio [HR]: 1.10; 95% confidence interval (CI) 1.04–1.16), stroke (HR: 1.16; 95% CI 1.09–1.23), and death (HR: 1.18; 95% CI 1.12–1.24) The results were
consistent after adjusting for potential confounding factors, including age, sex, BMI, drinking, smoking habits, income status, baseline eGFR, and the presence of hypertension, diabetes, and dyslipidemia, except the risk of MI (HR: 1.06; 95% CI 1.00–1.12).
Risk of adverse outcomes according to creatinine variability
Analyses examining the variability in the serum creatinine values and the risk of adverse out- comes were additionally performed. The variability in the multiple serum creatinine measure- ment values was also stratified into quartiles using the VIM index. Participants with the highest creatinine variability exhibited an elevated risk of stroke (HR: 1.07; 95% CI 1.01–1.14) and death (HR: 1.22; 95% CI 1.16–1.29), compared to those with lower creatinine variability. (S1 Table).
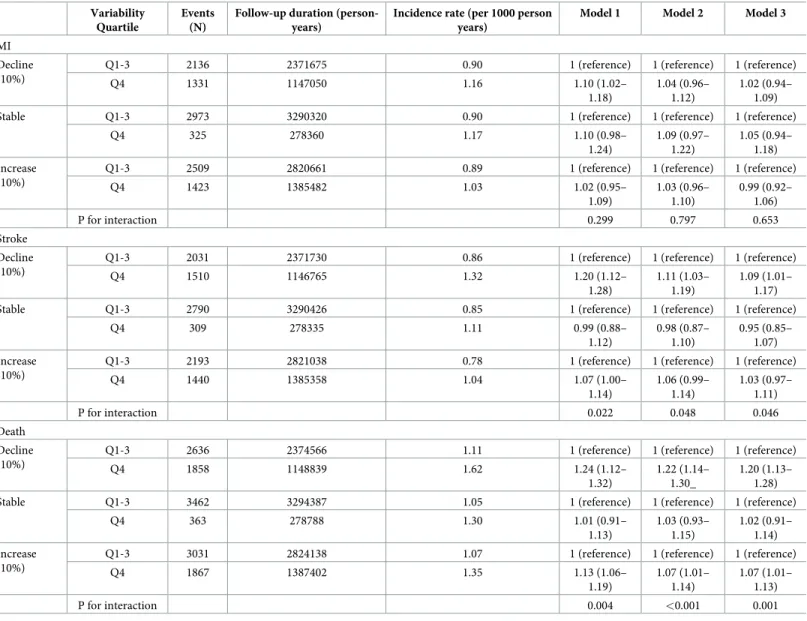
The difference in eGFR variability and the annual change in eGFR To distinguish the independent impact of eGFR variability on the annual change in eGFR, additional analyses were performed after stratifying all study participants according to the eGFR slope into decline, stable, and increase subgroups. The eGFR slope, the percentage of the annual eGFR change, was calculated by the change in absolute eGFR difference over the time interval (total years) between the initial and final eGFR measurements. Within 10%, differ- ences in the slope were grouped in the stable category. Then, the impact of the increased eGFR variability on adverse outcomes was examined, compared to the remaining low eGFR variabil- ity. The highest eGFR variability exhibited an independent association with elevated risks of stroke and death, regardless of the annual decline or increase in eGFR (Table 3). However,
Table 1. Baseline characteristics of the study participants.
Q1 (N = 884,667) Q2 (N = 884,542) Q3 (N = 884,530) Q4 (N = 884,761) P value
Age (years) (N,%) 40.8± 10.3 46.2± 11.3 43.1± 11.2 46.9± 11.6 <0.001
Male sex (N,%) 741543 (83.8) 470140 (53.2) 704892 (79.7) 505250 (57.1) <0.001
Baseline Creatinine 0.9± 0.2 0.9± 0.2 0.9± 0.2 0.9± 0.3 <0.001
Baseline eGFR 90.7± 15.4 84.2± 16.3 89.1± 19.0 87.3± 24.8 <0.001
eGFR VIM 3.3± 2.6 7.2± 0.8 11.4± 1.4 20.0± 7.1 <0.001
Smoking <0.001
- Never 349566 (39.5) 531927 (60.1) 370654 (41.9) 510224 (57.7)
- Previous 190354 (21.5) 160587 (18.2) 199291 (22.5) 155663 (17.6)
- Current 344747 (39.0) 192028 (21.7) 314585 (35.6) 218874 (24.7)
Drinking (N,%) <0.001
- Never 277984 (31.4) 401835 (45.4) 304055 (34.4) 413837 (46.8)
- Current 89985 (10.2) 53737 (6.1) 84288 (9.5) 59714 (6.8)
Low income 94821 (10.7) 146194 (16.5) 124541 (14.1) 190484 (21.5) <0.001
Comorbidities (N,%)
- Hypertension 140649 (15.9) 175072 (19.8) 167712 (19.0) 205221 (23.2) <0.001
- Diabetes mellitus 52142 (5.9) 64153 (7.25) 64895 (7.3) 77687 (8.8) <0.001
- Dyslipidemia 135081 (15.27) 165307 (18.69) 153703 (17.4) 194170 (22.0) <0.001
Body Mass index (Mean± SD) 24.1± 3.3 23.6± 3.3 24.1± 3.3 24.0± 3.3 <0.001
Systolic Blood pressure (Mean± SD) 122.0± 12.8 120.4± 13.7 121.8± 13.1 121.3± 13.7 <0.001
Diastolic Blood pressure (Mean± SD) 76.8± 9.1 75.7± 9.5 76.7± 9.3 76.1± 9.4 <0.001
The data are presented as N (%) or mean± standard deviation.
Low income was defined as a total income, 20thpercentile for the nation.
eGFR = estimated glomerular filtration rate, VIM = variability independent of mean, SD = standard deviation.
https://doi.org/10.1371/journal.pone.0244156.t001
eGFR variability did not show an independent association with the risk of MI. Increased mor- tality with high eGFR variability was similarly observed when the slope difference range was changed to 5% (S2 Table).
Subgroup analysis
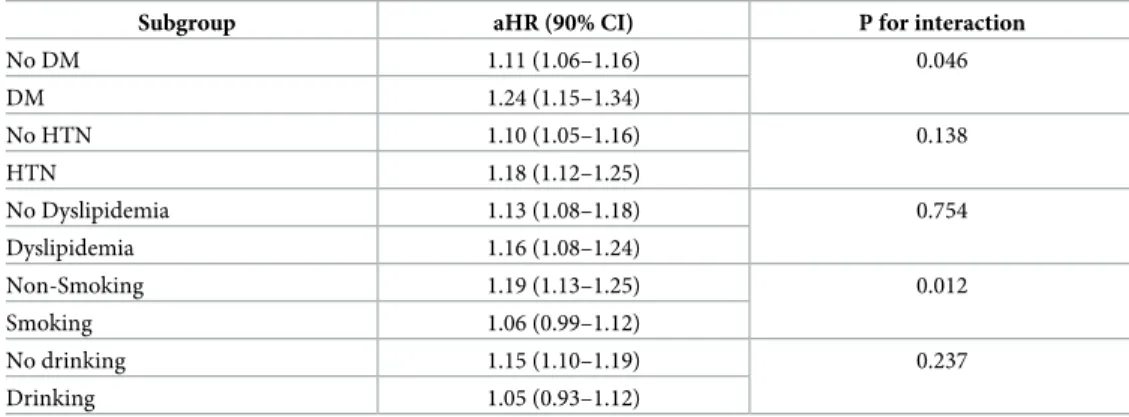
Moreover, subgroup analyses were performed to assess the association of eGFR variability and all-cause death according to the underlying comorbidities and lifestyle habits. An increased
Table 2. Association of eGFR quartile and adverse outcomes.
Follow up duration (Person- year)
Events (N) Incidence rate (per 1000 person- years)
Model 1 HR (95%
CI)
Model 2 HR (95%
CI)
Model 3 HR (95%
CI) MI
Q1 2834001 2137 0.75 1 (reference) 1 (reference) 1 (reference)
Q2 2826814 2810 0.99 1.03 (0.97–1.09) 1.03 (0.98–1.10) 1.04 (0.99–1.11)
Q3 2821839 2671 0.95 1.04 (0.99–1.10) 1.04 (0.99–1.11) 1.04 (0.98–1.10)
Q4 2810893 3079 1.10 1.10 (1.04–1.16) 1.09 (1.03–1.15) 1.06 (1.00–1.12)
P for trend
0.001 0.003 0.114
Stroke
Q1 2834439 1767 0.62 1 (reference) 1 (reference) 1 (reference)
Q2 2826718 2786 0.99 1.04 (0.98–1.10) 1.05 (0.99–1.11) 1.05 (0.99–1.12)
Q3 2822037 2461 0.87 1.07 (1.00–1.13) 1.06 (1.00–1.13) 1.06 (0.99–1.12)
Q4 2810457 3259 1.16 1.16 (1.09–1.23) 1.15 (1.08–1.22) 1.11 (1.05–1.18)
P for trend
<0.001 <0.001 <0.001
Death
Q1 2836951 2467 0.67 1 (reference) 1 (reference) 1 (reference)
Q2 2830660 3331 1.18 0.96 (0.91–1.02) 1.00 (0.95–1.05) 1.00 (0.95–1.06)
Q3 2825480 3331 1.18 1.05 (0.99–1.11) 1.05 (1.00–1.11) 1.05 (0.99–1.11)
Q4 2815029 4088 1.45 1.18 (1.12–1.24) 1.17 (1.11–1.23) 1.16 (1.10–1.22)
P for trend
<0.001 <0.001 <0.001
Model 1: Adjusted for age, and sex.
Model 2: Adjusted for age, sex, smoking, baseline eGFR, underlying diabetes.
Model 3: Adjusted for model 2 plus BMI, drinking, income, underlying hypertension, and dyslipidemia.
eGFR = estimated glomerular filtration rate, HR = hazard ratio, CI = confidence interval, MI = myocardial infarction, Q = quartile.
https://doi.org/10.1371/journal.pone.0244156.t002
Fig 2. Incidence probability of MI, stroke, and death according to GFR variability. Curves indicate the Kaplan- Meier estimates of the risk of MI, stroke and death by the quartiles of the eGFR variability. The X axis indicates time (years), and the Y axis indicates the incidence probability (%) of the outcomes.
https://doi.org/10.1371/journal.pone.0244156.g002
risk of death in the highest quartile of participants was observed in the participants diagnosed with diabetes (HR: 1.24; 95% CI 1.15–1.34) and in the non-smoking participants (HR: 1.19;
95% CI 1.13–1.25) (Table 4) compared to the remaining low variability quartile participants.
Discussion
Using a large-scale nationwide population-based dataset, the present study demonstrated that high eGFR variability is associated with an increased risk of MI, stroke, and all-cause death among the general population with preserved renal function. High eGFR variability indepen- dently increased the risks of stroke and death, regardless of an accompanying annual eGFR
Table 3. Association of the variability quartiles and the outcomes according to the slope of GFR (slope index 10%).
Variability Quartile
Events (N)
Follow-up duration (person- years)
Incidence rate (per 1000 person years)
Model 1 Model 2 Model 3
MI Decline (10%)
Q1-3 2136 2371675 0.90 1 (reference) 1 (reference) 1 (reference)
Q4 1331 1147050 1.16 1.10 (1.02–
1.18)
1.04 (0.96–
1.12)
1.02 (0.94–
1.09)
Stable Q1-3 2973 3290320 0.90 1 (reference) 1 (reference) 1 (reference)
Q4 325 278360 1.17 1.10 (0.98–
1.24)
1.09 (0.97–
1.22)
1.05 (0.94–
1.18) Increase
(10%)
Q1-3 2509 2820661 0.89 1 (reference) 1 (reference) 1 (reference)
Q4 1423 1385482 1.03 1.02 (0.95–
1.09)
1.03 (0.96–
1.10)
0.99 (0.92–
1.06)
P for interaction 0.299 0.797 0.653
Stroke Decline (10%)
Q1-3 2031 2371730 0.86 1 (reference) 1 (reference) 1 (reference)
Q4 1510 1146765 1.32 1.20 (1.12–
1.28)
1.11 (1.03–
1.19)
1.09 (1.01–
1.17)
Stable Q1-3 2790 3290426 0.85 1 (reference) 1 (reference) 1 (reference)
Q4 309 278335 1.11 0.99 (0.88–
1.12)
0.98 (0.87–
1.10)
0.95 (0.85–
1.07) Increase
(10%)
Q1-3 2193 2821038 0.78 1 (reference) 1 (reference) 1 (reference)
Q4 1440 1385358 1.04 1.07 (1.00–
1.14)
1.06 (0.99–
1.14)
1.03 (0.97–
1.11)
P for interaction 0.022 0.048 0.046
Death Decline (10%)
Q1-3 2636 2374566 1.11 1 (reference) 1 (reference) 1 (reference)
Q4 1858 1148839 1.62 1.24 (1.12–
1.32)
1.22 (1.14–
1.30_
1.20 (1.13–
1.28)
Stable Q1-3 3462 3294387 1.05 1 (reference) 1 (reference) 1 (reference)
Q4 363 278788 1.30 1.01 (0.91–
1.13)
1.03 (0.93–
1.15)
1.02 (0.91–
1.14) Increase
(10%)
Q1-3 3031 2824138 1.07 1 (reference) 1 (reference) 1 (reference)
Q4 1867 1387402 1.35 1.13 (1.06–
1.19)
1.07 (1.01–
1.14)
1.07 (1.01–
1.13)
P for interaction 0.004 <0.001 0.001
Model 1: Adjusted for age, and sex.
Model 2: Adjusted for age, sex, smoking, baseline eGFR, underlying diabetes.
Model 3: Adjusted for model 2 plus BMI, drinking, income, underlying hypertension, and dyslipidemia.
eGFR = estimated glomerular filtration rate, MI = myocardial infarction, Q = quartile.
https://doi.org/10.1371/journal.pone.0244156.t003
change. A notable association was observed, especially with the eGFR decline. We suggest that the variability index, which reflects the variation in the multiple eGFR measurement values, may be applied as an additional predictor to estimate the risks of cardiovascular
complications.
A single measured low eGFR independently predicted cardiovascular disease or mortality in CKD patients [2,18]. In subjects with reduced kidney function, an annual decline or increase in eGFR slope, which reflected the dynamic nature of kidney function over time, bet- ter predicted cardiovascular events and death over a single eGFR measurement [8,9,19,20].
However, as eGFR may vary widely even with a slight change in serum creatinine in subjects with preserved kidney function, the clinical significance of eGFR variation needs to be exam- ined. Thus, the present study focused on testing the predictive value of eGFR fluctuation within normal ranges on clinical outcomes among the general population.
Previous reports examined various variability indices and proposed that dynamic variation in metabolic parameters could predict cardiovascular complications in general populations [12]. Variability in cholesterol levels exhibited an association with an increased risk of cardio- vascular events and death, indicating that it is mediated by complicated mechanisms related to systemic endothelial injury [14]. High variability in blood pressure was an independent predic- tor of the increased risk of cardiovascular events or mortality [12,13,21], suggesting that blood pressure variability was associated with atherosclerosis and led to endothelial dysfunction [22,23]. Previous intra-visit blood pressure analysis pointed out that the variation coefficient, which was a frequently used index to express the variability, cannot completely exclude the effect of the average values, and introduced VIM as an alternative index [17]. VIM was calcu- lated by the proportion of the standard deviation over the exponent of the regression coeffi- cient of the mean. The regression coefficient can be obtained from the fitting curves, using the nonlinear regression analysis of the SAS package [17,24]. The application of VIM was
expanded to express the variability in numerous metabolic parameters and successfully pre- dicted clinical outcomes [12,14]. Along with the previously assessed indicators, our findings may provide additional evidence that variability in eGFR calculated with the VIM index can be another practical predictor for assessing cardiovascular outcomes.
We proposed that a higher risk of cardiovascular and cerebrovascular events and all- cause death was observed in the subjects with higher variability in eGFR. In this regard, the highest eGFR variability group was older, had lower income, and more frequently had
Table 4. Risk of all-cause death of Q4 participants in subgroups.
Subgroup aHR (90% CI) P for interaction
No DM 1.11 (1.06–1.16) 0.046
DM 1.24 (1.15–1.34)
No HTN 1.10 (1.05–1.16) 0.138
HTN 1.18 (1.12–1.25)
No Dyslipidemia 1.13 (1.08–1.18) 0.754
Dyslipidemia 1.16 (1.08–1.24)
Non-Smoking 1.19 (1.13–1.25) 0.012
Smoking 1.06 (0.99–1.12)
No drinking 1.15 (1.10–1.19) 0.237
Drinking 1.05 (0.93–1.12)
aHR = adjusted hazard ratio, CI = confidence interval.
Reference: Q1-3 of eGFR variability.
https://doi.org/10.1371/journal.pone.0244156.t004
comorbidities than the remaining low quartile groups. Relatively lower socioeconomic sta- tus may incur insufficient intake of balanced nutrition and vulnerable medical services, consequently resulting in an increased risk of clinical complications and an alarming mor- tality rate [25,26]. It can be assumed that individuals susceptible to external factors, includ- ing poorly nourished or unbalanced body fluid status, will present unfavorable prognosis.
The eGFR variability may be a useful indicator that could reflect the above complex compo- nents and contribute to the prediction of adverse clinical outcomes. Further experiments verifying the exact mechanism of eGFR fluctuation on clinical outcomes are necessary to support the present findings.
Regardless of the longitudinal eGFR change, the high variability in eGFR independently increased the risks of stroke and death. The association was more prominent in those with a downward annual change in eGFR. High variability in serum creatinine also increased the risk of stroke and death. The present finding suggests that the general population exhibiting high variation in renal function needs to be carefully monitored, to reduce the risk of stroke and all- cause mortality.
The present study included every eGFR value of the study subjects greater than 60 mL/min/
1.73 m2throughout the study period. Hence, it enabled us to test the impact of multiple eGFR measurement valuesin subjects with relatively normal renal function. Therefore, our results may assist clinicians in applying eGFR variability in predicting cardiovascular complications among the general population with preserved kidney function and to distinguish subjects who require early medical attention.
The present study has several strengths. To the best of our knowledge, this is the first study to state the impact of eGFR variability on cardiovascular outcomes and propose that it could be used as a useful parameter to predict complications. Moreover, the study used a large-scale nationwide dataset that contained accurately collected demographic informa- tion and laboratory results. However, there are some limitations to be considered when interpreting the results of the study. As it was a retrospective study, it was hard to demon- strate the causality of eGFR variability. Additionally, those who missed the annual or bian- nual health examination were not included in the study, and potential selection bias might have remained. In addition, as the death data did not contain the information of the main cause of death, it was hard to discriminate the MACE related death from the all-cause death. Further studies are essential to analyze the association of eGFR variability and the risk of MACE related death. Moreover, as the majority of the study participants underwent creatinine measurement when the IDMS-traceable method was not widely validated, the MDRD equation was used to calculate the eGFR value. The bias of the MDRD equation might have led to the increase of false-positive results of eGFR in those with measured GFR>60 mL/min/1.73 m2, compared to the eGFR estimated with the CKD-EPI (Chronic Kidney Disease Epidemiology Collaboration) equation [27]. Therefore, participants with falsely low estimated GFR, might left the potential selection bias. Finally, the majority of participants in the NHIS dataset were of Korean ethnicity. Thus, additional studies need to be performed with various ethnicities to demonstrate whether the variability index is gen- erally applicable. Moreover, further prospective trials are warranted to overcome the above limitations.
Conclusion
In conclusion, high variability in eGFR was associated with an elevated risk of adverse clinical complications. Monitoring eGFR variability may provide additional prognostic benefits among the general population with normal kidney function.
Supporting information
S1 Table. Association of creatinine variability quartile and the adverse outcomes.
(DOCX)
S2 Table. Association of the variability quartiles and the outcomes according to the slope of eGFR (slope index 5%).
(DOCX)
Acknowledgments
The study obtained the NHIS dataset after the approval of a designated organization (NHIS- 2018-1-146).
Author Contributions
Conceptualization: Soojin Lee, Kyungdo Han, Dong Ki Kim.
Data curation: Soojin Lee, Sehoon Park, Yaerim Kim, Yeonhee Lee, Min Woo Kang, Semin Cho, Kyungdo Han.
Formal analysis: Sehoon Park, Kyungdo Han.
Investigation: Soojin Lee, Dong Ki Kim.
Methodology: Sehoon Park, Yaerim Kim, Yeonhee Lee, Min Woo Kang, Semin Cho.
Project administration: Dong Ki Kim.
Resources: Yong Chul Kim, Seung Seok Han, Hajeong Lee, Jung Pyo Lee, Kwon Wook Joo, Chun Soo Lim, Yon Su Kim.
Supervision: Yong Chul Kim, Seung Seok Han, Hajeong Lee, Jung Pyo Lee, Kwon Wook Joo, Chun Soo Lim, Yon Su Kim.
Visualization: Kyungdo Han.
Writing – original draft: Soojin Lee, Dong Ki Kim.
Writing – review & editing: Soojin Lee, Dong Ki Kim.
References
1. Kidney Disease: Improving Global Outcomes (KDIGO) CKD Work Group. KDIGO clinical practice guideline for the evaluation and management of chronic kidney disease. Kidney Int Suppl 2013;31–150.
2. Matsushita K, Coresh J, Sang Y et al. Estimated glomerular filtration rate and albuminuria for prediction of cardiovascular outcomes: a collaborative meta-analysis of individual participant data. Lancet Diabe- tes Endocrinol 2015; 3(7):514–525.https://doi.org/10.1016/S2213-8587(15)00040-6PMID:26028594 3. Astor BC, Matsushita K, Gansevoort RT et al. Lower estimated glomerular filtration rate and higher albu-
minuria are associated with mortality and end-stage renal disease. A collaborative meta-analysis of kid- ney disease population cohorts. Kidney Int 2011; 79(12):1331–1340.https://doi.org/10.1038/ki.2010.
550PMID:21289598
4. Van der Velde M, Matsushita K, Coresh J et al. Lower estimated glomerular filtration rate and higher albuminuria are associated with all-cause and cardiovascular mortality. A collaborative meta-analysis of high-risk population cohorts. Kidney Int 2011; 79(12):1341–1352.https://doi.org/10.1038/ki.2010.536 PMID:21307840
5. Chronic Kidney Disease Prognosis C, Matsushita K, van der Velde M, Astor BC et al. Association of estimated glomerular filtration rate and albuminuria with all-cause and cardiovascular mortality in gen- eral population cohorts: a collaborative meta-analysis. Lancet 2010; 375(9731):2073–2081.https://doi.
org/10.1016/S0140-6736(10)60674-5PMID:20483451
6. Shlipak MG, Katz R, Kestenbaum B et al. Rapid decline of kidney function increases cardiovascular risk in the elderly. J Am Soc Nephrol 2009; 20(12):2625–2630.https://doi.org/10.1681/ASN.2009050546 PMID:19892934
7. Perkins RM, Bucaloiu ID, Kirchner HL, Ashouian N, Hartle JE, Yahya T. GFR decline and mortality risk among patients with chronic kidney disease. Clin J Am Soc Nephrol 2011; 6(8):1879–1886.https://doi.
org/10.2215/CJN.00470111PMID:21685022
8. Coresh J, Turin TC, Matsushita K et al. Decline in estimated glomerular filtration rate and subsequent risk of end-stage renal disease and mortality. JAMA 2014; 311(24):2518–2531.https://doi.org/10.
1001/jama.2014.6634PMID:24892770
9. Turin TC, Coresh J, Tonelli M et al. Change in the estimated glomerular filtration rate over time and risk of all-cause mortality. Kidney Int 2013; 83(4):684–691.https://doi.org/10.1038/ki.2012.443PMID:
23344477
10. Yu JH, Han K, Park S et al. Effects of long-term glycemic variability on incident cardiovascular disease and mortality in subjects without diabetes: A nationwide population-based study. Medicine (Baltimore) 2019; 98(29):e16317.https://doi.org/10.1097/MD.0000000000016317PMID:31335679
11. Nam GE, Cho KH, Han K et al. Impact of body mass index and body weight variabilities on mortality: a nationwide cohort study. Int J Obes (Lond) 2019; 43(2):412–423.https://doi.org/10.1038/s41366-018- 0079-0PMID:29777238
12. Kim MK, Han K, Park YM et al. Associations of Variability in Blood Pressure, Glucose and Cholesterol Concentrations, and Body Mass Index With Mortality and Cardiovascular Outcomes in the General Population. Circulation 2018; 138(23):2627–2637.https://doi.org/10.1161/CIRCULATIONAHA.118.
034978PMID:30571256
13. Muntner P, Shimbo D, Tonelli M, Reynolds K, Arnett DK, Oparil S. The Relationship Between Visit-to- Visit Variability in Systolic Blood Pressure and All-Cause Mortality in the General Population Findings From NHANES III, 1988 to 1994. Hypertension 2011; 57(2):160–166.https://doi.org/10.1161/
HYPERTENSIONAHA.110.162255PMID:21200000
14. Kim MK, Han K, Kim HS et al. Cholesterol variability and the risk of mortality, myocardial infarction, and stroke: a nationwide population-based study. Eur Heart J 2017; 38(48):3560–3566.https://doi.org/10.
1093/eurheartj/ehx585PMID:29069458
15. Lee J, Lee JS, Park SH, Shin SA, Kim K. Cohort Profile: The National Health Insurance Service- National Sample Cohort (NHIS-NSC), South Korea. Int J Epidemiol 2017; 46(2):e15.https://doi.org/10.
1093/ije/dyv319PMID:26822938
16. Levey AS, Bosch JP, Lewis JB, Greene T, Rogers N, Roth D. A more accurate method to estimate glo- merular filtration rate from serum creatinine: a new prediction equation. Modification of Diet in Renal Disease Study Group. Ann Intern Med 1999; 130(6):461–470.https://doi.org/10.7326/0003-4819-130- 6-199903160-00002PMID:10075613
17. Rothwell PM, Howard SC, Dolan E et al. Prognostic significance of visit-to-visit variability, maximum systolic blood pressure, and episodic hypertension. Lancet 2010; 375(9718):895–905.https://doi.org/
10.1016/S0140-6736(10)60308-XPMID:20226988
18. Muntner P, He J, Hamm L, Loria C, Whelton PK. Renal insufficiency and subsequent death resulting from cardiovascular disease in the United States. J Am Soc Nephrol 2002; 13(3):745–753. PMID:
11856780
19. Matsushita K, Selvin E, Bash LD, Franceschini N, Astor BC, Coresh J. Change in estimated GFR asso- ciates with coronary heart disease and mortality. J Am Soc Nephrol 2009; 20(12):2617–2624.https://
doi.org/10.1681/ASN.2009010025PMID:19892932
20. Sohel BM, Rumana N, Ohsawa M, Turin TC, Kelly MA, Al Mamun M. Renal function trajectory over time and adverse clinical outcomes. Clin Exp Nephrol 2016; 20(3):379–393.https://doi.org/10.1007/
s10157-015-1213-0PMID:26728745
21. Parati G, Ochoa JE, Salvi P, Lombardi C, Bilo G. Prognostic value of blood pressure variability and aver- age blood pressure levels in patients with hypertension and diabetes. Diabetes Care 2013; 36 Suppl 2:
S312–324.https://doi.org/10.2337/dcS13-2043PMID:23882065
22. Nagai M, Hoshide S, Ishikawa J, Shimada K, Kario K. Visit-to-visit blood pressure variations: New inde- pendent determinants for carotid artery measures in the elderly at high risk of cardiovascular disease. J Am Soc Hypertens 2011; 5(3):184–192.https://doi.org/10.1016/j.jash.2011.03.001PMID:21531344 23. Diaz KM, Veerabhadrappa P, Kashem MA et al. Relationship of visit-to-visit and ambulatory blood pres-
sure variability to vascular function in African Americans. Hypertens Res 2012; 35(1):55–61.https://doi.
org/10.1038/hr.2011.135PMID:21814215
24. Asayama K, Kikuya M, Schutte R et al. Home Blood Pressure Variability as Cardiovascular Risk Factor in the Population of Ohasama. Hypertension 2013; 61(1):61–9.https://doi.org/10.1161/
HYPERTENSIONAHA.111.00138PMID:23172933
25. Vart P, Gansevoort RT, Crews DC, Reijneveld SA, Bultmann U. Mediators of the Association Between Low Socioeconomic Status and Chronic Kidney Disease in the United States. Am J Epidemiol 2015;
181(6):385–396.https://doi.org/10.1093/aje/kwu316PMID:25731886
26. Zeng XX, Liu J, Tao SB, Hong HG, Li Y, Fu P. Associations between socioeconomic status and chronic kidney disease: a meta-analysis. J Epidemiol Commun H 2018; 72(4):270–279.https://doi.org/10.
1136/jech-2017-209815PMID:29437863
27. Levey AS, Stevens LA, Schmid CH et al. A new equation to estimate glomerular filtration rate. Ann Intern Med 2009; 150(9):604–612.https://doi.org/10.7326/0003-4819-150-9-200905050-00006PMID:
19414839