A Study on the Concentration and Deconcentration Development for Cruise Ports in Mediterranean Sea
Siwei Liu1, Gi-Tae Yeo2*
1Doctoral Degree Student, Graduate School of Logistics, Incheon National University,
2Professor, Graduate School of Logistics, Incheon National University
지중해 크루즈 항만의 집중화 및 분산화에 관한 연구
Siwei Liu1, 여기태2*
1인천대학교 동북아물류대학원 박사과정, 2인천대학교 동북아물류대학원 교수
Abstract The aim of this research is to analyze the concentration and deconcentration development of cruise ports in the Mediterranean area by utilizing the concentration ratio (CR), the Herfindahl–
Hirschman Index (HHI), the Gini coefficient, and shift share analysis (SSA). The results of analysis indicated a concentration trend in the West Mediterranean. The cruise ports located in Venice, Piraeus, Naples and Livrno in Adriatic and East Med region lost cruise passengers, while the those in West Mediterranean gained the passengers and showed the trend of concentration. This paper providing the shifting passengers among cruise ports that indicates the competitiveness of cruise ports for industrial stake holders to better understand the cruise ports such as tourist boards, ship agents, and port agents.
Key Words : Cruise ports, Deconcentration, The Mediterranean Sea, Passenger shifting, Concentration ratio (CR), Herfindahl–Hirschman Index (HHI)
요 약 본 연구는 지중해 크루즈 항만의 집중화 및 분산화를 분석하는 것을 연구의 목적으로 한다. 연구의 방법은 집중도 분석, 허핀달-허쉬만 분석, 지니계수 분석, 전이할당 분석을 사용하였다. 연구의 결과, 서지중해 지역 크루즈 항만의 경우, 관광객을 많이 유치하면서 집중화 경향이 나타나는 것으로 확인되었다. 반면 동지중해 지역 및 아드리아 해의 베니스, 피레우스, 나폴리, 리보르노 지역의 경우 크루즈 승객을 타 항만에 잃는 모습을 보이고 있다. 본 연구결과 는 크루즈의 경쟁력이라고 할 수 있는 항만간 승객의 전이결과를 제시하였다. 본 연구결과는 크루즈 항만의 이해관계자 인 지역관광청, 선사대리점, 항만 대리점 등에 시사점을 제공한다.
주제어 : 크루즈 항만, 분산화, 지중해, 승객 전이, 집중도 분석, 허핀달-허쉬만 분석
This research was supported by the 4th Educational Training Program for the Shipping, Port and Logistics from the Ministry of Oceans and Fisheries.
*Corresponding Author : Gi-Tae Yeo([email protected])
Received April 22, 2020 Revised June 4, 2020
Accepted July 20, 2020 Published July 28, 2020
1. INTRODUCTION
Despite of the unpredictable global economic cycle and political situation, the international cruise market has been growing during the last two decades, and has led the growth of cruise passengers worldwide (Papathanassis, 2017) [1].
The direct global spending of cruise industry was 57.9 billion US dollar in 2016, and indirect and induced contributions were 68 billion US dollar in 2016. The direct spending consisted of the spending of cruise line (69%), passengers (28%), and crew (2.4%) (CLIA, 2017) [2].
The Mediterranean Sea took place as the world’s second biggest area in terms of cruise fleet deployment which was 15.8% of the world share in 2017. However, due to their rich historical heritage; warm and mild weather; and interesting places to visit, the increasing rate of the number of passengers is marked at 8% which is an extraordinary result compared to other regions including the first attraction area like the Caribbean Sea shown 4% growth (Stojanovic et al., 2014) [3].
Region of the Mediterranean is divided into four distinctive areas such as West Med, Adriatic, East Med, and the Black Sea. 25.9 million cruise passengers visited using 12,139 cruise calls in 2017. 20 countries and three continents such as Africa, Asia, and Europe are involved in the Mediterranean Region,
A number of passengers are increased from 21.9 million in 2008 to 25.9 million in 2017. Very interestingly, the number of cruise calls of 2017 was 21.5% lower than that of 2008 due to the enlargement of cruise ships’ size. In contrast, the average number of passengers per call had been increased from 1,416 passengers in 2008 to 2,132 passengers in 2017. Due to reduced port calls, the cruise ports have experienced the fluctuation of cruise vessel traffic. Depend on their competitiveness, some cruise ports have gained traffic, and some have reduced or retained traffic
in the Mediterranean.
According to the cruise industry news (2017) [4], 329 cruise vessels were deployed in 2017 and 363 ships are expected to sail in 2020. Deploying larger size of cruise vessel has an impact on the selection of more attractive cruise ports. Among 73 Mediterranean cruise ports, 36 ports have hosted more than 120,000 passengers, and 37 ports are recorded less than this number.
Passengers hosted by these 37 ports decreased from 2,722,926 persons in 2013 to 875,710 persons in 2017. However, the other group’s variation was quite steady and increased from 24,988,924 persons in 2013 to 25,039,863 persons in 2017. The cruise companies are focusing on the larger ports and these ports gain more attractions (Esteve-Perez & Garcia-Sanchez, 2018) [5].
In addition, the passengers visited in West Med increased from 6.65% from 18,177,259 persons by 2013 to 19,386,220 persons by 2017. However, Adriatic and East Med regions had experienced decreasing numbers as 14% and 24.37%, respectively.
The cruise ports on West Med are popular compared to other regions in the Mediterranean.
This means that concentration is occurring in this region. Competition among cruise ports has brought about deconcentration and passenger shifting (Soriani et al., 2009) [6]. However, scant research was conducted on this research area in terms of cruise ports. In addition, the longitudinal analysis of concentration and deconcentration developments for cruise ports in the Mediterranean Sea still remains as a research gap.
In this respect, the aim of this research is to analyze the concentration and deconcentration of cruise ports in the Mediterranean area by utilizing the concentration ratio (CR), the Herfindahl–Hirschman Index (HHI), the Gini coefficient, and shift share analysis (SSA).
2. Literature review
Cruise industry is very important and from this
point, various studies have analyzed cruise ports and industry itself (Jones, 2011) [7]. Compared to worldwide research trend of container shipping, research focused on the cruise industry in the Mediterranean Sea region is very limited.
Tsiotas et al. (2018) [8] suggested operational and geographical dynamics of cruise ports in the Mediterranean Sea using a complex network analysis. The results provide insights to cruise shipping companies and ports on how they can develop cruise network. However, this research does not reflect the important variables such as carrying capacity, the number of passengers, and size of ships in their analysis.
The research regarding perceptions about the experience from the cruise tourism has been suggested (Brida et al. 2014) [9], which examined the residents’ perceptions for Sicily and Sardinia in the Mediterranean Sea. They found that the two groups’ respondents gave positive answers about social and economic impacts, while they expressed negative effect of environmental impact of cruise ships in ports.
Chiappa et al. (2018) [10] also obtained residents’ perceptions of the cruise industry impacts on their city of Valencia. The results revealed that most residents doubt the big positive impact on various aspects of homeport.
This result suggested contradictory insights, and cruise activity on the community-based tends to be highly site-specific. This research has limitations such as using one specific cruise port (the city of Valencia) for it convenience.
The cruise ship passengers’ motivation, satisfaction, and willingness to revisit port of Heraklion in Greece were analyzed by Andriotis and Agiomirgianakis (2010) [11]. The respondents are highly attracted to visit cultural destinations whereas they focused more on enjoying the sun and sea of the Caribbean. Among the attributes of passengers’ satisfaction, offered product and service were the most important. This study also has limitations that it has targeted one city and
a very limited sample size.
Another cruise passengers’ perception research was suggested by Blas and Carvajal-Trujillo (2014) [12]. They investigated the satisfaction and future intentions to revisit the port of Valencia in the Mediterranean using the Partial Least Squares technique. The results showed that the image gives a direct influence on satisfaction and in turn, the satisfaction gives influence on the revisit intention. However, this study was analyzed at a single point in time, therefore a longitudinal analysis is needed.
Recently, research regarding negative effect of emission from cruise ships has been suggested.
Murena et al. (2018) [13] analyzed pollutants emitted by cruise ships at the port of Naples.
They stated that the negative impact of cruise ship on the air pollution is limited but not negligible. In addition, Wang et al. (2019) [14]
investigated the environmental efficiency of the cruise companies using DEA technics such as super slack-based measure model and the Malmquist productivity index from the 2010 to 2015. This research, however, only considered three cruise shipping companies and very limited variables.
In respect to cruise price, Niavis and Tsiotas (2018) [15] examined the composition of cruise product price in the Mediterranean Sea. They divided the price into tourism and transport driven factors. Using the two cruise shipping companies’ data, they calculated the two factors’
contributions on the cruise price. They argued that contribution of tourism factor outweighs the transport factor. This study also used the specific year data; therefore, longitudinal data and analysis are needed.
Cusano et al. (2017) [16] suggested the concentration of cruise shipping companies that operate in the Mediterranean Sea using HHI (Herfindahl-Hirschman Index). Karlis and Polemis (2018) [17] analyzes the cruise homeport competition in the Mediterranean Sea using the Shift-Share technique. However, they are only
targeting West and East Mediterranean, not including Adriatic and the Black sea.
Researches related to cruise ports in the Mediterranean Sea have been carried out by many scholars. However, they have limitations of non-reflecting the important variables such as carrying capacity, the number of passengers, and size of ships (Tsiotas et al., 2018)[8]; only using one specific cruise port (the city of Valencia) and convenient data and references (Chiappa et al., 2018)[10]; using one targeted city and very limited sample size (Andriotis & Agiomirgianakis, 2010)[11]; analyzing at a single point in time (Blas
& Carvajal-Trujillo, 2014)[12]; only considering three cruise shipping companies and using very limited variables (Niavis & Tsiotas, 2018)[15].
Researchers have presented new research on the cruise ports in recent years mostly examining perceptions about and factors influencing the attraction of the cruise port (Notteboom, 1997)[18]. In order to shed light on the cruise ports in the Mediterranean Sea, it is essential to study concentration and deconcentration developments of cruise ports in this region. In addition, a longitudinal analysis with time series data is a prerequisite to find out the changes of cruise ports in this region.
3. Methodology
3.1 Overview of Cruise ports in Mediterranean Sea
The Mediterranean Sea consists of West Med, Adriatic, East Med, and the Black Sea. Among these, West Med had handled the largest number of 19,721,802 passengers in 2017 followed by 4,447,033 in Adriatic, 1,740,289 in East Med, and 6,449 in the Black Sea. Each region’s share of passengers has shown variation. For example, West Med’s share ratio was changed from 68.3%
in 2013 to 76.1% in 2017. West Med’s region is continuously gaining passengers. However, Adriatic region’s share decreased from 18.3% in 2013 to 17.1% in 2017. The Black Sea region was also losing the passengers from 13.1% in 2013 to 0.02% in 2017.
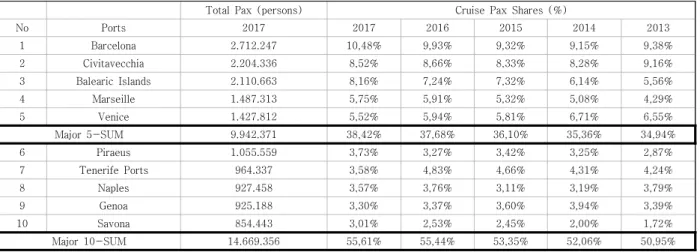
Barcelona, Spain obtained top position among cruise ports in the Mediterranean Sea in 2017 followed by Civitavecchia, Italy, and Balearic Islands. The top 10 cruise ports and their number of passenger (PAX) handling are suggested in Table 1 below.
The 10 major cruise ports in the Mediterranean obtained 14.7 million passengers among the total of 25.9 million passenger. In terms of passenger movements, Italy recorded in the top position marked 36.8% followed by Spain (27.3%), France
Total Pax (persons) Cruise Pax Shares (%)
No Ports 2017 2017 2016 2015 2014 2013
1 Barcelona 2.712.247 10,48% 9,93% 9,32% 9,15% 9,38%
2 Civitavecchia 2.204.336 8,52% 8,66% 8,33% 8,28% 9,16%
3 Balearic Islands 2.110.663 8,16% 7,24% 7,32% 6,14% 5,56%
4 Marseille 1.487.313 5,75% 5,91% 5,32% 5,08% 4,29%
5 Venice 1.427.812 5,52% 5,94% 5,81% 6,71% 6,55%
Major 5-SUM 9.942.371 38,42% 37,68% 36,10% 35,36% 34,94%
6 Piraeus 1.055.559 3,73% 3,27% 3,42% 3,25% 2,87%
7 Tenerife Ports 964.337 3,58% 4,83% 4,66% 4,31% 4,24%
8 Naples 927.458 3,57% 3,76% 3,11% 3,19% 3,79%
9 Genoa 925.188 3,30% 3,37% 3,60% 3,94% 3,39%
10 Savona 854.443 3,01% 2,53% 2,45% 2,00% 1,72%
Major 10-SUM 14.669.356 55,61% 55,44% 53,35% 52,06% 50,95%
Source: CLIA (2017), The contribution of the international cruise industry to the global economy in 2016
Table 1. Top 10 cruise ports in the Mediterranean
(9.7%), Greece (8.0%), and Portugal (4.7%).
3.2 Data used
According to the analysis of CLIA (2017) [2], 73 cruise ports are located in the Mediterranean Sea. Among these, the share ratio of 20 top cruise ports in terms of passenger movements in 2017 is 55.61%. The top port is Barcelona—
hosting 2.7 million—and the second-best port is Civitavecchia which recorded 2.2 million cruise passengers. Civitavecchia had shown decrease of cruise passengers of 5.7%. In this research, to figure out the major picture of this region, top ten cruise ports’ cruise passenger data will be used in the analysis. In addition, to obtain the yearly changes of cruise industry, the longitudinal analysis contained 10 years data from year 2009 to 2018 will be adopted.
To analyze the concentration and deconcentration of cruise ports, Cusano et al.
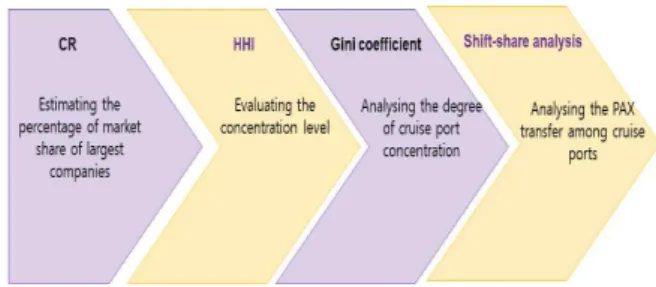
(2017) [16] used HHI (Herfindahl-Hirschman Index). In addition, for analyzing the number of passenger transfer among cruise ports, Karlis and Polemis (2018) [17] introduce the Shift-Share technique. In this research, there are four different methods working together in order to conduct more precise and reliable results. The following are the mentioned methodology which consisted of 4 methods such as concentration ratio (CR), the Herfindahl–Hirschman Index (HHI), the Gini coefficient, and shift share analysis (SSA).
Fig. 1. Flow of empirical analysis
3.3 CR (Concentration ratio)
The measure termed CR(k) would estimate the percentage of market share of largest companies in an industry. Depending on the number of companies, the level of concentration ratio is calculated as:
∑ (1)
In which is the percentage in market share of ith largest cruise port (i=1, 2…k). The concentration ratio is described CR(1) as CR(3) and , corresponding to the concentration level of the 1st and 3rd firm. According to Sys (2009) [19], the market is considered oligopoly if the value of CR(1) as CR(3) achieve 50% and 70%, respectively.
3.4 The Herfindahl-Hirschman Index (HHI) The Herfindahl-Hirschman Index (HHI) is a favored measure to evaluate the concentration level which equals the sum of squared market share of firms. Not only addressing to top companies as the aforementioned indicators, but the HHI also covers the indices of contributing factors as the following formula:
∑
and
〈〈 (2)
with H as the concentration index for the system and n as the number of cruise ports in the system. And PAX means the number of passengers. The value of the HHI describes the concentration level of cruise port system in a certain area. The higher concentration ratio is revealed if the HHI is closer to 1. In contrast, there is a deconcentration trend with the port system if the HHI reaches into 1/n.
3.5 The Gini coefficient
Another indicator to access with the degree of port concentration is the Gini coefficient depicted to address the trend of concentration in a period. The Gini coefficient is commonly applied to measure the percent departure of an ideally uniform distribution. The Lorenz curve is used to graphically illustrate the level of concentration. If sizes of all cruise ports are the same, the Gini coefficient equals zero and the diagonal of equal distribution illustrates a Lorenz Curve. If one port estimates the whole PAX as known as full concentration, the Gini coefficient equals unity is identified by the space below the diagonal of equal distribution. Beneath is the calculation of Gini coefficient:
∑
∑
(3)
n is the number of cruise ports while is the
cumulative market share regarding the PAX of cruise ports from the lowest to the highest. The Gini coefficient index is 0 if there is no concentration and 1 for the whole trend of concentration. The Lorenz curve varies the cumulative size of n largest firms in an industry with the range of n from 1 to n.
3.6 Shift-share analysis
Shift-share analysis is not a measure to access into the concentration level but a prevailing tool to reflect the PAX transfer among cruise ports and a consistent factor supporting the concentration pattern assessment. The expected growth of the PAX in a cruise port is specified in
‘share’ effect which indicates the maintenance of cruise port in market share, resulting in its same development as the port range. The total shift indicates the total PAX a port has gained or been left to other competitors in the same range, with a reference as the expected PAX (share effect).
The ‘shift’ effect aims to evaluate the cruise ports’ competitive position because of
eliminating the development of the whole sector (i.e. only net volume of PAX shifts between cruise ports remains).
∑∑
(4) ∑
∑
(5)
(6)
In which, SHAREi is the share effect in PAX of cruise port i for the period t1-t0, SHIFTi is the shift effect in PAX of cruise port i for the period t1-t0, ABSGRi is the absolute growth in PAX of cruise port i for the period t1-t0, PAXi is PAX of cruise port i and n is the number of cruise ports.
4. Empirical analysis
This research selected the top ten cruise ports in the Mediterranean region in terms of the number of cruise passengers during the periods between 2009 and 2018 using the four methods.
These four methods include Concentration ratio, Herfindahl-Hirschman Index, Shift-share analysis and GINI index. These methods are employed to analyze the concentration trends of the ten selected ports. From this perspective, the true status of selected ports is investigated and researched, in order to provide constructive references for the future development of the region.
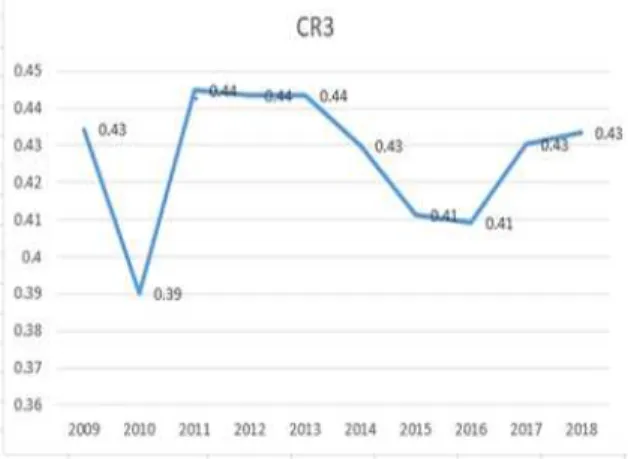
Starting with a focused discussion on the results of the concentration ratio analysis of the selected ports, the chart produced by the analysis results suggests that the selected ports have obtained obvious changes in two periods during the targeted years. These are the two periods of 2010 and 2015-2016, and the year of 2010 is particularly noteworthy. Figure 2 illustrates the CR3 index of the selected ports in 2010 was 0.39, while the fluctuation varied slightly between the
two values of 0.43-0.44 in 2009 and 2011-2014.
Till the year of 2015, the value decreased to 0.41 and stayed at 0.41 throughout 2016, and then recovered to 0.43 in 2017. This movement constitutes evidence of a concentration trend in the area. Reviewing the entire CR data, only the value in 2010 declined to lower than 0.40, while the values in other years were all above 0.40. The reason why the value in 2010 fell to below 0.40 might be the reduction in passenger carrying capacity of some ports in this area.
Fig. 2. CR3 for cruise ports in Mediterranean
Fig. 3. HHI for cruise ports in Mediterranean
Judging from the outcomes of the Herfindahl-Hirschman Index, the analysis values of the selected ports during this period also indicated a relatively considerable change, specifically from 2017 to 2018. Figure 3 shows
that the values from 2009 to 2016 were varied relatively slightly from 0.113 to 0.116. During the period from 2017 to 2018, the values were 0.124 and 0.126, which revealed an observable increase compared with the previous values from 2009-2016. This indicates that the region's concentration trend is starting to appear.
Regarding the analysis results of the Gini coefficient, Figure 4 presents a trend chart similar to the result of the Herfindahl-Hirschman index. The Gini coefficient from 2009 to 2018 fluctuated between 0.204 and 0.285. The values of the Gini coefficient from 2009 to 2016 fluctuated between 0.204-0.224, and this period witnessed a flat movement compared with the values in 2017 and 2018. Meanwhile, the values from 2017 to 2018 increased slightly, respectively staying at 0.276 in 2017 and 0.285 in 2018.
Obviously, this result exposes a trend of concentration. In addition, this situation is similar to the results of the previous analysis of the HHI index.
Fig. 4. GINI coefficient for cruise ports in Mediterranean
Additionally, Figure 5 describes the Lawrence curve. Taking the quality line as the standard line, the data analysis results of the selected ports from 2009 to 2018 have basically maintained stable. However, a noticeable change has seen in 2017. The 2017 and 2018 curves
show that the region has begun to move towards the opposite direction of the equality line.
Identically, this change also mirrored a trend of concentration. This may be due to the apparent concentration of cruise lines in the region towards the western Mediterranean since 2017.
The trend of concentration shown the results of CR3, HHI and Gini coefficient indicates the western Mediterranean is the most popular area to visit by cruise shipping companies and the severe competition will be occurred in this area.
Fig. 5. Lorenz curves for cruise ports in Mediterranean
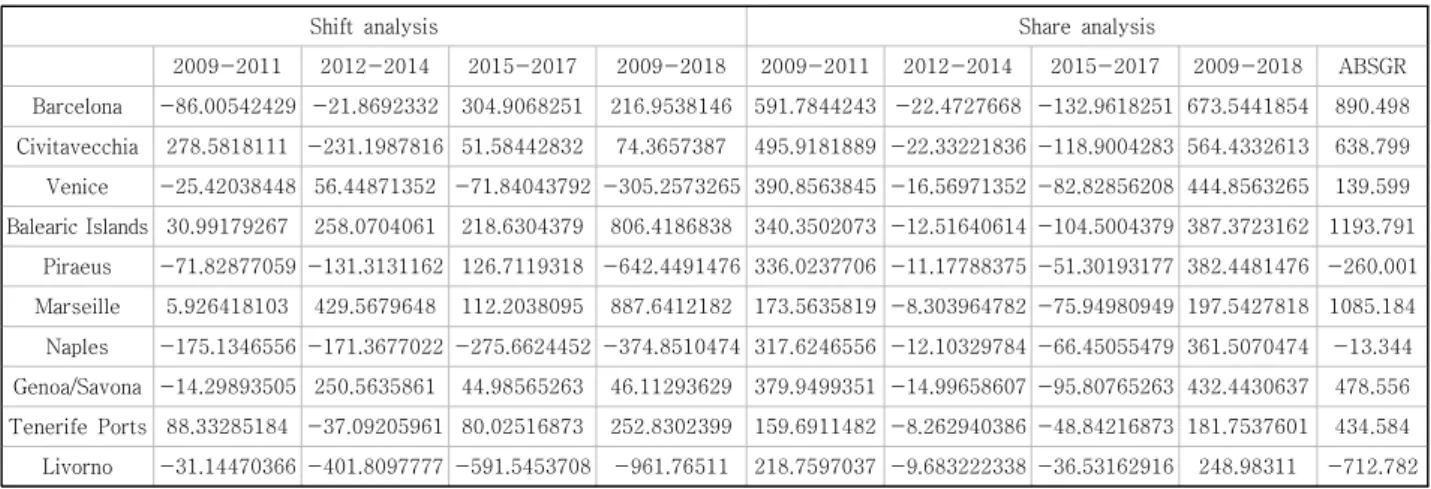
The results of shift-share analysis is indicated in Table 2. Displayed by the numerical results of the shift part, four shift values in the selected ports from 2009 to 2018 were negative. Those ports are Venice, Piraeus, Naples and Livorno.
Except for Piraeus, which is a Greek port, the other three ports are Italian ports. Therefore, it might be concluded that the development of passenger transport undertaken by Italian ports during the period between 2009 and 2018 was not satisfactory, which may be due to the weak economic development of Italy in the past decade (Gui & Russo, 2011) [20].
In share value part, the number of passengers are mostly concentrated in the western Mediterranean region, such as Barcelona, Civitavecchia and Venice. It suggests that cruise lines in the Mediterranean are concentrated in the western Mediterranean (Esteve-Perez &
Garcia-Sanchez, 2017)[21]. This may be related to the important geographical location of the western Mediterranean region (Lekakou et al., 2009)[22]. The western Mediterranean region hosts the strait of Gibraltar to the west, which is the home to significant ports of three European countries Spain, France and Italy. These three countries are also European tourist attractions.
Hence, the current situation that the Mediterranean cruise lines are more concentrated in the western Mediterranean region is also reasonable.
Taking the above discussions about the analysis results, to different extents, all substantiate a concentration trend. Although the trend was not obvious during the 2009-2016 period, the concentration trend has become
Shift analysis Share analysis
2009-2011 2012-2014 2015-2017 2009-2018 2009-2011 2012-2014 2015-2017 2009-2018 ABSGR Barcelona -86.00542429 -21.8692332 304.9068251 216.9538146 591.7844243 -22.4727668 -132.9618251 673.5441854 890.498 Civitavecchia 278.5818111 -231.1987816 51.58442832 74.3657387 495.9181889 -22.33221836 -118.9004283 564.4332613 638.799 Venice -25.42038448 56.44871352 -71.84043792 -305.2573265 390.8563845 -16.56971352 -82.82856208 444.8563265 139.599 Balearic Islands 30.99179267 258.0704061 218.6304379 806.4186838 340.3502073 -12.51640614 -104.5004379 387.3723162 1193.791
Piraeus -71.82877059 -131.3131162 126.7119318 -642.4491476 336.0237706 -11.17788375 -51.30193177 382.4481476 -260.001 Marseille 5.926418103 429.5679648 112.2038095 887.6412182 173.5635819 -8.303964782 -75.94980949 197.5427818 1085.184 Naples -175.1346556 -171.3677022 -275.6624452 -374.8510474 317.6246556 -12.10329784 -66.45055479 361.5070474 -13.344 Genoa/Savona -14.29893505 250.5635861 44.98565263 46.11293629 379.9499351 -14.99658607 -95.80765263 432.4430637 478.556 Tenerife Ports 88.33285184 -37.09205961 80.02516873 252.8302399 159.6911482 -8.262940386 -48.84216873 181.7537601 434.584 Livorno -31.14470366 -401.8097777 -591.5453708 -961.76511 218.7597037 -9.683222338 -36.53162916 248.98311 -712.782
Table 2. Shift-share analysis for cruise ports in Mediterranean
evident since the year of 2017. Hence, the top 10 ports in the Mediterranean region were basically leaned toward concentration during the study period between 2009 and 2018.
5. Conclusion
The purpose of this paper is to analyze the concentration and deconcentration of cruise ports in the Mediterranean area over the period from 2009 to 2018. Through using the well-established 4 methods, such as concentration ratio (CR), the Herfindahl–
Hirschman Index (HHI), the Gini coefficient, and shift share analysis (SSA), this work provides a relatively fair evaluation of cruise ports in the Mediterranean. The results are summarized as follows: reviewing the entire CR3 data, only the value in 2010 declined to lower than 0.40, while the values in other years were all above 0.40. The results of CR3 indicated a concentration trend in the area. In addition, judging from the outcomes of the Herfindahl-Hirschman Index, the analysis values of the selected ports, the region's concentration trend is starting to appear.
Regarding the analysis results of the Gini coefficient, the values indicate a trend of concentration. In addition, this situation is similar to the results of the previous results of the HHI index. In the shift analysis, four shift values in the selected ports from 2009 to 2018 were negative. Those ports which lose the cruise passengers are Venice, Piraeus, Naples and Livorno. And in share value part, the number of passengers are mostly concentrated in the western Mediterranean region, such as Barcelona, Civitavecchia and Venice. It suggests that cruise lines in the Mediterranean are concentrated in the western Mediterranean.
This paper suggests academic implications such as conducting the concentration analysis in the whole Mediterranean Sea, suggesting actual
picture of cruise activities in targeted area, and providing accurate longitudinal trends in the Mediterranean Sea. In addition, this paper provides the shifting PAX among cruise ports that indicates the competitiveness of cruise ports. The results can give the better understanding for industrial stake holders such as tourist boards, ship agents, and port agents. As for practical implications, cruise shipping companies planning to use Mediterranean Sea can get relevant data regarding cruise ports’
competition between them, and their capabilities. Finally, this study also generates valuable references for the port management in this region to propose future development plans.
Due to the data limitation, in this study, the 10 most influential ports in the Mediterranean region are selected for analyzing. For the better understanding of concentration and deconcentration process for cruise ports in Mediterranean sea, the whole data and references are needed in future research.
REFERENCES
[1] A. Papathanassis. (2107). Cruise tourism management:
state of the art. Tourism review, 72(1), 104-119.
Doi: 10.1108/TR-01-2017-0003
[2] CLIA. (2017). The contribution of the international cruise industry to the global economy in 2016, Piraeus, Greece
[3] M. Stojanovic, T.P. Jugovic & A. Jugovic. (2014).
Indicators of passenger flows movements on the world and Mediterranean cruise market. Scientific Journal of Maritime Research 28(1), 40-48
[4] Cruise industry news, 2016-2017, Annual report [5] J. Esteve-Perez & A. Garcia-Sanchez. (2018). Dynamism
patterns of western Mediterranean cruise ports and the coopetition relationships between major cruise ports.
Polish maritime research, 25(1), 51-60.
Doi: 10.2478/pomr-2018-0006
[6] S. Soriani, S. Bertazzon, F.D. Cesare & G. Rech. (2009).
Cruising in the Mediterranean: structural aspects and evolutionary trends. Maritime Policy & Management, 36(3), 235-251.
Doi: 10.1080/03088830902861128.
[7] R.V. Jones. (2011). Motivations to cruise: An itinerary and cruise experience study. Journal of Hospitality and Tourism Management, 18(1), 30–40.
Doi: 10.1375/jhtm.18.1.30
[8] D. Tsiotas, S. Niavis & L. Sdrolias. (2018). Operational and geographical dynamics of ports in the topology of cruise networks: The case of Mediterranean.
Journal of Transport Geography, 72, 23-35.
Doi.org/10.1016/j.jtrangeo.2018.08.001
[9] J. G. Brida, G. D. Chiappa, M. Meleddu & M.Pulina.
(2014). A Comparison of Residents' Perceptions in Two Cruise Ports in the Mediterranean Sea. International Journal of Tourism Research, 16(2), 180-190.
Doi:10.1002/jtr.1915.
[10] G.D. Chiappa, C.L. Romero & M. Gallarza. (2018). Host community perceptions of cruise tourism in a homeport: A cluster Analysis. Journal of Destination Marketing & Management, 7, 170-181.
Doi:10.1016/j.jdmm.2016.08.011
[11] K. Andriotis & G. Agiomirgianakis. (2010). Cruise Visitors’ Experience in a Mediterranean Port of Call.
International Journal of Tourism, 12(4), 390–404 Doi:10.1002/jtr.770
[12] S.S. Blas & E. Carvajal-Trujillo. (2014). Cruise passengers' experiences in a Mediterranean port of call. The case study of Valencia. Ocean and Coastal Management, 102, 307-316.
Doi:10.1016/j.ocecoaman.2014.10.011
[13] F. Murena, L. Mocerino, F. Quaranta & D. Toscano.
(2018). Impact on air quality of cruise ship emissions in Naples, Italy. Atmospheric Environment, 187, 70-83.
Doi:10.1016/j.atmosenv.2018.05.056
[14] G. Wang, K.X. Li & Y. Xiao. (2019). Measuring marine environmental efficiency of a cruise shipping company considering corporate social responsibility.
Marine Policy, 99, 140-147.
Doi.org/10.1016/j.marpol.2018.10.028
[15] S. Niavis & D. Tsiotas. (2018). Decomposing the price of the cruise product into tourism and transport attributes: Evidence from the Mediterranean market.
Tourism Management, 67, 98-110.
Doi.org/10.1016/j.tourman.2018.01.004
[16] M.I. Cusano, C. Ferrari & A. Tei. (2017). Port Hierarchy and Concentration: Insights from the Mediterranean Cruise Market. International Journal of Tourism Research, 19(2), 235-245.
Doi:10.1002/jtr.2106
[17] T. Karlis & D. Polemis. (2018). Cruise homeport competition in the Mediterranean. Tourism Management, 68, 168-176.
Doi: 10.1016/j.tourman.2018.03.005
[18] T.E. Notteboom. (1997). Concentration and load centre development in the European container port system. Journal of transport geography, 5(2), 99-115.
Doi.org/10.1016/S0966-6923(96)00072-5
[19] C. Sys. (2009). Is the container liner shipping industry an oligopoly. Transport policy, 16(5), 259-270.
Doi:10.1016/j.tranpol.2009.08.003
[20] L. Gui & A. P. Russo. (2011). Cruise ports: a strategic nexus between regions and global lines—evidence from the Mediterranean. Maritime Policy &
Management 38(2), 129-150.
Doi:10.1080/03088839.2011.556678.
[21] J. Esteve-Perez & A. Garcia-Sanchez. (2017).
Characteristics and consequences of the cruise traffic seasonality on ports: the Spanish Mediterranean case.
Maritime Policy & Management, 44(3), 358-372.
DOI: 10.1080/03088839.2017.1295326
[22] M. B. Lekakou, A.A. Pallis & G. K. Vaggelas. (2009).
Which homeport in Europe: the cruise industry's selection criteria. Tourismos: an international multidisciplinary journal of tourism, 4(4), 215-240.
Accession Number: edselc.2-52.0-78651517545
유 사 위(Liu si wei) [학생회원]
․ 2017년 2월 : Chungnam National University, Bachelor of Arts in English Language & Literature
․ 2019년 2월 : Incheon National University, Master of Logistics in Logistics management
․ 2019년 9월 ~ 현재 : Incheon National University, Graduate School of Logistics Doctoral Course
․ Research Interested in : Port logistics, Shipping industry
․ E-Mail : [email protected]
여 기 태(Gi-Tae Yeo) [종신회원]
․ 2007년 2월 : University of Plymouth (경영학 석사, 경영학박사)
․ 2008년 9월 ~ 현재 : 인천대학교 교수
․ 관심분야 : 해운물류, 항만물류, System Dynamics, Fuzzy methodology
․ E-Mail : [email protected]