1. Introduction
For the past decade, maritime trade in Europe has experienced a considerable growth. Maritime trade represents an essential link in multimodal transport. As it is, the globalization process has made it easier for
governments and businesses to gain access to trading opportunities all over the world [1]. Our target area, the Baltic Sea, was once a referent in maritime trade, gaining advantage from the geographical location[2], the key position in the transportation corridor as a link between East and West and the growing Baltic
The study on the research trend about Europe ports: focus on Baltic Sea using Keyword network
Beatriz Barrera Delgado, Hye Min Ma, Jae gyun Oh, Gi Tae Yeo
Graduate school of Logistics, Incheon National University
키워드네트워크 분석을 활용한 유럽항만의 연구동향 분석 :발틱해를 중심으로
Beatriz Barrera Delgado, 마혜민, 오재균, 여기태*
인천대학교 동북아 물류대학원
Abstract Since the 17th century, international trade has increased as a result of the development in the navigation skills. Recently, maritime transport, compared to other modes, is used more than 70% worldwide by shippers and ports, and it also has become essential in international trade. Most researchers focused only on port development, in topics like ensuring depth of water, port competition and port governance, but have left some topics undone, such as environment, ecosystem and balanced development. Therefore, this study provides insight to the academic world in port research using SNA (Social Network Analysis). The result of the SNA study shows that Baltic Sea ports researchers have focused on “Shipping”, “Marine ecosystem”and “Pollution”. The implications of this study are: first, the environment has become a main issue in the research field; second, the results suggest focusing on the main keywords from the keyword network. This study has some limitations such as excluding domestic journals and focusing in the recent 10 years.
Key Words : Baltic sea port, SNA (Social Network Analysis), Pollution, Maritime transport, Shipping
요 약 17세기 이후 항해기술의 진전과 더불어 국제무역은 증가되기 시작했다. 최근 해상운송은 화주 및 항만의 수요에
힘입어 운송모드 중 70%의 처리를 수행하고 있다. 이러한 측면에서 대부분의 연구자들은 항만개발 즉 항만수심, 항만경쟁, 항만관리 등에 집중하고 있으며, 환경, 생태계 및 조화로운 개발 등의 분야는 연구가 미진한 상황이다. 본 연구는 발틱해를 중심으로 해운, 항만 생태계, 오염 등에 집중하여 SNA 방법을 이용한 키워드네트워크를 분석하였다. 연구결과 발틱해 지역 의 가장 큰 관심은 환경문제로 나타났다. 10년간의 연구기간 및 현지어로 수행된 연구결과를 포함하지 못한 한계가 있다.
주제어 : 발틱해, SNA (Social Network Analysis), 오염, 해상운송, 해운
*Corresponding Author : Gi Tae Yeo([email protected]) Received December 1, 2017
Accepted February 20, 2018
Revised January 30, 2018 Published February 28, 2018
economies[3]. The current situation of the Baltic Sea ports represents a challenge in terms of reinventing their maritime shipping processes, so as to improve the port services and being able to compete with other European ports, and through a better risk and environmental management [4,5].
Moreover, the threat to the marine environment that chemical transport and accidental spills represent [6]
and the contamination found in sediment samples from seaport areas with a higher transport traffic [7] had brought to light the need for the strengthening of environmental policies. Since 2015, IMO (International Maritime Organization) has tightened the environmental regulation in the North Sea and the Baltic Sea area, setting a low sulfur policy, with either the use of LNG fuel or low sulfur oil, less than 70%
SOx emissions [8].
By studying the research trend in the Baltic Sea seaports, the results suggest future research tasks.
Korean researchers [9] have focused until now on port competition, port development and container ports.
However, green ports, marine ecosystem and pollution have been relatively short of interest and research.
The research found gap in this topic shows that there are limited papers on research trend analysis in seaports in the Baltic Sea area. Moreover, only few studies using the keyword network analysis have been found. Research methodology has been limited so far to diversity analysis on topics and methodologies such as frequency analysis.
Thus, this study proposes the analysis of research related to the Baltic Sea ports for the past 10 years, In order to evaluate the change of the trend over the years, a research trend analysis of seaports in the Baltic Sea for the past 10 years will be conducted by comparing the periods 2007-2012 and 2013-2017.
The methodology applied for this study is SNA (Social Network Analysis) methodology using the
“degree centrality”and “betweenness centrality”, previous filtering of 632 keywords from 133 papers.
The analysis of the keyword network identified the
main topics in the network, offering an overview on the flow of the research trend over the years.
The research process is as it follows. First, international and domestic background are provided, followed by a literature review where the problem that should be considered for this research is introduced.
Then, comparing the results found by the previous researchers and addressing the problem to be considered, the research gap is proposed. After that, the purpose of this research is presented in the objective section, where the methodology will also be introduced.
Finally, a summary or the results, implications and limitations will be mentioned and presented.
2. Literature review
2.1 Study on research trends related to logistics
Research trends using "logistics" as a keyword can be divided into research trends of logistics related academic societies and analysis of research trends concerning detailed themes.
A paper on research trends was published for
"Maritime Logistics Research", a magazine of the Korea Shipping and Logistics Association from 2000 to 2012. Oh [10], No. 1 to No. 30, Yoon[11], No. 31 to No.
40, Ha (2006), No. 41 to No. 50, Koo [12], No. 51 to No.
60, and Kim[13] was analyzed from No. 61 to No. 70.
They classified topics and carried out quantitative research in various parts such as frequency of research theme, frequency of researcher occupation, number of participants, frequency of research method. Park et al[14] analyzed the research trends from Vol.17 to Vol.18 of the Journal of Logistics Society, Korea's Logistics Association magazine.
Analysis of research trends on detailed themes by
Yoon [15], who conducted research trends analysis for
164 academic journals concerning domestic logistics
research results from 2001 to 2015. Many research on
the relationship between logistics management system,
environment, partnership and logistics results had been conducted as a result of the analysis; the research method, questionnaire survey and data analysis method were mainly utilized by using regression analysis and structural equation model. Besides that, the research trend of E-Logistics was conducted by Kim et al [16]
and Kim et al [17]. Cho [18] conducted research trends analysis on accounting related to logistics.
As for the research trends analysis using "trade" as a keyword, research of trends of academic societies, analysis of the research distribution and trends on specific topics were conducted. Kang et al [19] used SNA and analyzed the co-authors network of Korean trade journal magazine, revealing the network of cooperative relations and social relations for joint research. As a result of the analysis, authors with high centrality are actively conducting research as the main author and coauthor, and it turns out that the activities of co-authors have increased compared to the past.
Thus, the research results were positively influenced.
The analysis of research trends on detailed topics related to trade has resulted in numerous analysis, along with advances in technologies such as E - Commerce, E - law and E - Trade. Particularly in the E-Commerce Research Vol.8, No. 1, an analysis of research trends on various forms of electronic transactions was conducted. Jang et al [20] presented implications on the research trend on E-trade and the direction of future research, and Kim et al [21] analyzed research trends on E-commerce. Lee et al [22] analyzed research trends on E-business. Jang et al [23] did a literature review of E-Law. Yoon [24] analyzed research trends in trade risk management. In addition, Koo [25] carried out research trends in the field of marine policy and Lee et al [26] analyzed the research trends in domestic cruise industry.
2.2 SNA study regarding port
The authors used Freeman [27] degree, Closeness, and Betweenness centrality to measure the importance of container ports.
Kang et al [28] analyzed the port networks of major shipping companies in the world using Social Network Analysis. As a result of the analysis, the characteristics of the port networks consisted of a network without a scale with the rule of the power function. The result of the analysis of Centrality show Asian ports such as Hong Kong, Singapore and Busan ranked high in connection, proximity and mediation center.
By using the SNA methodology, Lim et al [29]
analyzed the port network based on the moving trade volume by shipping nationality of Korea, China, Japan and Taiwan. Hong Kong Port was the best in terms of connectivity centrality.
Kim [30] conducted a study on China’s port concentration and trade through an HHI and SNA analysis. The analysis shows that Busan Port is the most concentrated, but it confirms that the proportion of the ports in the West Coast is gradually increasing.
Kim [31] has analyzed the RoRo Perrier route between Korea, China and Japan using SNA. The authors raised the feasibility of introducing RoRo Perry in the context of the Korea - China - Japan FTA signing.
Park et al [32] studied the change of container liner route around Incheon port using Social Network Analysis. By analyzing quarterly time series data from 2008 to 2015, Hong Kong Port and Busan Port have consistently high centered. However, the eastern ports of Singapore and China show low centrality, and the high influence of the trade volume observed in those areas differs with the not so positive network analysis results.
Lim [33] applied SNA's eigenvector centrality and PageRank centrality to measure the influence of harbors. The paper is characterized by the use of DEA lambda values for social network analysis. After applying the page rank centrality, Lianyungang, Shenyang, Shanghai and Hong Kong were ranked in high positions.
Son [34] assessed the impact of efficient container
terminals. The author selected three terminals in
Gwangyang Port and ten terminals in Busan Port. The analysis shows that HJNC terminal in Busan Port is the most influential, followed by PNC and Wuam Pier.
The authors presented the limitations of constructing the BCC model only in the social network.
Joo [35] studied network aspects from the factors of innovation and human interaction in Korea's national innovation system. As a result, Korea's network of national innovation system in information and communication sector appeared to be a narrow world network type.
Kim et al. [36] used the SNA to study the relationship between items purchased by consumers.
As a result of analysis, young casual was derived as a product with high centrality. The authors suggested that this could be an important piece of information for marketing strategy development.
Kim [37] studied the diffusion of information and changes in distribution channels in the internet environment to predict social change. Using SNA method, the author argued that the influence of the portal site has increased as a media for individuals to obtain information.
Lee et al [38] studied cultural differences in on-line using SNA based on Hofstede's cultural dimension.
The authors analyzed cell phone related word of mouth data collected from online communities in Korea, US and UK. As a result of the analysis, result were in contradiction with offline claims.
2.3 Research trends using SNA
Ko et al [39] conducted a study trend analysis using SNA to analyze the macro flow of technical management-related studies. The author has discovered that the newly created keywords are linked based on existing highly-connected keywords.
Yang [40] studied the research trends through the articles published in ‘International Commerce and Information‘ using SNA. The authors suggested that research is needed to statistically validate these indicators with social network analysis indicators.
Song et al [41] studied research trends in the Chinese OBOR(One Belt One Road) project using SNA analysis. The authors suggested that OBOR study is underway for a short time, but lacks research to study the details of the project.
2.4 Research gap
Previous research in the international and domestic field showed several studies using SNA to analyze route networks, based on traffic and freight volume, or the commonly used keyword analysis for the research on small field industries such as the world cruise industry. Most of the detailed research trend analysis in the logistics field have already been analyzed previously in journals.
The research found gap in this topic shows that there are limited papers on research trend analysis in seaports in the Baltic Sea area. Moreover, few studies using the keyword network analysis have been found.
Research methodology has been limited so far to diversity analysis on topics and methodologies such as frequency analysis.
Regarding this aspect, this study analyzes Baltic Sea ports related papers for the past 10 years. In order to evaluate the change through the years, a research trend of ports in the Baltic Sea will be conducted by comparing the periods 2007-2012 and 2013-2017 by equally dividing the number of papers.3. SNA(Social Network Analysis)
Social network analysis is a study that deduces the social relation structure in the network by measuring the relationships among actors in the network [42]
Social Network Analysis results do not offer independent characteristics of each node in the network; instead, the information obtained from the analysis of the network characteristics represents the nodes and the relation between them. The information obtained through Social Network Analysis includes
“degree centrality”and “betweenness centrality”, among others [43]
Unlike traditional statistical method, SNA is able to
analyze the relationship between the keywords of theses and visualize the relationship of each keyword.
Therefore, there is an advantage that the research trend can be known more objectively.
The research framework of this paper follows the structure shown in Fig. 1.
Fig. 1. Research Flow chart
The degree of centrality is the concept of centering connected nodes between points. This is measured by the number of nodes connected to each point, and the more nodes connected to each node, the higher the connection centrality is analyzed. The connection centrality of node
means the connectivity of nodes in the network. Assuming that node
and node
are connected,
, otherwise
can be defined as follows.
(1)
Betweenness centrality is a measure of the role of a mediator or arbiter in a network structure. That is, it measures whether a point plays the role of a broker in establishing a network with other points.
(
) is the ratio of all the shortest paths through node
. In the equation,
denotes the number of the shortest distance link between
and
, and
denotes the number of times passing through point
between two points
and
(
≠
).
(2)
In this paper, This research use two centralities as degree and betweenness. The reason why this study
selected betweeness is core subjects cannot be defined only degree because of the characteristic of centrality in SNA. Also the clustering process is organized by betweeness centrality.
4. Case study
4.1 Data Collection
This study uses Science Direct, Emerald, Scopus and Springer, major research DB (Data Base). The target papers in this research are the ones published from 2007 to 2017 with the defined keywords “Baltic sea”and “Port.” In other words, the analysis object range are articles where these keywords appear in either title, abstract and keyword, except for presentation papers. and the collected keyword information is confirmed and necessary modifications are made to suit the analysis. This is a process to increase the accuracy of analysis results through keywords of the same meaning among the articles published in academic journals. It also includes the process of deleting data that needs to be excluded from the analysis and creating data for analysis.
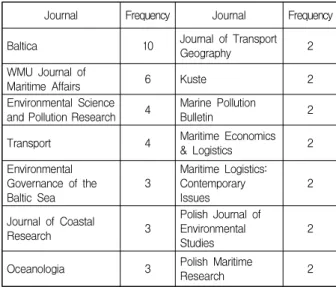
The following Table 1 presents the number of papers for each journal analyzed in the research.
Journal Frequency Journal Frequency
Baltica 10 Journal of Transport
Geography 2
WMU Journal of
Maritime Affairs 6 Kuste 2
Environmental Science
and Pollution Research 4 Marine Pollution
Bulletin 2
Transport 4 Maritime Economics
& Logistics 2 Environmental
Governance of the
Baltic Sea 3 Maritime Logistics:
Contemporary
Issues 2
Journal of Coastal
Research 3 Polish Journal of
Environmental
Studies 2
Oceanologia 3 Polish Maritime
Research 2
Table 1. The number of articles used in the study by Journal
A total of 632 keywords have been defined through a keyword filtering process. The number of papers and keywords used in the analysis can be observed in the following Fig. 2.
Fig. 2. The number of articles and keywords by year
4.2 The results of SNA for the whole period For Degree centrality results, the keywords in order are Sediment, Salt, Shipping, Simulation and Intermodal. “Sediment”having the most frequency of connection to other nodes demonstrates that many researchers have considered marine ecosystem and geology while researching seaports in the Baltic Sea area. “Eutrophication”, “Introduced Species”and
“Plankton”in lower positions also have a similar meaning. “Salt”and “Brackish Water” keywords show the other trend in the Baltic Sea. As the Baltic Sea is located near the North Pole, the salt level in the Baltic waters is around 10%. With global warming and poles melting, topics such as levels of salt in marine waters are becoming important.
Frequent keywords in the Shipping field are
“Intermodal”and “Short Sea Shipping”. Recently,
“Intermodal”is a major trend of shipping in the world.
Because of the Baltic Sea geographical location advantage feeder networks can be easily developed.
“Short Sea Shipping”with a high position in the rank is also an attractive factor to researchers.
“Oil Pollution”and “Oil Spill”are also considered important issues in the Baltic Sea. The IMO (International Maritime Organization) has tightened the environmental regulation in the North Sea and the Baltic Sea since 2015. All the ships passing by the North Sea and the Baltic Sea should use either LNG fuel or Low Sulfur Oil with emissions of less than 70%
SOx.
The following Table 2 and Table 3 show the results of Degree and Betweenness centralities for the whole period (2007-2017).
NO. keyword value NO. keyword value
1 Sediment 42 21 LowTemperature 16
2 Salt 28 22 Map 16
3 Shipping 27 23 North Atlantic 16
4 Simulation 24 24 Oil Spill 16
5 Intermodal 21 25 Survey 16
6 Eutrophication 20 26 Survival 16
7 IMO 20 27 Port Authority 15
8 Logistics 20 28 Container Port 14
9 Risk 20 29 Ship 13
10 Short SeaShipping 20 30 Ballast Water 12 11 Oil Pollution 18 31 Heavy Metal 12
12 Pollution 18 32 Plankton 12
13 AnthropogenicFactor 16 33 Contaminant 11
14 Atlantic Ocean 16 34 Environmental Impact
Assessment 11
15 Ballast Tank 16 35 Finland 11
16 Brackish Water 16 36 Port Governance 11
17 Community 16 37 Region 11
18 IntroducedSpecies 16 38 Risk Assessment 11
19 Invasion 16 39 Sweden 11
20 Invertebrata 16 40 Climate Change 10 Table 2. The results of Degree centrality (2007-2017)
“Sediment”, “Shipping” and “Salt” networks are the following figures.
Oil Pollution in the
Baltic Sea 3 Science of the Total
Environment 2
Transport and
Telecommunication 3 Territoire en
Mouvement 2
Aquatic Invasions 2
Transportation Research Part D:
Transport and Environment
2
Environmental Monitoring and
Assessment 2 Transportation
Research Procedia 2 Journal of Shipping
and Trade 2 other 67 Jounal 67
Fig. 3. “Sediment”keyword network
Fig. 4. “Shipping”keyword network
Fig. 5. “Salt”keyword network
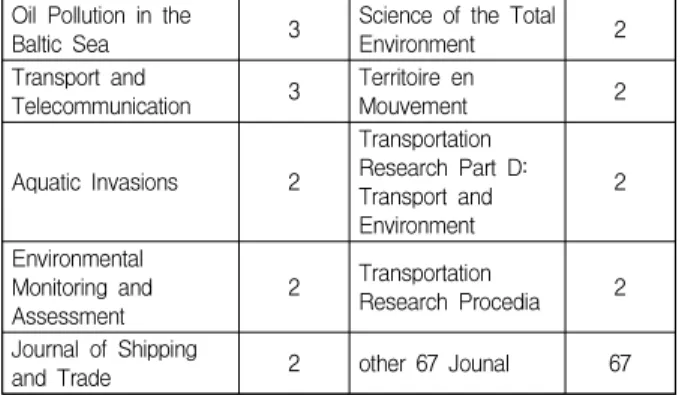
For Betweenness centrality, the most common keywords in the research trend in order are “Shipping”,
“Sediment”, “Short Sea Shipping”, ‘Oil Spill’and
“Pollution”.
The results are quite similar to Degree centrality, except for some keywords that hold a higher rank such as “Ferry”and “Transport.”
NO. keyword value NO. keyword value
1 Shipping 11698 21 Port Authority 3071 2 Sediment 11037 22 Oil Transport 2858 3 Short Sea
Shipping 8103 23 Environmental Impact
Assessment 2471
4 Oil Spill 7439 24 Plankton 2236
5 Pollution 7267 25 Emission 2231
6 Salt 6896 26 Logistics 2172
7 Container Port 6181 27 Trend 2144
8 South Eastern
Baltic 5986 28 Tributyltin 2094
9 Oil Pollution 5566 29 Gulf Of Riga 2093 10 Simulation 5198 30 Heavy Metal 2093
11 Ballast Water 4939 31 Russia 2053
12 Risk 4889 32 Ship 1997
13 IMO 4693 33 Climate Change 1808
14 Region 3553 34 Risk Assessment 1808
15 Intermodal 3546 35 Ferry 1692
16 PortGovernance 3485 36 Pollution Spread 1455 17 Eutrophication 3468 37 Transport 1366 18 CuronianLagoon 3253 38 Sea Environment 1353 19 Helcom 3153 39 Gulf Of Finland 1330
20 Contaminant 3124 40 Recycling 1281
Table 3. The results of Betweenness centrality (2007-2017)
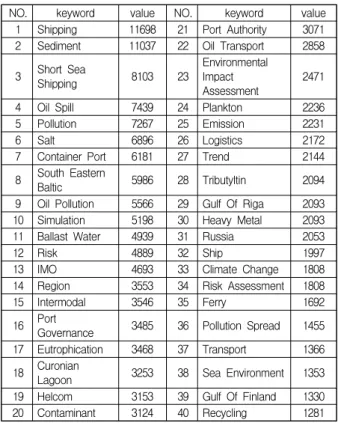
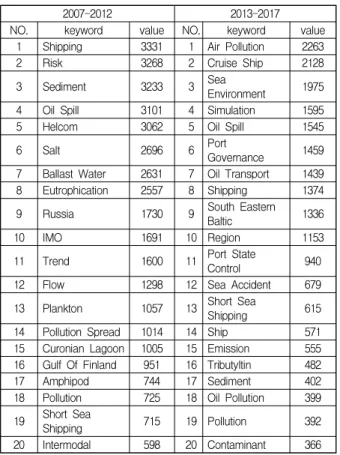
4.3 The result of SNA each period
Focusing on the 2nd period, almost all the keywords are changed compared to the first one. In 2007-2012, Marine Ecosystem related nodes like “Sediment”,
“Salt”and “Eutrophication”take higher ranks than other nodes. During the period of 2013 to 2017 almost all keywords, including “oil”had been replaced by pollution keywords, except “Sediment”. The following Table 4 is the result of Degree and Betweenness centralities by dividing an equal number of papers (2007-2012, 2013-2017).
The results of Betweenness centrality show similar pattern to the results for Degree centrality. Ecosystem related nodes like “Sediment”, “Helcom”(The Baltic Marine Environment Protection Commission) and
“Eutrophication”, are changed to “Pollution”related nodes (Air Pollution, Oil Spill and Emission) and
“Shipping”related nodes (Cruise Ship, Shipping and
Short Sea Shipping) from the 1st period to the 2nd
period.
2007-2012 2013-2017
NO. keyword value NO. keyword value
1 Sediment 34 1 Simulation 24
2 Salt 28 2 Shipping 16
3 Eutrophication 20 3 Ship 13
4 Risk 20 4 Finland 11
5 North Atlantic 17 5 Sweden 11
6 Anthropogenic
Factor 16 6 Oil Pollution 10
7 Atlantic Ocean 16 7 Oil Spill 10
8 Ballast Tank 16 8 Sediment 10
9 Brackish Water 16 9 Design 9
10 Community 16 10 Emission 9
11 IMO 16 11 Exhaust System 9
12 Introduced Species 16 12 Fluid 9
13 Invasion 16 13 Heat Recovery 9
14 Invertebrata 16 14 Intermodal 9
15 Low Temperature 16 15 Organic RankineCycle 9
16 Map 16 16 Poland 9
17 Survey 16 17 Stress 9
18 Survival 16 18 Temperature 9
19 Short Sea Shipping 14 19 Turbine 9
20 Intermodal 13 20 Ais Data 8
Table 4. The results of Degree centrality by period
2007-2012 2013-2017
NO. keyword value NO. keyword value
1 Shipping 3331 1 Air Pollution 2263
2 Risk 3268 2 Cruise Ship 2128
3 Sediment 3233 3 SeaEnvironment 1975
4 Oil Spill 3101 4 Simulation 1595
5 Helcom 3062 5 Oil Spill 1545
6 Salt 2696 6 PortGovernance 1459
7 Ballast Water 2631 7 Oil Transport 1439 8 Eutrophication 2557 8 Shipping 1374 9 Russia 1730 9 South EasternBaltic 1336
10 IMO 1691 10 Region 1153
11 Trend 1600 11 Port StateControl 940
12 Flow 1298 12 Sea Accident 679
13 Plankton 1057 13 Short SeaShipping 615
14 Pollution Spread 1014 14 Ship 571
15 Curonian Lagoon 1005 15 Emission 555 16 Gulf Of Finland 951 16 Tributyltin 482
17 Amphipod 744 17 Sediment 402
18 Pollution 725 18 Oil Pollution 399 19 Short Sea
Shipping 715 19 Pollution 392
20 Intermodal 598 20 Contaminant 366
Table 5. The results of Betweenness centrality by period
5. CONCLUSION
Utilizing Social Network Analysis, the results of research trend analysis obtained are as it follows. As a result of Degree and Betweenness centralities for the whole period (2007-2017), the most central subjects are
“Sediment”and “Shipping.” In case of Degree centrality, keywords associated with Marine ecosystem, Shipping, and Oil pollution rank in high positions. In contrast,
“Ferry”and “Transport”appear in high positions in Betweenness centrality. For results of Degree and Betweenness centralities compared in two periods (2007-2012, 2013-2017), dividing into the same number of papers, both of the periods tend to change from Marine ecosystem to Pollution and Shipping keywords.
Based on the results, networks consist of related words, divided into three main subjects, “Shipping”,
“Pollution”and “Marine ecosystem”. Shipping network is also made up of 4 subgroups, “Short Sea Shipping”,
“Bulk shipping”, “Transport”and “Shipping. Pollution”.
“Air Pollution”and “Oil Pollution”are connected to each other in the Pollution network. Lastly, Marine ecosystem consists of “Sediment”and “Marine ecosystem change”.
this study can be confirmed that interest in marine environment which has not yet been activated in domestic research has become a social and research issue in the Baltic Sea region early. In particular, relevant research trends in the Baltic Sea, which enforces the globally highlighted ECA regulations, could suggest implications for many stakeholders in the future. As a result of this study, study regarding the Baltic Sea region was considered to have centrality in keywords such as "sediment", "shipping", and "risk"
The implications of this study are the following.
Firstly, the keyword network analysis of the Baltic Sea area provides numerous related results such as
“pollution”, “green port”or “oil spill”. it’s time to pay
attention to environment problem about port. In
research trend baltic sea port by each period, all of the
centralities show that the tendency of study has been
changing to “Pollution”. Therefore, the academic should consider variety environmental subjects like as sea environment, green port and oil spill.
Secondly, the research field in the future, this study included, should cover a longer period and be more detailed about the keywords and research subjects.
Among the keywords analyzed for the clustering process, “Short Sea Shipping”and “Emission”have not been fully researched in the domestic field. By covering a wider range of keywords, researchers can strive for a balanced research direction.
However, there are limitations for this research.
First, domestic articles have not been considered because of a language barrier, thus it was difficult to analyze the results as conclusive. Future researchers should explore this topic using domestic research, in order to obtain more accurate results. To conclude, this research is based only in the last 10 years of research trend analysis. Therefore, researchers ought to expand this research scope in future research.
REFERENCES
[1] Grossmann, H., Otto, A., Stiller, S., & Wedemeier, J.
(2007). Growth potential for maritime trade and ports in Europe.
Intereconomics, 42(4),
226-232.[2] Sampson, H., Bloor, M., Baker, S., & Dahlgren, K. (2016).
Greener shipping? A consideration of the issues associated with the introduction of emission control areas.
Maritime Policy & Management, 43(3),
295-308.[3] Urbanyi-Popiołek, I., & Klopott, M. (2016). Container terminals and port city interface–a study of Gdynia and Gdańsk ports.
Transportation Research Procedia, 16,
517-526.[4] Jarašūnienė, A., Greičiūnė, L., & Šakalys, A. (2012).
Research of competitive environment of Klaipėda Seaport comparing to other seaports in the eastern Baltic Sea region.
Transport, 27(1),
5-13.[5] Jaržemskienė, I., Barysienė, J., Jaržemskis, V., &
Jaržemskis, A. (2008). THE FEASIBILITY STUDY TO
TRANSFER GOODS BETWEEN PORTS OF
KLAIPEDA AND SWINOUJUSCE.
Transport, 9(4),
38-48[6] Häkkinen, J., Malk, V., Posti, A., Penttinen, O. P., Mäkelä, R., & Kiiski, A. (2013). Environmental risk assessment of the most commonly transported chemicals: case study of Finnish coastal areas.
WMU Journal of Maritime Affairs, 12(2),
147-160.[7] Filipkowska, A., Kowalewska, G., Pavoni, B., &
Łęczyński, L. (2011). Organotin compounds in surface sediments from seaports on the Gulf of Gdańsk (southern Baltic coast).
Environmental monitoring and assessment, 182(1-4),
455-466.[8] Aronietis, R., Sys, C., van Hassel, E., & Vanelslander, T.
(2016). Forecasting port-level demand for LNG as a ship fuel: the case of the port of Antwerp.
Journal of Shipping and Trade, 1(1),
2-22.[9] H. M. Ma, S. G. Yoon, H. H. Kim & G. T. Yeo. (2017).
A Study on Research Trend in Field of Port through Keyword Networks,
Korea International Commerce Review, 32(2),
109-128.[10] S. Y. Oh. (2000). An Analysis on Shipping Research Papers in Korea : 1984 - 2000.
The Journal of shipping and logistics, 31,
1-16.[11] I. H. Yoon. (2004). From Vol. 31 to Vol. 40. = An Analysis of the Articles issued in Korea Journal of Shipping and Logistics,
The Journal of shipping and logistics, 42,
1-19.[12] J. S. Koo. (2009) Analysis of the Articles published in The Journal of Shipping and Logistics: from Vol.51 to Vol.6,
The Journal of shipping and logistics, 62,
775-800.[13] G. S. Kim. (2012). Analysis of the Articles Published in The Journal of Shipping and Logistics -From Vol. 61 to Vol. 70,
The Journal of shipping and logistics, 28(1),
107-126.[14] J. S. Park & D. H. Kim. (2009). Analysis of the Articles issued in Korea Logistics Review: From Vol 17 to Vol 18,
Korea Logistics Review, 19(2),
5-26.[15] H. Y. Yoon. (2016). Thematic Review of Logistics Performance Research in Korean Journals through 2001 to 2015,
KOREA INTERNATIONAL COMMERCIAL REVIEW, 31(1)
, 71-96.[16] S. K. Kim & D. J. Kang. (2010). Research Trends Analysis and Future Research Direction in Korean e-Logistics,
E-Trade Review, 8(1)
, 39-48.[17] T. W. Kim, J. H. Oh & S. H. Woo. (2016). A Structured Review on Research Trend in the E-logistics Research in Korean Journals,
International Commerce and Information Review, 18(1),
29-54.[18] H. S. Cho. (2008). Logistics Account's Research Tendency,
Korean Business Education Association, 13,
145-166.
[19] D. J. Kang & K. N. Lee. (2015). A Study on Co-author Networks of Journal of Korea Trade Research Association using Social Network Analysis,
Korea trade review, 40(5)
, 1-23.[20] Y. S. Jang & J. H. Kim. (2010). An Approach to Recent Articles on e-Trade and Future Research Direction,
E-Trade Review, 8(1)
, 27-38.[21] J. C. Kim, S. S. Shin & J. H. Park. (2010). A Study on Research Directions Based on Recent Research Trends of e-Commerce,
E-Trade Review, 8(1)
, 1-12.[22] C. B. Lee & J. H. Noh. (2010). An Approach to Recent Research Trends of e-Business and Future Research Direction,
E-Trade Review, 8(1),
13-23.[23] H. H. Chang & J. H. Na. (2010). An Study on the Research Trends and Future Direction in e-Law,
E-Trade Review, 8(1)
, 61-71.[24] H. B. Yin. (2017). Research Trend and Future Research Area on Trade and FDI Risk of Korean Firms in China,
Asian Trade Risk Management(ATRM), 1(2)
, 1-18.[25] M. G. Koo. (2013). Special Issue : Analysis of Sea Lane Research in 2012A Meta-Analysis of Maritime Policy Research in Korea,
Institute of East and West Studies, 5(4),
33-60.[26] J. Y. Lee, S. H. Han & K. S. Kwon. (2015). A study on Korean legal research trend during the last 10 yearsbased on keyword network analysis,
Ajou Law Research, 8(4)
, 519-539.[27] Freeman, L. C. (1978). Centrality in social networks conceptual clarification.
Social networks, 1(3)
, 215-239.[28] D. J. Kang, H. S. Bang & S. H. Woo. (2014). A Study on the Liner Shipping Network of the Container Port,
A Study on the Liner Shipping Network of the Container Port, 30(1)
, 73-96.[29] B. H. Leem, S. M. Kim & H. K. Hong. (2010).
Comparison of Asia Port Networks based on National Shipping Companies: Social Network Analysis(SNA) Perspective,
Journal of Knowledge Information .Technology and Systems, 6(5)
, 45-56[30] S. K. Kim. (2014). A Study on the Concentration of Port Traffic in Trade between Korea and China,
Journal of Korea Trade, 39(5)
, 139-159.[31] S. K. Kim. (2015). A study on the Social Network Analysis for Ferry Service Route in Northern Asia Short Sea,
The Journal of Maritime Business, 32
, 1-23.[32] K. H. Park, M. S. Lim & S. B. Ahn. (2016). Analysis of the Changes of Liner Service Networks by Using SNA : Focused on Incheon Port,
Journal of korea port
economic association, 32(1)
, 97-122.[33] B. H. Lim. (2012). Using Social Network Analysis to Measure Influence and Rank of Efficient Ports,
Journal of the Korean Society fo Supply Chain Management, 12(1)
, 37-47.[34] Y. J. Son. (2015). The Influence of Efficient Container Terminals Using DEA and SNA,
Journal of korea port economic association, 31(3)
, 155-166.[35] S. H. Joo. (2016). Analysis on structure of National Innovation System in IT,
Journal of Digital Convergence, 14(4)
, 129-138.[36] B. K. Kim, S. B. Jeong & K. S. Kwon. (2013). A study on relational analysis of purchasing items of on-line shopping mall based on social network analysis,
Journal of Digital Convergence, 11(11)
, 209-217.[37] Y. M. Kim. (2009). The Study on the on-line community with information circulation through path analysis,
Journal of Digital Convergence, 7(5)
, 61-69.[38] H. J. Lee, D. I. Lee & W. S. Woo. (2016). A Cross-Cultural Study on the Interaction of Participants in the Online Community Using Social Network Analysis,
Journal of Digital Convergence, 14(9)
, 73-87.[39] J. C. Kho, K. T. Cho & Y. H. Cho. (2013). A Study on Recent Research Trend in Management of Technology Using Keywords Network Analysis,
Journal of Intelligence and Information Systems, 19(2)
, 101-123.[40] K. W. Yang. (2017). Research Trend Analysis of
`International Commerce and Information Review` Using SNA-based Keyword Network Analysis,
International Commerce and Information Review, 19(1),
23-42.[41] M. G. Song, Y. D. Cha & G. T. Yeo. (2016). An Analysis of the "One Belt, One Road" Research Trend Using Social Network Analysis,
The Journal of shipping and logistics, 90
, 387-413.[42] M. G. Song, J. K. Lee, J. W. Jeon & G. T. Yeo. (2015).
An Analysis on the Network Centrality of the Universities in IFEZ using the Social Network Analysis,
Korea International commercial review, 30(4)
, 23-49.[43] J. C. Kho, K. T. Cho & Y. H. Cho. (2013). A Study on Recent Research Trend in Management of Technology Using Keywords Network Analysis,