• 검색 결과가 없습니다.

Multi-temporal Remote Sensing Data Analysis using Principal Component Analysis

N/A
N/A
Protected

Academic year: 2021

Share "Multi-temporal Remote Sensing Data Analysis using Principal Component Analysis"

Copied!
10
0
0

로드 중.... (전체 텍스트 보기)

전체 글

(1)

Multi-temporal Remote Sensing Data Analysis using Principal Component Analysis

Jong-Chul Jeong 1

주성분분석을 이용한 다중시기 원격탐사 자료분석

정 종 철 1

ABSTRACT

The aim of the present study is to define and tentatively to interpret the distribution of polluted water released from Lake Sihwa into the Yellow Sea using Landsat TM. Since the region is an extreme Case 2 water, empirical algorithms for detecting concentration of chlorophyll-a and suspended sediments have limitations. This work focuses on the use of multi-temporal Landsat TM data. We applied PCA to detect evolution of spatial feature of polluted water after release from the lake Sihwa. The PCA results were compared with in situ data, such as chlorophyll-a, suspended sediments, Secchi disk depth(SDD), surface temperature, remote sensing reflectance at six channel of SeaWiFS. Also, the in situ remote sensing reflectance obtained by PRR-600(Profiling Reflectance Radiometer) was compared with PCA results of Landsat TM data sets to find good correlation between first Principal Component and Secchi disk depth(R 2 =0.7631), although other variables did not result in such a good correlation. Therefore, Problems in applying PCA techniques to multi-spectral remotely sensed data were also discussed in this paper.

KEYWORDS; PCA, Water Quality, Landsat TM

요 약

본 연구의 목적은 Landsat TM 자료를 이용하여 시화호로부터 황해로 방류되는 오염된 시화호 물의 방류범위를 해석하는 것이다. 본 연구지역은 Case 2 water에 속하는 지역이기 때문에 엽록소 와 부유사의 정량적인 해석을 위한 알고리듬을 적용하는데는 한계가 있다. 본 연구의 초점은 다중 시기의 Landsat TM 자료를 이용하는데 있다. 즉, 시화호로부터 방류되는 방류수의 공간적인 확산 범위를 관측하기 위해 주성분분석을 적용하였다. 주성분분석의 결과는 엽록소, 부유사, 투명도, 표 층수온, SeaWiFS 채널의 수중광학 측정결과인 반사치와 비교하였다. 그리고, PRR-600에 의해 얻 어진 수중 광학 반사치는 Landsat TM 자료에서 얻어진 주성분분석 결과와 함께 분석되었다. 이러 한 현장관측자료를 바탕으로 비록 다른 현장관측 측정변수가 낮은 상관관계를 나타냈음에도 불구

1999년 11월 16일 접수 Received on November 16, 1999

1

남서울대학교 지리정보공학과 Dept. of Geoinformatic Engineering, NamSeoul University

(2)

내었다. 또한 본 연구에서는 다중시기의 원격탐사자료를 사용하여 주성분분석을 할 때 나타나는 여러 문제를 토의하였다.

주요어: 주성분분석, 수질, Landsat TM

INTRODUCTION

Principal component analysis(PCA) can be used to simplify data structure of satellite multi-spectral images. The PCA is a method of redundancy reduction of multi-dimensional data in which the axis variables are orthogonal (Richards, 1990). PCA is an important data transformation technique used in remote sensing work with multi-spectral data or other multi-dimensional data. There have been many studies on the application of PCA to land use and land cover classification(Lu Jiaju, 1988;

Conese et al., 1988; Kramber et al., 1988;

Ceballos and Bottino, 1997), while PCA has not been commonly used for analysis of in-land water and coastal water quality.

For case 2 water, some authors have presented methods to obtain estimation of the concentration of SS, chlorophyll-a and organic material(Tassan, 1988; Tassan and d'Alcala ,1993)The most popular method is to derive a empirical regression equation between remote sensing reflectance and sea-truth data collected concurrently. Algorithms including a combination of channels have been presented by a number of authors(Hinton, 1991). Expecially, Tassan (1988) proposed band ratio and band difference algorithm for coastal water.

This work focuses on the use of multi-temporal in-situ remote sensing reflectance to which PCA is applied to detect evolution of spatial feature of polluted water after release from a polluted lake. Also, the problems

in applying PCA techniques to multi-spectral remote sensed data are also discussed.

STUDY AREA

The Lake Sihwa was constructed in January, 1994. The lake area was a typical coastal ocean environment before the construction. But, the lake has been polluted and changed in its ecological properties recently. Due to the polluted water inflow from Sihwa and Banwul, municipal and industrial region, Lake Sihwa has been highly eutrophicated since 1994. To mitigate the problem, the government decided to release the lake water into the adjacent sea since 1996.

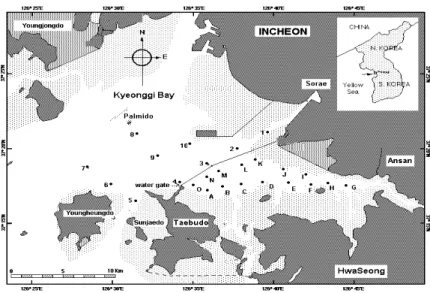
In this study, dispersion area of polluted water released from Lake Sihwa were estimated using Landsat TM data analysed with PCA technique. The in situ sea-truth data were collected in Lake Sihwa which have 15 sampling points and near coastal area, Kyunggi Bay which have 10 sampling points(Figure 1).

DATASET AND PROCESSING

The in-situ remote sensing reflectance from

PCA, were compared with in situ sea-truth

data, such as chlorophyll-a, suspended

sediments, Secchi disk depth and surface

temperature. In situ sea-truth data were

collected on June 1997, August 1997, October

1997 and April 1998. The in situ downwelling

(3)

FIGURE 1. Study area(Sampling points of Lake Sihwa are from A to O and sampling points of Kyungki bay are from 1 to 10)

Date Sun elevation (degree)

Tide height

(hh:mm) (m) Tide stage Tide measured

Mar. 28, 1997 46 07:36 0.82 flood tide Inchon

19:48 7.90

Jun. 16, 1997 63 07:11 2.94 flood tide Inchon

13:21 6.80 TABLE 1. Dataset specifications of Landsat TM irradiance and upwelling radiance were measured with PRR-600(Biospherical Co.) at 412, 443, 490, 510, 555 and 665 with 10 nm band width. Remote sensing reflectance(Rrs) were calculated with ratio of downwelling irradiance and upwelling radiance(Mitchell and Kahru, 1997).

In order to assess dispersion area, multi-spectral analysis was carried out with PCA method applied to two data sets of Landsat TM images(band 1, 2, 3, 4, 5, and 7) in two different seasons in the year of 1997.

Since June 1997, four times observed data of in-situ remote sensing reflectance showed that Rrs555 channel has the peak of spectrum and higher variance than other channels(Table 2).

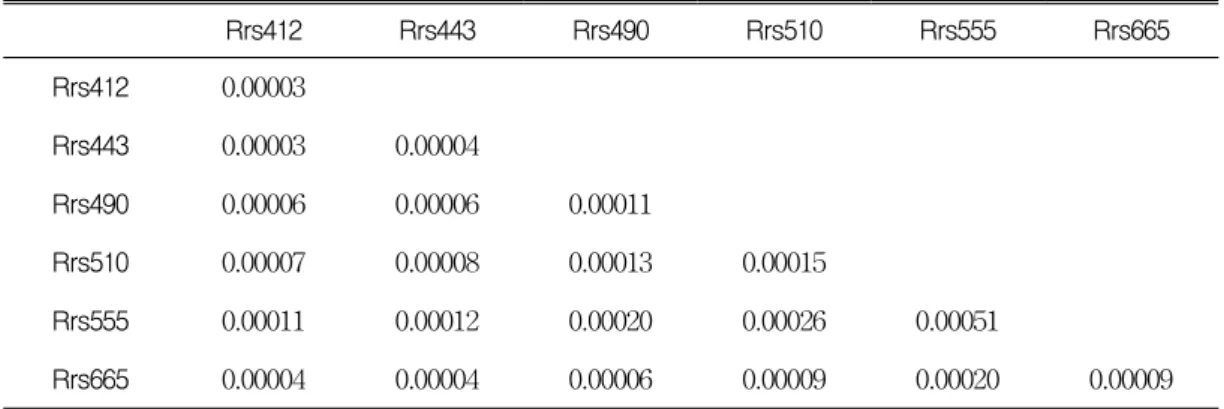
This means that the optical properties of suspended sediment(SS) are dominated with in-water components of this area. Colored dissolved organic matters(CDOM) also have the characteristics of strong absorption in shorter wavelength. Then Rrs412 and Rrs443 have the lower covariance values with Rrs555 (Table 3).

Significant correlations among three

(4)

Rrs412 Rrs443 Rrs490 Rrs510 Rrs555 Rrs665 Rrs412 0.00003

Rrs443 0.00003 0.00004

Rrs490 0.00006 0.00006 0.00011

Rrs510 0.00007 0.00008 0.00013 0.00015

Rrs555 0.00011 0.00012 0.00020 0.00026 0.00051

Rrs665 0.00004 0.00004 0.00006 0.00009 0.00020 0.00009

TABLE 3. Covariance matrix of in-situ remote sensing reflectance

Rrs412 Rrs443 Rrs490 Rrs510 Rrs555 Rrs665

Average 0.00381 0.00431 0.00740 0.00959 0.02086 0.00814

S.D 0.00585 0.00667 0.01063 0.01270 0.0229 0.00977

Variance 0.00003 0.00004 0.00011 0.00016 0.00052 0.00009

Rrs412 Rrs443 Rrs490 Rrs510 Rrs555 Rrs665

Rrs412 1.00000

Rrs443 0.98905 1.00000

Rrs490 0.97999 0.98844 1.00000

Rrs510 0.96791 0.96384 0.99077 1.00000

Rrs555 0.85531 0.80300 0.85771 0.91430 1.00000

Rrs665 0.71143 0.62826 0.68185 0.74826 0.91376 1.00000

TABLE 4. Correlation matrix of in-situ remote sensing reflectance channels were found for Rrs412, Rrs443, and

Rrs490(maximum r=0.99077) in Table 4. In the covariance matrix of in-situ remote sensing reflectance, Rrs510 and Rrs555 are of high value.

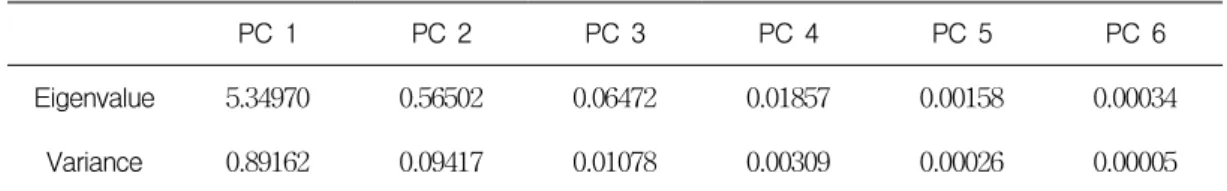
For all datasets, at least approximately 89

percent of the total variance was explained by

the first eigenvector. Eigenvalues and

percentage variance explained by each vector

are presented in Table 5. It is interesting to

note that the first eigenvector takes the greatest

portion of the total variance.

(5)

0 0.02 0.04 0.06 0.08 0.1 0.12

400 450 500 550 600 650 700

w av e le n gth (n m)

ref lecta n c e

FIGURE. 2. Reflectance curves in study area

-1 -0.8 -0.6 -0.4 -0.2 0 0.2 0.4 0.6 0.8 1

400 450 500 550 600 650 700

w av elength (nm)

Facto r

PC 1 PC 2 PC 3 PC 4 PC 5 PC 6

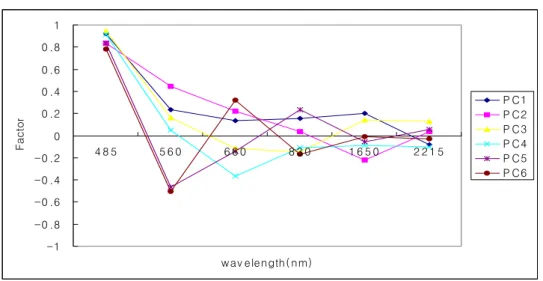
FIGURE. 3. Factor loading of the six eigenvector obtained by PRR-600

PC 1 PC 2 PC 3 PC 4 PC 5 PC 6

Eigenvalue 5.34970 0.56502 0.06472 0.01857 0.00158 0.00034

Variance 0.89162 0.09417 0.01078 0.00309 0.00026 0.00005

TABLE 5. Eigenvalue and variance of the PCA computed on the in-situ remote sensing reflectance

An eigenvector analysis has been done on the reflectance curves in Figure 2. In this figure we found that Lake Sihwa and near coastal belong to case 2 water which is dominated by CDOM. It has a low reflectance value in 400 -

500 nm. The variance of eigenvector loadings

for each principal component(PC) in Table 5

and Figure 2 suggested that in-situ remote

sensing reflectance was predominantly affected

by CDOM in this study area.

(6)

-0.014 -0.012 -0.01 -0.008 -0.006 -0.004 -0.002 0 0.002

0 0.05 0.1 0.15 0.2 0.25

PC 1

PC 2

Apr 98 sihwa

Jun 97, Apr 98 Kyung Jun 97,

Aug 97, Oct 97, sihwa

st4

A

H I ST6 C B ST5

ST8 L M E D ST2

I ST3 A ST2

ST4-1 B

G ST9

FIGURE 4. Plot of the relationship bewteen PC 1 and PC 2

y = 5.4152x + 0.3103 R

2

= 0.7631

0 0.2 0.4 0.6 0.8 1 1.2 1.4 1.6 1.8

0 0.05 0.1 0.15 0.2 0.25

pc 1

SDD

FIGURE 5. Plot of the relationship bewteen PC 1 and Secchi depth and 443 nm bands which was decreased in

reflectance in Figure 2. The greatest factor loadings occur at the shorter wavelength. Since 412 nm band has been more effected by CDOM and 443 nm band by chlorophyll, it is not difficult to distinguish the effect of chlorophyll-a and CDOM at these wavelengths. When chlorophyll concentration are low, the effect of CDOM dominated in these bands.

Because the factor scores indicate the

relative dominance of each variable at each

station, the aim of PCA is to summarise the

optical characteristics of the coastal water and

Lake Sihwa water. When the stations are

ordinated in the PC 1 and PC 2, space has

ordination which can be interpreted to be

related to the water quality. In the Figure 4,

(7)

PC 1 PC 2 PC 3 PC 4 PC 5 PC 6

Eigenvalue 4.6062 0.7548 0.3393 0.1400 0.1200 0.0388

Variance 0.7677 0.1258 0.0565 0.0233 0.0201 0.0064

TABLE 6. Eigenvalue and variance of the PCA computed on the TM image in March and June 1997

-1 -0 .8 -0 .6 -0 .4 -0 .2 0 0 .2 0 .4 0 .6 0 .8 1

4 8 5 5 6 0 6 6 0 8 3 0 1 6 5 0 2 2 1 5

wav elength( nm)

Facto r

P C1 P C2 P C3 P C4 P C5 P C6

FIGURE 6. Factor loading of the six eigenvector with wavelength(TM bands) Lake Sihwa station in June 1997, August 1997

and October 1997 were relatively more polluted, while Lake Sihwa station in April 1997 were less polluted after continuous release.

PC 1 is highly correlated with Secchi disk depth(SDD) in Lake Sihwa and coastal area(R 2 =0.7631). To be sure, SDD is a visual measure of the clarity of the water. In this study area CDOM is the most important water quality parameter for the assessment of dispersion area, however, CDOM was not measured. Therefore, SDD was used as an indicator.

Now, the same technique was applied to remotely sensed data, Landsat TM in June 1997. In order to assess the dispersion area of

polluted water released from Lake Sihwa, Landsat TM image was analysed with PCA. The in-situ remote sensing reflectance was highly correlated with SDD, while remotely sensed data did not(R 2 =0.6476).

Each sampling point was distributed in the plot of PC 1 and PC 2 with a linear trend from station 9 to station E(Figure 7). They are ordinated from high transparency to low transparency. This sequence roughly corresponds to decreasing water quality. The scores of PC 1 were plotted with Secchi depth collected in 25 sampling points(Figure 8). They were analyzed with Pearson product moment correlation (r=

-0.805) and Spearman rank order correlation

(r=-0.845). A similar relationship between SDD

(8)

0 10 20 30 40 50 60 70

170 180 190 200 210 220 230

PC 1

PC 2

S9 E H

F I G

S7 O S3

D

S1 K

L

C S10

S2 AB S6 N

M S4 S5

High transperency Low transpaarency

FIGURE 7. Plot of the relationship between PC 1 and PC 2

y = -0.0701x + 15.497 R

2

= 0.6476

0 1 2 3 4 5 6

170 180 190 200 210 220 230

PC 1 score

SDD ( m )

FIGURE 8. Relationship of the PC1 and Secchi depth

and PC 1 scores from remotely sensed data obtained in June 1997. However, Landsat TM has six wavelength bands in difference band position and width: blue, green, red and IR bands. Especially, band 1 and band 2 are blue-green and yellow-green bands.

The variance explained by PC 1 of remotely

sensed data using TM is 76 percent. The band 1 of TM is 450 - 520 nm. Therefore, this band is less effected by CDOM than chlorophyll.

Although in-situ based studies have produced

some primary results in applying PCA for water

quality, there are difficulties in applying the

technique to the remotely sensed data. Landsat

(9)

TM data are contaminated with atmospheric noises such as Rayleigh and Mie scattering.

We could find the positive correlation between PC 1 and SDD in Figure 5, while there were the negative correlation between PC1 and SDD in Figure 8. CDOM has highly absorption at 412 nm and 443 nm bands which are SeaWiFS bands. In the PCA results of in-situ remote sensing reflectance, PC 1 scores are increasing, as SDD are increasing. Since SDD are effected by CDOM, PC 1 scores and SDD are relatively positive correlation.

At PCA results of Landsat TM, however, PC 1 were loaded with SS dominated bands, band 1(450-520 nm) and TM band 2(520-600 nm), then increasing of PC 1 scores mean increasing the concentration of SS. Since increased SS has effected the decreasing of SDD, PC1 and SDD are negative correlation at Figure 8. In this results, we could find SeaWiFS bands are more effective detecting of CDOM than Landsat TM bands. Therefore, SeaWiFS data processing at coastal water will provide more information about water quality.

CONCLUSION

PCA was suggested as a method for detecting dispersion area of polluted water.

When the PC 1 was compared with SDD, they are highly correlated although other variables did not result in such a good correlation. The PC 1 obtained by in-situ remote sensing reflectance was useful for detection of water quality from the water body where CDOM dominated.

On the other hand, TM has the different band width from PRR-600, and band 1 of TM does not include 412 nm and 443 nm bands.

Atmospheric noises which were not corrected in this study might add further errors. Therefore, it is maybe less effective to detect water quality where CDOM dominates. In spite of such limitations, PCA results of Landsat TM data provided an Pearson product moment correlation(r=-0.805) and Spearman rank order correlation(r=-0.845) between PC 1 and SDD.

REFERENCE

Ceballos, J.C. and M.J.Bottino. 1997. The discrimination of scenes by principal components analysis of multi-spectral imagery.

Int. J. Remote Sensing 18(11):2437-2449.

Conese, C., G. Maracchi, F. Miglietta and F. Maselli. 1988. Forest classification by principal component analyses of TM data.

Int. J. Remote Sensing 12(1):1597-1612.

Hinton, J.C. 1991. Application of eigenvector analysis to remote sensing of coastal water quality. Int. J. Remote Sensing. 2(7):1441-1460.

Kramber, W.J., A.J. Richardson, P.R. Nixon and K. Lulla. 1988. Principal component analysis video imagery. Int. J. Remote Sensing 9(9):1415-1422.

Lu Jaiju. 1988. Development of principal component analysis applied to multitemporal Landsat TM data. Int. J. Remote Sensing 9(2):1895-1907.

Mitchell, B.G. and M. Kahru. 1997.

Algorithms for SeaWiFS standard products developed with the CalCOFI bio-optical data set. SEABAM report. pp.343-356.

Richards, J.A. 1990, Thematic mapping from

multitemporal image data using the principal

components transformation. Remote Sensing

of Environment 16:35-46.

(10)

'yellow substance' on the quantitative retrieval of chlorophyll and total suspended sediment concentration from remote measurements of water colour. Int. J.

Remote Sensing 4:787-797.

monitoring by thematic mapper in coastal

environments-A performance analysis of local

biooptical algorithm and atmospheric

correction procedures. Remote Sensing of

Environment 45:177-191.

수치

FIGURE  1.  Study  area(Sampling  points  of  Lake  Sihwa  are  from  A  to  O  and  sampling  points  of    Kyungki  bay  are  from  1  to  10)
TABLE  4.  Correlation  matrix  of  in-situ  remote  sensing  reflectancechannels  were  found  for  Rrs412,  Rrs443,  and
TABLE  5.  Eigenvalue  and  variance  of  the  PCA  computed  on  the  in-situ  remote  sensing  reflectance
FIGURE  6.  Factor  loading  of  the  six  eigenvector  with  wavelength(TM  bands)Lake  Sihwa  station  in  June  1997,  August  1997

참조

관련 문서

Finally this thesis provides an pragmatic analysis of the as constructions, which argues that the emergence of functional marking of as is attributable

본 논문에 나타낸 3차원 콘볼루션 신경회로망을 이용한 인식 결과를 기존 얼굴 인식방법들인 주성분분석기법(PCA: Principal Component Analysis) 와 2차원

It is possible to control the welding residual stress and deformation through the finite element analysis using jig free in-situ control technique of welding induced out

12) S. Park, “A Review on Monitoring Mt. Baekdu Volcano Using Space-based Remote Sensing Observations”, Special Issue on Earthquake and Volcano Research using Remote Sensing

In this study, the existing material of the air conditioner compressor and Al6061 material were applied through structural analysis and fluid-structure coupling analysis using

This study makes use of statistical method in estimating the spread of oil supply disruption, which will be the starting point of analysis on oil

This research is to conduct comparative analysis on the rain intensity of expected rainfall depth of the research-use X-band dual-polarimetric radar with that of actually

The purpose of this study is to define the concept of affordance in multi-media environment and to seek development plan of more efficient interface