INTRODUCTION
Golf is a game that involves using various clubs to stroke the ball continuously and finally to the hole. Such golf stroke techniques can be divided into driving strokes and putting strokes from a kinematic point of view. The difference between the two strokes is that the driving stroke is long, while the ball travels from the ground and travels in the air, whereas the putting stroke is long when the ball moves in contact with the ground. Therefore, the driving stroke requires much research on the influence of air or fluid in the process of ball movement, but the phenomenon that occurs in contact with the ground is extremely weak. On the other hand, the putting stroke is more influenced by the condition or slope of the green than by the influence of the fluid.
Therefore, the direction of interest is also the state of the ground on which the ball is moving, i.e., the length of the grass, the trace of the ground, and the existence of slope (Pelz & Frank, 2000). For this reason, Cochran & Stobbs (1968), who studied various aspects of golf, explains that analyzing balls across the green is a very difficult task.
Putting strokes account for about 40% to 45% of all strokes (Palmer
& Dobereiner, 1986; Heuler, 1995; Park, 2000; Pelz & Frank, 2000).
According to Alexander & Kern (2005), the analysis of the contents of the professional golf association (PGA) in the United States revealed that the putting stroke ability is the first factor to get the most prize money. The technical part of the putting stroke which has a great in- fluence on the golf performance is rather simply explained (Park, 2002).
In Sim & Kim (2010), the most ideal putting stroke is to stroke into the hole by giving the required speed in the intended direction to the ball.
They looked at the important kinematics in putting in direction and velocity. And if it does not, it will stroke at a speed close to the hole and end the hole with the next pitch (Sayers, Stuelcken & Gorman, 2017). In other words, the two things required in the putting technique are the accuracy of the direction and the appropriateness of the speed.
Regarding the proper speed, Holmes (1991) reported in computer modeling studies that the ball holdable speed is less than 1.6 m/s at the edge of hole. If this speed is exceeded, the rim of the hole will bounce off the ball rather than drop it down. This is the case when the
KJSB
http://e-kjsb.org eISSN 2093-9752ORIGINAL
A Study on the Goal Setting Method for Increasing the Holed Probability in Slope Putting Stroke on an
Artificial Putting Surface
Jin Park
1, Ji Hyeon Kim
2, Jong Min Jung
21
Department of Human Movement Science, College of Social Sciences, Seoul Women's University, Seoul, South Korea
2
Biomechnics Laboratory, Korea Institute of Sport Science, Seoul, South Korea
Received : 10 November 2017 Revised : 04 January 2018 Accepted : 04 January 2018
Corresponding Author
Jong Min JungDepartment of Sports Science, Sports Biomechanics Laboratory, Korea Institute of Sport Science, 727 Hwarang-ro, Nowon-gu, 01794, South Korea
Tel : +82-10-4656-9601 Fax : +82-2-970-9686 Email : [email protected]
Objective: The purpose of this study was to develop a goal setting method for increasing the probability
of a holed in a side inclined putting stroke.
Method: Three-dimensional video data was recorded at a frequency of 120 hz per second after synchronizing
19 infrared motion capture systems (Qualisys, Gothenburg, Sweden). Putting green used a polycarbonate plate (1.2 x 2.4 x 0.01 meter) with coefficient of friction (μ=0.062) and a real curve of the actual hole.
Results: The velocity ratio between the club and the ball was 1:1.6 under various ball speed conditions in
this study. The overall position of the break is 1 m to 1.4 m from the point where the ball leaves. If there is a slope, the ball follows the target line by the straightening force, and when it reaches 1 m position, the straightening force decreases by 30~50% and reaches to the deviation (break) point which is severely influenced by the slope. From here, the ball is aimed in a direction other than the target, and the size is affected by the slope.
Conclusion: If there is a side slope, the ball moves away from the straight line, and the larger the slope,
the closer the break point is to the starting point of the ball. Therefore, it is necessary to calculate the degree of departure according to the slope carefully, and it is preferable that the slower the speed is, the more the influence of the slope becomes. It is preferable to use the center of the hole as a reference when calculating the departure.
Keywords: Putting stroke, Holed, Slope, Goal setting, Golf
270 Jin Park, et al.
KJSB
ball is pointing toward the center of the hole, and if it goes into the hole cup by moving the center, the velocity of the ball must be smaller before it can be held.
According to Pelz & Frank (2000), the success rate of 1.8-meter putting is about 43~57% even if it is a professional golfer who is world-class.
However, if they are aware of the terrain, the success rate at the same distance can rise to 90%. In addition, according to an Internet golf putting material (Golfdatalab, 2017), we analyzed the putting score by distance in the PGA tour. For example, if you are at 0.9 m, it is 1.0008 strokes, and if you are at 1.8 m, it is 1.363 strokes. In other words, it can be concluded that as the distance increases, the shape of the ground influences the putting. Karlsen, Smith & Nilsson (2008) suggested that the factors affecting the direction of the ball were green reading, goal setting, stroke, and green irregularity. Of these four elements, three except for the stroke are related to the shape or slope of the green surface. These factors also affect the direction of the ball regardless of the stroke performance of the athlete. Before putting, the players will observe the ground and draw a line of putt where the ball will go. In this case, consideration is given to the length of the grass (friction) and the slope of the ground. The length of the grass and the speed of the green are measured using stimpmeter provided by Stimpson (1974) before the game. However, the slope of the green varies depending on the position of the hole, and the shape of the green is not the same as all the holes from the time of designing the golf course. Therefore, it is not easy to grasp the ground conditions around the hole, and research on how the balls move according to the degree of inclination is very insufficient.
Pelz & Frank (2000) are pioneers in the scientific study of how the ball changes when there is a slope on the green. They describe the change in the position of the ball in the side slope in terms of "break".
The break that a researcher is talking about is the distance, which means the deviation between the end point of the target line and the center of the hole, or the width (distance) from the imaginary parabolic tangent line to the target line. However, the contents of this study are not described in academic books but in the form of figures or tables in their own books. Park (2014) presented the theoretical conditions for the holed when the starting and ending points made the putting stroke on the same side slope. For example, if the ball at 1 m/s goes 1 meter from the side slope, the size of the break at the end point is 8.6 cm, and if the ball at 2 m/s travels 2 meters from the 2 degree side slope, the size of the break at the end point is 17.1 cm, respectively. Theo- retically, the center of the hole is preferably shifted to the left or to the right according to a sloping direction of 8.6 cm for a 1 meter putt and 17.1 cm for a 2 meter putt. However, this study also shows that the theoretical result is that there is no friction from the ball to the hole and there is a limit to applying the same angle side slope to realistic greens. Therefore, for a more realistic study, it is necessary to set the green condition similar to the actual green form and to see how the ball's movement changes. If we do, we think that it will be possible to provide the players who perform the actual golf game about the move- ment of the ball in the putting stroke. Therefore, the purpose of this study relates to a goal setting method for increasing the probability of a holed at a various inclined putting stroke. So the slopes of the ground
were divided into three levels: balance, low side slope, and high side slope. And the ball has four kinds of speed that can be held in the hole.
The faster the speed of the ball, the less likely it will be affected by the slope. However, if the speed is slowed down, the slope will affect it more, and the 'flowing' phenomenon of the ball will appear.
METHODS 1. Procedure
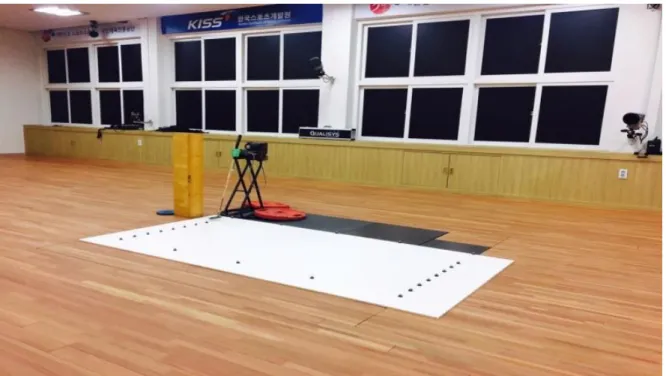
All studies were conducted in a biomechanics laboratory at the Korea Institute of Sport Science (KISS). Three-dimensional video data was recorded at a frequency of 120 hz per second after synchronizing 19 infrared motion capture systems (Qualisys, Gothenburg, Sweden).
Putting green used a polycarbonate plate (1.2 × 2.4 × 0.01 meter)
with coefficient of rolling friction (μ=0.062) and a real curve of the
actual green (Figure 1 & 2). The rolling friction coefficient was calculated
using the difference between the initial velocity (50 cm) and the final
velocity (100 cm) and the time taken. The putter was a Ping putter and
attached a reflection marker at 4 cm horizontal from the sweet spot
to the toe in order to know the movement of the head. The ball was
attached to the entire surface with a reflective tape with a Titleist Pro
v1. To transfer the momentum to the ball, a pendulum putting machine
(PPM) was used (Park, 2006). The machine weighs about 100 N and is
75 cm high. The distance (radius) to the point at which the impact
occurs at the fixed part where the putter can be caught is 76 cm. The
PPM was fixed on the ground with additional weight so that the putter
did not move in the collision with the ball. The putter was manually
operated and allowed to hit the ball at the lowest point of free fall. In
order to make the slopes of the artificial green with the polycarbonate
plate, 2.5 cm diameter iron ball for a low slope (LS) green and 4.3 cm
diameter golf ball for a high slope (HS) green were, respectively, placed
underneath the polycarbonate plate at the position of -18 cm posteriorly
and 150 cm laterally from the origin. The T-shaped wooden pillar (1 m
tall) is installed in the backswing area of the pendulum putter to prevent
the club head from moving beyond the predetermined section. Bosch's
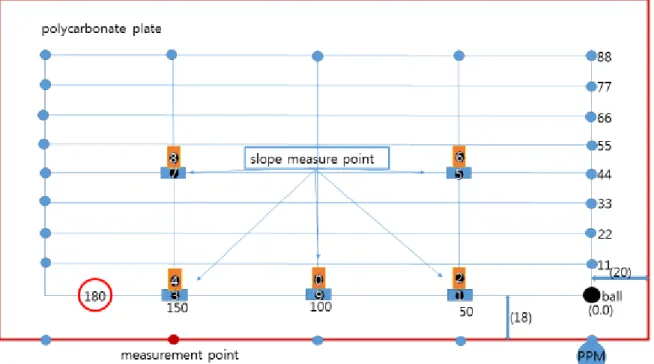
GLM500 (Figure 3) is a device that measures the slope of the ground
(10 positions), and the angle of the slope to the first decimal place is
known (Figure 4). The coordinates of the experiment site are the y-axis
in the direction of travel of the ball, the x-axis in the side-slope direction,
and the z-axis in the vertical direction. The origin of the ball movement
was set at 18 cm in the x-axis and 20 cm in the y-axis at the end of
the plate. Each marker was attached to every 11 cm of x axis and every
50 cm of y axis, so that a virtual grid plate (88 × 200 cm) could be
made to grasp the position of the ball (Figure 4). The slope degree of
the 10 points determined by the researcher was measured and recorded
by the GLM500 (Table 1). Before experiment, the pendulum putter was
controlled several times after confirming whether the ball moved to
the target (hypothetical hole) set by the researcher. In the first experi-
ment, the poly plate was made flat and the wooden pillar was moved
20 cm horizontally behind the impact point. The researcher moves the
club back and then releases it to let the club fall freely. After 5 repetition
experiments at the same point, the wooden pillar was moved 25 cm
position and same process of experiment was repeated. After that, the wooden pillar was moved 30 cm and 35 cm and same experiment was repeated. The second experiment was a low slope, placing the iron ball at the bottom of coordinate (-18 cm, 150 cm) from the origin. Then, the slope was measured and recorded. Table 1 shows that odd numbers are anteroposterior directions and even numbers are lateral directions.
And then the experiment was repeated in the same manner as the first experiment. The third experiment was carried out in the same way except that the golf ball was placed instead of iron ball for a high slope.
In the case of low slope, the direction of the ball was 0.7 degree up, and the side was 3.1 degree slope. On the other hand, in the case of
high slope, the direction of the ball was 1.6 degree up and the side was 4.7 degree slope.
Figure 1. Experimental conditions with a pendulum putting machine and a wooden plate
Figure 2. Slope change with golf ball
Figure 3. Slope checking machine (GLM 500)
272 Jin Park, et al.
KJSB
2. Data processing
Performed trials were imported into Qualisys motion capture system (Gothenburg, Sweden) for further processing and analyzing the data.
The raw coordinates of ball and club head were filtered using Butter- worth low-pass filter with 6 hz cut-off frequencies (Winter, 1990). The club's data were collected from the beginning of the move to 20 frames after impact. The data of the ball was collected from the stationary position to the target direction 2 meters. The data of ball compared the displacements and velocities on the y and x axes, which appear in flat, low slope and high slope. The comparison point is 7~14 cm (where the maximum velocity appears in the y-axis direction), 50 cm and 100 cm. After passing 100 cm, it was analyzed up to 180 cm in 10 cm incre- ments. Time interval between frames is 0.00833s and the time interval of finite difference method (Robertson, Caldwell, Hamil, Karmen &
Wittlesey, 2004) is 0.0167s.
3. Statistical analysis
The internal consistency reliability for repeated experiments (flat, low
slope, high slope) is presented in Cronbach's α (Appendix 1). The y-axis velocity and the x-axis velocity at the maximum velocity of 6 to 14 cm and 50 cm, 100 cm, 110 cm, 120 cm, 130 cm, 140 cm, 150 cm, 160 cm, 170 cm and 180 cm were calculated by finite difference method (Robertson, Caldwell, Hamill, Kamen & Whittlesey, 2004). The statistical significant position (break point) of the ball was confirmed by one-way ANOVA (Appendix 2). When there was an average difference between the groups, Scheffe's post-hoc test was performed. All statistical signifi- cance was .05.
RESULTS
The club's maximum velocity is 0.72(±0.002)m/s when the club is allowed to fall freely 20 cm backwards and the maximum velocity of the ball is 1.16(±0.05)m/s. The maximum velocity of the club when it is allowed to fall back 25 cm backward is 0.96(±0.001)m/s and the maximum velocity of the ball is 1.46(±0.05)m/s. When the club is freely dropped 30 cm backwards, the club's maximum velocity is 1.08(±0.002) m/s and the ball's maximum velocity is 1.77(±0.03)m/s. The club's maxi- mum velocity is 1.32(±0.002)m/s when the club is free to fall back 35 cm
Table 1. Angle of each measurement point of poly plate
unit: degrees
MP 1 2 3 4 5 6 7 8 9 0
F 0.1 0.1 0.1 0.1 0.0 0.0 0.0 0.0 0.1 0.1
LS 0.3 0.1 0.5 3.1 0.1 0.0 0.1 0.1 0.7 1.4
HS 0.8 0.5 0.2 4.7 0.1 0.1 0.0 0.7 1.6 2.6
MP: measurement point, F: flat, LS: low slope, HS: high slope
Figure 4. Measurement point and ten angle check positionsbackwards and the maximum velocity of the ball is 2.17(±0.01)m/s.
1. Velocity ratio of club to ball
Table 2 shows the magnitude and ratio of velocity of the club and ball at the impact point according to the free-fall distance of the club.
2. Velocity of the ball with the free fall distance of the putter
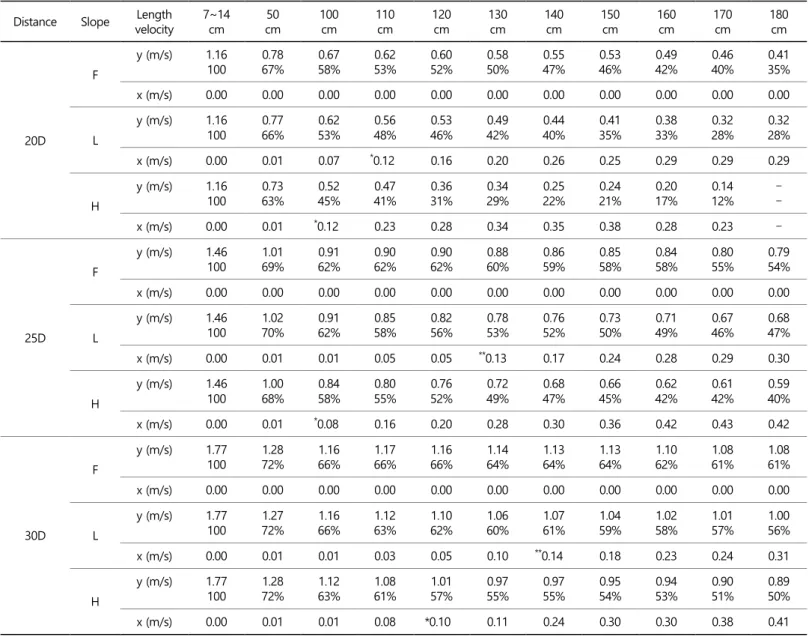
Table 3 shows the ratio of the y-axis velocity to the y-axis maximum velocity at each point along the free-fall distance of the club and the x-axis velocity.
Table 2. Characteristics of the ratio of impact velocity of the pendulum putting machine to the departure velocity of the ball
Club head distance Club head velocity Ball maximum velocity Club vs ball ratio
20D 0.72 m/s 1.16 m/s 1:1.6
25D 0.96 m/s 1.46 m/s 1:1.5
30D 1.08 m/s 1.77 m/s 1:1.6
35D 1.32 m/s 2.17 m/s 1:1.6
20D: club head moved 20 cm and freely dropped, 25D: club head moved 25 cm and freely dropped, 30D: club head moved 30 cm and freely dropped, 35D: club head moved 35 cm and freely dropped
Table 3. The velocity of the ball (y and x axes) with the free fall distance of the putter
Distance Slope Length
velocity 7~14
cm 50
cm 100
cm 110
cm 120
cm 130
cm 140
cm 150
cm 160
cm 170
cm 180
cm
20D
F
y (m/s) 1.16
100 0.78
67% 0.67
58% 0.62
53% 0.60
52% 0.58
50% 0.55
47% 0.53
46% 0.49
42% 0.46
40% 0.41 35%
x (m/s) 0.00 0.00 0.00 0.00 0.00 0.00 0.00 0.00 0.00 0.00 0.00
L
y (m/s) 1.16
100 0.77
66% 0.62
53% 0.56
48% 0.53
46% 0.49
42% 0.44
40% 0.41
35% 0.38
33% 0.32
28% 0.32 28%
x (m/s) 0.00 0.01 0.07
*0.12 0.16 0.20 0.26 0.25 0.29 0.29 0.29
H
y (m/s) 1.16
100 0.73
63% 0.52
45% 0.47
41% 0.36
31% 0.34
29% 0.25
22% 0.24
21% 0.20
17% 0.14 12%
- -
x (m/s) 0.00 0.01
*0.12 0.23 0.28 0.34 0.35 0.38 0.28 0.23 -
25D
F
y (m/s) 1.46
100 1.01
69% 0.91
62% 0.90
62% 0.90
62% 0.88
60% 0.86
59% 0.85
58% 0.84
58% 0.80
55% 0.79 54%
x (m/s) 0.00 0.00 0.00 0.00 0.00 0.00 0.00 0.00 0.00 0.00 0.00
L
y (m/s) 1.46
100 1.02
70% 0.91
62% 0.85
58% 0.82
56% 0.78
53% 0.76
52% 0.73
50% 0.71
49% 0.67
46% 0.68 47%
x (m/s) 0.00 0.01 0.01 0.05 0.05
**0.13 0.17 0.24 0.28 0.29 0.30
H
y (m/s) 1.46
100 1.00
68% 0.84
58% 0.80
55% 0.76
52% 0.72
49% 0.68
47% 0.66
45% 0.62
42% 0.61
42% 0.59 40%
x (m/s) 0.00 0.01
*0.08 0.16 0.20 0.28 0.30 0.36 0.42 0.43 0.42
30D
F
y (m/s) 1.77
100 1.28
72% 1.16
66% 1.17
66% 1.16
66% 1.14
64% 1.13
64% 1.13
64% 1.10
62% 1.08
61% 1.08 61%
x (m/s) 0.00 0.00 0.00 0.00 0.00 0.00 0.00 0.00 0.00 0.00 0.00
L
y (m/s) 1.77
100 1.27
72% 1.16
66% 1.12
63% 1.10
62% 1.06
60% 1.07
61% 1.04
59% 1.02
58% 1.01
57% 1.00 56%
x (m/s) 0.00 0.01 0.01 0.03 0.05 0.10
**0.14 0.18 0.23 0.24 0.31
H
y (m/s) 1.77
100 1.28
72% 1.12
63% 1.08
61% 1.01
57% 0.97
55% 0.97
55% 0.95
54% 0.94
53% 0.90
51% 0.89 50%
x (m/s) 0.00 0.01 0.01 0.08 *0.10 0.11 0.24 0.30 0.30 0.38 0.41
274 Jin Park, et al.
KJSB
3. Displacement displaced in the x-axis direction and the y-axis direction velocity
The displacement along the x-axis direction along the free-fall dis- tance of the club and the y-axis velocity at that time are shown in Table 4.
DISCUSSION
One of the most important factors in the putting game is the speed of the green. To measure this, Stimpson (1974) proposed a tool to measure the ball's rolling speed constantly. It was named as 'Stimpmeter'.
Holmes (1991) measured the velocity of the ball when leaving the tool
at 1.83 m/s. The speed of the golf green is so varied that the ball rolls up to 3.66 meters for fast greens and 1.22 meters for slow greens.
Penner (2002) reported that the coefficient of friction of the ball in this situation was 0.196 to 0.065. It is recommended to use 0.131, which is the average coefficient of friction, under normal circumstances. In this study, the coefficient of friction was measured to be 0.062 using four kinds of speeds in the flat area. Therefore, the coefficient of friction of the poly plate in this study is the same as that of the experiment with very fast putting green. One of the important issues in the study of equipment games (golf, baseball, table tennis, etc.) is whether balls and tools impact on sweet spots. In this study, it was controlled that the pendulum putting machine and the ball were contacted in the state of being fitted to the sweet spot, so that repeated impacts occurred
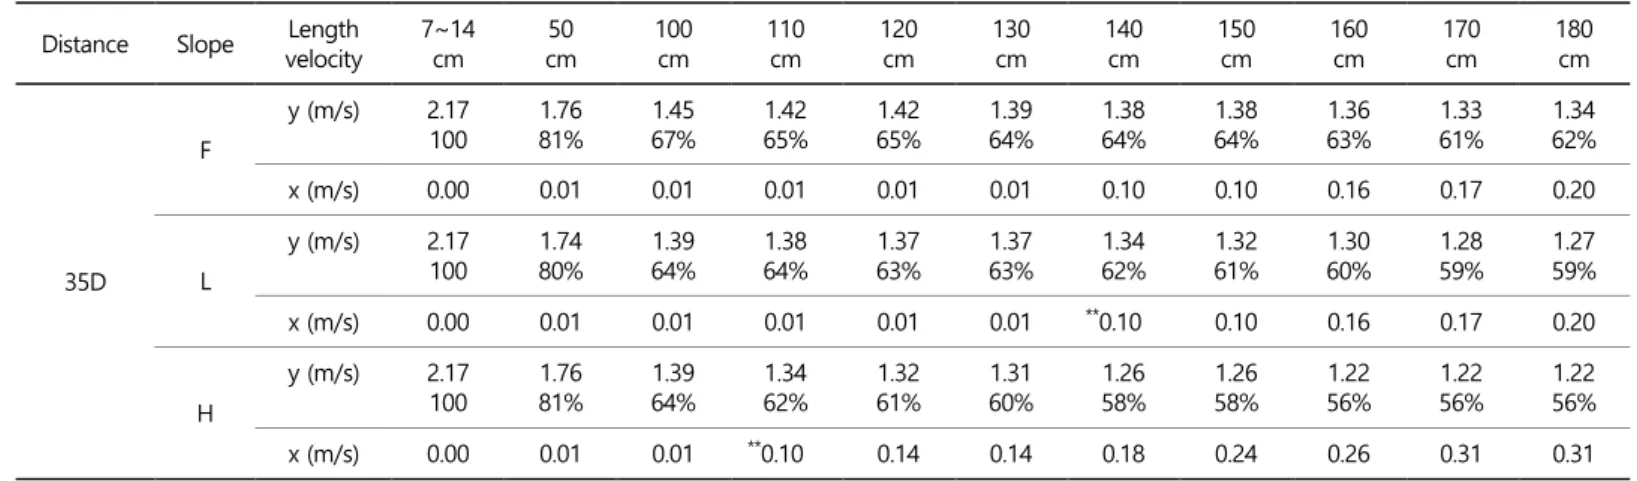
Table 3. The velocity of the ball (y and x axes) with the free fall distance of the putter (Continued)Distance Slope Length
velocity 7~14
cm 50
cm 100
cm 110
cm 120
cm 130
cm 140
cm 150
cm 160
cm 170
cm 180
cm
35D
F
y (m/s) 2.17
100 1.76
81% 1.45
67% 1.42
65% 1.42
65% 1.39
64% 1.38
64% 1.38
64% 1.36
63% 1.33
61% 1.34 62%
x (m/s) 0.00 0.01 0.01 0.01 0.01 0.01 0.10 0.10 0.16 0.17 0.20
L
y (m/s) 2.17
100 1.74
80% 1.39
64% 1.38
64% 1.37
63% 1.37
63% 1.34
62% 1.32
61% 1.30
60% 1.28
59% 1.27 59%
x (m/s) 0.00 0.01 0.01 0.01 0.01 0.01
**0.10 0.10 0.16 0.17 0.20
H
y (m/s) 2.17
100 1.76
81% 1.39
64% 1.34
62% 1.32
61% 1.31
60% 1.26
58% 1.26
58% 1.22
56% 1.22
56% 1.22 56%
x (m/s) 0.00 0.01 0.01
**0.10 0.14 0.14 0.18 0.24 0.26 0.31 0.31
20D: club head moved 20 cm and freely dropped, 25D: club head moved 25 cm and freely dropped, 30D: club head moved 30 cm and freely dropped, 35D: club head moved 35cm and freely dropped, F: flat green, L: green with Low slope, H: green with High slope, * <.05, ** <.01
Table 4. The displacement deviating from the x-axis direction at each point and y-axis direction velocity
Distance y Length 7~14
cm 50
cm 100
cm 110
cm 120
cm 130
cm 140
cm 150
cm 160
cm 170
cm 180
cm
20D
L x (cm)
y (m/s) 0.01
(1.16) 0.1
(0.77) 1.6
(0.62) 2.3
(0.56) 4.1
(0.53) 6.3
(0.49) 9.4
(0.44) 13.1
(0.41) 17.8
(0.38) 23.0
(0.32) 28.6 (0.32) H x (cm)
y (m/s) 0.01
(1.16) 0.4
(0.73) 3.0
(0.52) 6.0
(0.47) 11.1
(0.36) 19.0
(0.34) 30.7
(0.25) 44.2
(0.24) 58.6
(0.20) 73.8 (0.14) -
-
25D
L x (cm)
y (m/s) 0.01
(1.46) 0.01
(1.02) 1.2
(0.91) 2.1
(0.85) 3.2
(0.82) 4.8
(0.78) 6.9
(0.76) 9.6
(0.73) 12.9
(0.71) 16.9
(0.67) 21.3 (0.68)
H x (cm)
y (m/s) 0.01
(1.46) 0.2
(1.00) 3.6
(0.84) 5.4
(0.80) 7.8
(0.76) 10.9
(0.72) 15.3
(0.68) 20.5
(0.66) 26.5
(0.62) 33.5
(0.61) 40.7 (0.59)
30D
L x (cm)
y (m/s) 0.01
(1.77) 0.4
(1.27) 1.8
(1.16) 2.4
(1.12) 3.3
(1.10) 4.4
(1.06) 5.8
(1.07) 7.4
(1.04) 9.5
(1.02) 12.0
(1.01) 14.7 (1.00)
H x (cm)
y (m/s) 0.01
(1.77) 0.2
(1.28) 1.8
(1.12) 2.8
(1.08) 4.3
(1.01) 5.9
(0.97) 8.1
(0.97) 11.0
(0.95) 14.5
(0.94 18.4
(0.90) 22.8 (0.89)
35D
L x (cm)
y (m/s) 0.01
(2.17) 0.1
(1.74) 0.2
(1.39) 0.5
(1.38) 1.0
(1.37) 1.5
(1.37) 2.4
(1.34) 3.4
(1.32) 4.7
(1.30) 6.2
(1.28) 7.9 (1.27)
H x (cm)
y (m/s) 0.01
(2.17) 0.2
(1.76) 0.5
(1.39) 1.2
(1.34) 2.1
(1.32) 3.1
(1.31) 4.6
(1.26) 6.5
(1.26) 8.8
(1.22) 11.2
(1.22) 14.2
(1.22)
there. The blow from the putting stroke to the sweet spot has a very important meaning. In a typical experiment, the putting machine was set to hit putts which traveled about 6 meters when hit in the center of the putter face (sweet spot). When the ball moved 2.54 cm towards the toe or heel, the putts stopped 1.2~1.8 meters short of the central- hit distance, and about 18 cm to one side - left if heeled, right if toed (Cochran & Stobbs, 1968). As shown in (Table 2), when the impact was at the sweet spot, the velocity ratio between the club and the ball was 1:1.6 under various conditions. This ratio is often known as the golden ratio, and has been the focus of many researchers since the study of the Greek mathematician Euclid (Wikipedia, 2017). The maximum velocity of an impacted ball was at 7 to 14 cm, which corresponds to one half or one turn of the ball after impact. Also, depending on the club's speed, the point at which the ball's maximum velocity appears is affected, and the time it takes to reach the maximum velocity will also vary. As Cochran & Stobbs (1968) pointed out, the initial movement area of the ball is affected unnecessarily from the ground by the large move- ment of the ball when viewed from the whole of the ball movement.
Also, as the ball continues to progress, the initial effect will cause the ball to change direction. Therefore, it is desirable to roll immediately after impact (Naver, 2014) in order to reduce the unnecessary external influence of the ball. For this purpose, external force must be large and impact point is high. The ball is also believed to be slowing down in its initial movements. As shown in Table 3, when the ball moves at a speed of 50 cm at various ball speeds, the velocity of the ball at 1.16 m/s is reduced by about 33%, the ball at 1.46 m/s is reduced by about 31%, the ball at 1.77 m/s is reduced by about 28% and 19% of 2.17 m/s, respectively. The results of this study are the same as those pointed out by Hubbard & Alaways (1999) in their study. The slower the ball, the greater the retarding force. That is, as the ball progresses, the influence of the frictional force becomes larger, so that the speed is further reduced. This phenomenon is considered to be greater when the starting velocity is slow.
The position of the changing point (break point) of the ball due to the slope is more closer to the higher slope than lower slope. The changing position of the ball is about 1 to 1.4 m from the point where the ball leaves. Pelz and Frank (2000) analyzed the 'break' and reported that when your target line passes 2.5 cm outside the cup, then putt breaks are 7.9 cm into the center of the hole. In this case, the 'break' is a radius of hole and off distance at the target line. It is a usual term in golf. But in this study, 'break' is a point which changes the direction from the expected ball line. That is, if there is a slope, the ball follows the target line by the straightening force, and when it reaches 1 m position, the straightening force decreases by 30~50% and reaches to the deviation point which is severely influenced by the slope. From here, the ball is aimed in a direction other than the target, and the slope affects its size. 20D (club head moved 20 cm and freely dropped) of Table 3 shows that a ball with a speed of 1.16 m/s cannot proceed to the target direction when it meets a high slope and continues to 'slip' in the slope direction. In other words, a ball with a speed that cannot overcome a slope cannot reach the target point, so a putting stroke that provides a sufficient speed can be considered necessary.
Table 4 shows the velocity of the ball and the size of the center of
the ball that deviates from the center when entering the hole. Since the radius is 5.4 cm at the center of the hole, if the deviation in the x-axis is less than the radius, it can enter the hole once. However, as claimed by Holmes (1991), the position should be 10.8 cm in diameter at the center of the hole. In conclusion, there is no ball held in the hole at the target 1.8 meters if there is some slope, except when the ground is flat. So the goal must be reset and its size is highly relevant to the slope.
CONCLUSIONS AND SUGGESTION
According to the results of this experiment, the ratio between club and ball was 1:1.6 when the ball was impacted with sweet spot. And the maximum velocity of ball showed at the position of 7~14 cm from the starting point and about 0.08~0.09s of time was taken. If there is a side slope when a ball is moving on the putting green, the ball moves away from the straight line. It was also concluded that the bigger the slope, the position of the break is nearer to the starting point. In this experiment, the position of the break was about 1~1.4 m after the ball departed from the original position. If the ball was at 1.8 meters from the target (diameter 10.8 cm) and the ball was stroke to the center of the hole cup, it cannot get into the hole cup at the starting speeds of 1.16 to 2.17 m/s. Because the ball is affected by uphill and sidehill slope, the ball slows down and drifts away from the target. Therefore, the player should increase the speed of the ball or change the target from 7.9 to 28.6 cm toward the higher side. According to the results of this study, it is most necessary to make a strong stroke when putting within 1 meter. If the target is 1 to 1.4 meters, hole cup also contains break positions. Therefore, it is necessary to look around the putting green area and set the target, but do not leave the center of the hole cup. For a 1.8 meter putt, the ball may deviate and be affected by the slope. Therefore, it is necessary to calculate the degree of deviation according to the slope. The slower the speed, the more affected by the slope, so it is desirable to hit relatively strong. It is also preferable to use the center of a hole cup as a reference when calculating the departure.
ACKNOWLEDGEMENTS
This work was supported by a research grant from Seoul Women's University (2017).
REFERENCES
Alexander, D. L. & Kern, W. (2005). Drive for show and putt for dough?
Journal of Sports Economics , 6 , 46-60.
Cochran, A. & Stobbs, J. (1968). The Search for the Perfect Swing . Philadelphia, PA: J.B. Lippinncott Co.
Golfdatalab (2017. 9. 25). http://golfdatalab.com/Performance/Putts- GainedExplained.pdf
Heuler, O. (1995). Perfecting Your Golf Swing . New York: Sterling Pub- lishing Company.
Hubbard, M. & Alaways, L. W. (1999). Mechanical interaction of the
golf ball with putting green. Science and Golf III , 429-439.
276 Jin Park, et al.
KJSB
Karlsen, J. Smith, G. & Nilsson, J. (2008). The stroke has only a minor influence on direction sonsistency in golf putting among elite players. Journal of Sports Science , 26 (3), 243-250.
Naver (2014. 12. 6). http://www.real-physics-problems.com/physics-of- billiards.html
Park, J. (2000). A Kinematic Analysis for Putter's Motion in Putting Stroke.
Korean Journal of Sport Biomechanics , 9 (2), 319-331.
Park, J. (2002). Comparison of Putting Stroke Characteristics between Expert and Novice Golfers (I). Korean Journal of Sport Biomechanics , 12 (2), 197-206.
Park, J. (2006). A development of Pendulum Putting Machine for the experiments of putting stroke. Korean Journal of Sport Biomechanics , 16 (4), 147-152.
Park, J. (2014). A theoretical approach to the holed during the putting stroke. Korean Journal of Golf Studies , 8 (4), 75-80.
Pelz, D. & Frank, J. A. (2000). Dave Pelz's putting bible: The complete guide to mastering the green . New York: Random House.
Penner, A. R. (2002). The physics of putting. Canadian Journal of Physics ,
80 , 1-14.
Palmer, A. & Dobereiner, P. (1986). Arnold Palmer's complete book of putting . New York: Pocket books.
Robertson, D. G. E., Caldwell, G. E., Hamill, J., Kamen, G. & Whittlesey, S. N. (2004). Research Methods in Biomechanics . Champaign, IL:
Human Kinetics.
Sayers, M. G. L., Stuelcken, M. C. & Gorman, A. D. (2017). Functional variability in golf putting differences between highly skilled players.
International Journal of Sports Psychology , 48 , 70-81.
Sim, M. & Kim, J-U. (2010). Differences between experts and novices in kinematics and accuracy of golf putting. Human Movement Science , 29 , 932-946.
Stimpson, E. S. (1974). Putting greens-How fast? USGA Golf Journal , 27 , 28-29.
Wikipedia (2017. 10. 22). https://ko.wikipedia.org/wiki/goldenratio Winter, D. A. (1990). Biomechanics and motor control of human move-
ment (2
nded.) . New York, NY: John Wiley & Sons.
Appendix 1. Internal consistency reliability for repeated experiments
Number Cronbach's α
Flat y-axis
20 cm
20 .997
25 cm 30 cm 35 cm
Flat x-axis
20 cm
20 .997
25 cm 30 cm 35 cm
Flat z-axis
20 cm
20 .997
25 cm 30 cm 35 cm
Low slope y-axis
20 cm
20 .997
25 cm 30 cm 35 cm
Low slope x-axis
20 cm
20 .993
25 cm 30 cm 35 cm
Low slope z-axis
20 cm
20 .977
25 cm 30 cm 35 cm
High slope y-axis
20 cm
20 .978
25 cm 30 cm 35 cm
High slope y-axis
20 cm
20 .994
25 cm 30 cm 35 cm
High slope y-axis
20 cm
20 .985
25 cm
30 cm
35 cm
278 Jin Park, et al.
KJSB
Appendix 2. Analysis of variance of x axis variable according to slope