http://dx.doi.org/10.5391/JKIIS.2013.23.2.139
테두리 검출에 기반한 영상 이진화
Image Thresholding based on Edge Detection
권순학*†, 크리쉬나무디 시바쿠마**
Soon H. Kwon
*†and Krishnamoorthy Sivakumar
***영남대학교 전기공학과, **워싱턴주립대학교 전기컴퓨터공학부
†
Dept. of Elec. Eng., Yeungnam University, EECS, Washington State University
요 약
기존의 영상 이진화에 대한 알고리즘의 기본 아이디어는 영상이 회색 수준의 차이에 의하여 물체와 배경으로 구분된다는 가정에서 이루어지고 있다. 본 논문에서는 이러한 가정을 확장하여 영상은 물체와 배경뿐만 아니라 하나를 더 추가하여 그 테두리로 이루어진다고 가정하고 테두리 검출에 기반한 이진화 기법을 제안한다. 제안한 방법의 타당성을 보이기 위하여 6개의 잘 알려진 영상에 대하여 모의실험을 수행하고, 그 결과로부터 기존의 방법들과의 성능을 비교 검토한다.
키워드 : 영상 이진화, 테두리 검출
Abstract
The basic idea of conventional thresholding is that an image consists of objects and their background where the gray levels of the objects are different from those of the background. In this paper, we extend it to one where an image consists of not only objects and the background but also their edges. Based on this extension, we propose an edge detection-based thresholding method. The effectiveness of the proposed method is demonstrated by experimental results tested on six well-known test images and compared with conventional methods.
Keywords : Image Thresholding, Edge Detection.
1. Introduction
Image segmentation partitions an image into component parts or into separate objects. Thresholding is the most popular segmentation technique, although it is not the only way to segment image, because of its simplicity and effectiveness [1]- [3]. Many methods [4]-[8] have been developed to select an optimal threshold value which minimizes the overlapping distribution of gray levels. Thresholding methods can be roughly categorized into six categories according to the information they are exploiting: histogram shape-based methods, clustering-based methods, entropy-based methods, object attribute-based methods, spatial methods, and local methods [3]. Exhaustive surveys, evaluations and comparative studies of these methods have been presented by many researchers [2],[3]. Among the thresholding methods, the Otsu method [4] which minimizes the within-class variances, that is, maximizes the between-class variance is still the most popular for its simplicity and efficiency. The implicit assumption in image thresholding is that an image consists of objects including their background where the gray levels are similar
within an object (foreground) and different between different objects (background).
As discussed in [7],[8], the performance of thresholding methods greatly depends on which information is selected and how it is used. Edges defined as areas with strong intensity contrast in images can be used as important information for image analysis, especially thresholding. Based on this consideration, we extend the conventional thresholding idea to one where an image consists of not only objects and the background but also their edges. In this paper, we propose an image thresholding method based on edge detection. For detecting edges and obtaining an appropriate threshold value, we use conventional edge detectors such as Canny, Prewitt, and Sobel edge detectors which have been most often used to build the reference images because of their superior performance.
Experimental results of applying the proposed method and conventional thresholding methods to six well-known test images are also presented to demonstrate the effectiveness of the proposed method.
2. Conventional Thresholding and Edge Detection
We review briefly the conventional thresholding and edge detection methods. Since Otsu’s original work [4] on thresholding problems, many thresholding methods have since been proposed. We review briefly the Otsu method and the minimum variance thresholding method [6] to be subsequently used for performance comparison with the proposed method.
접수일자: 2013년 3월 12일 심사(수정)일자: 2013년 4월 3일 게재확정일자 : 2013년 4월 4일
†Corresponding author
This is an Open-Access article distributed under the terms of
the Creative Commons Attribution Non-Commercial License
(http://creativecommons.org/licenses/by-nc/3.0) which permits
unrestricted non-commercial use, distribution, and reproduction
in any medium, provided the original work is properly cited.
For convenience, we here consider a bi-level thresholding problem. Let denote a gray-level image with L gray levels , the number of pixels with gray level be , the
total number of pixels be , and the
probability of occurrence of gray-level be . Let bi-level partition of the gray levels be
and , where
is a threshold value. The optimal threshold value by the Otsu method can be determined by minimizing the within-class variance or maximizing the between-class variance
:
where
, ,
, ,
.
Liao et al. [5] proposed an equivalent but simplified formula for the Otsu method as follows:
Although the Otsu method is still among the most popular for its simplicity and efficiency, it is biased towards the component with larger class probability or larger class variance.
To overcome it, Hou et al. proposed the minimum class variance thresholding method (MCVT) as follows [6]:
Edge is a part of an image containing significant variations, that is, boundaries of objects which often lead to change of intensity in image. A typical edge in image processing could be classified into 4 types, i.e., step edge, line edge, ramp edge, and roof edge [1]. Various edge detection methods such as Sobel, Prewitt, and Canny edge detectors, which are using the difference of intensity, have been proposed [1],[9]. Generally, an edge detection method can be divided into three stages. In the first stage, a noise reduction process is performed in order to gain better performance of edge detection. This noise reduction is usually achieved by performing a low-pass filter because the additive noise is normally a high-frequency signal.
However, the edges can possibly be removed at the same time because they are also high-frequency signals. Hence, a parameter is commonly used to make the best trade-off
between noise reduction and edge information preservation. In the second stage, a high-pass filter such as a differential operator is usually employed to find the edges. In the last stage, an edge localization process is performed to identify the genuine edges, which are distinguished from those similar responses caused by noise [9]. Exhaustive survey, evaluation and comparative studies over these methods were presented by [1],[9].
3. The Proposed Method
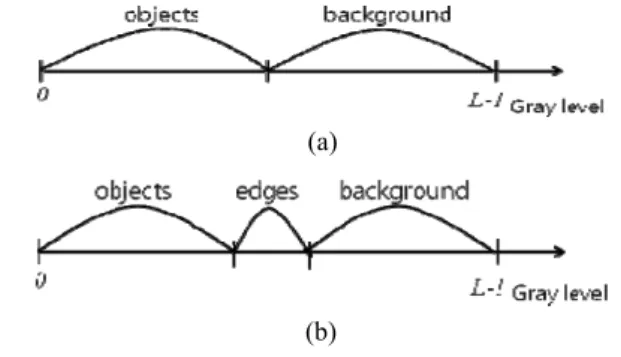
The implicit assumption in conventional image thresholding is that an image consists of objects including their background where the gray levels are similar within an object (foreground) and different between different objects (background) as shown in Fig. 1(a). Edges in images could represent not only the boundary information but also the positions and shapes of objects. Accordingly, edges can be used as important information to isolate particular objects from their background in an image. We extend the conventional thresholding idea into one where an image consists of not only objects and the background but also their edges as shown in Fig. 1(b).
(a)
(b)
Fig. 1. Decomposition of gray levels. (a) the conventional, (b) the proposed
Based on the extension, we propose an edge detection-based thresholding method consisting of the following three steps:
Step 1: Obtain edge images of an image by using a conventional edge detector such as Canny, Prewitt, or Sobel edge detectors. (Refer to edge images obtained by the Canny edge detector shown in Fig. 3.)
Step 2: Obtain the processed edge images by setting the gray level of every pixel except edges as 0. Compute the histogram of the processed edge images. .
Step 3: Based on the histogram, obtain an appropriate threshold value by using the minimum class variance thresholding method (MCVT) given by Eq. (3).
4. Experimental Results and Remarks
To demonstrate the effectiveness of the proposed method,
two experiments for the two conventional thresholding
methods (Otsu’s method [4] and the minimum class variance
thresholding (MCVT) [6]) and the proposed method were
performed on six test images in Fig. 2.
(a) (b) (c)
(d) (e) (f)
Fig. 2. Test images. (a) Artery, (b) Eye chart, (c) Brain13, (d) Key, (e) Plate, and (f) Rice
A quantitative measure supplemented with visual inspection is used for comparing performance of those methods. A measure which can depict the richness of details to some extent is the discrete entropy E given by [10]:
0
1 log
0 2
i
L i
i
i
p p
p
E
,(4)
where p
i n
i/N is the probability of occurrence of gray- level i of the given image. Entropy has been used to measure the content of the image, with a higher value indicating images that are richer in details.
To investigate the property of the brightness preservation of the processed image, we used the absolute mean brightness error (AMBE) in Eq. (5). A lower value of AMBE implies better brightness preservation:
o
AMBE
p
(5) where μp and μo denote means of the proposed and original images, respectively.
Experiment 1: In this experiment, edges for the six test images were obtained by the Canny edge detector and shown in Fig. 3. Threshold values for images shown in Fig. 3 obtained by the Otsu, MCVT, and the proposed methods are listed in Table 1. The images thresholded by the Otsu, MCVT, and the proposed methods are shown in Fig. 4.
(a) (b) (c)
(d) (e) (f)
Fig. 3. Edge images obtained by the Canny edge detector. (a) Artery, (b) Eye chart, (c) Brain13, (d) Key, (e) Plate, and (f) Rice
Table 1. Threshold values of the Otsu, MCVT, and the proposed
Images Otsu MCVT Proposed
Artery 133 200 100
Eye chart 145 53 200 Brain13 118 220 76
Key 133 156 165
Plate 122 104 123
Rice 113 132 116
(a1) (a2) (a3)
(b1) (b2) (b3)
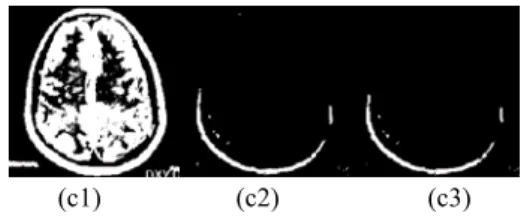
(c1) (c2) (c3)
(d1) (d2) (d3)
(e1) (e2) (e3)
(f1) (f2) (f3)
Fig. 4. Thresholding results for test images. (*1) Otsu, (*2)
MCVT, and (*3) The proposed, (*=a,b,c,d,e, and f)
As we can see from Fig. 4, the visual performance of almost
all images obtained by the proposed method, which shows local
details well, is superior to those of images obtained from the
Otsu and MCVT methods. The visual assessment is supported
by the entropy and the AMBE values are listed in Tables 2 and
3. With respect to the entropy values in Table 2, the proposed
method increases the image content better than the Otsu and MCVT methods in almost all images (with the exception of
‘key’ and ‘Rice’ images). Comparison of the AMBE values for the three methods revealed that the proposed method outperformed the Otsu and MCVT methods for three images (i.e., ‘Artery’, ‘Plate’, and ‘Rice’ images).
Table 2. Discrete entropy values for the original and processed images
Images Original Otsu MCVT Proposed Artery 7.3133 0.8768 0.3002 0.9005 Eye
chart 1.8391 0.3753 0.2862 0.4305 Brain13 6.9192 0.5080 0.1446 0.9864
Key 5.8026 0.6254 0.5900 0.5590
Plate 6.6777 0.8634 0.8362 0.8659 Rice 6.9489 0.8074 0.7340 0.7957
Table 3. AMBE values for the processed images
Images Otsu MCVT Proposed
Artery 0.2269 0.2982 0.1102
Eye chart 0.2800 0.0818 0.3166
Brain13 0.1260 0.0879 0.1987
Key 0.3117 0.0182 0.0415
Plate 0.3599 0.1540 0.1326
Rice 0.2019 0.2120 0.1803
Experiment 2: In this experiment, we selected three images (i.e., ‘Artery’, ‘Eye chart’ and ‘Brain13’) on the basis of experimental results obtained in Experiment 1 and tested the performance of the proposed method adopting Canny, Prewitt, and Sobel edge detectors. Threshold values obtained by those are listed in Table 4, and the thresholded images are shown in Fig. 5.
Table 4. Threshold values of images processed by the proposed
Images Canny Prewitt Sobel
Artery 100 185 186
Eye chart 200 211 212
Brain13 76 202 208
(a1) (a2) (a3)
(b1) (b2) (b3)
(c1) (c2) (c3)
Fig. 5. Thresholding results. (*1) Canny, (*2) Prewitt, and (*3) Sobel, (*=a, b and c)
The visual assessment was supported by the computed entropy listed in Table 5. From Fig. 5 and Table 5, we can see that the performance of the proposed method depends on the adopted edge detector, and the performance of the proposed method adopting the Canny edge detector shows superior to those of the others.
Table 5. Discrete entropy values for the processed images
Images
Canny
Proposed Prewitt Sobel
Otsu
Artery 0.9005 0.3792 0.3725 0.8768 Eye chart 0.4305 0.4521 0.4526 0.3753 Brain13 0.9864 0.1911 0.1764 0.5080
5. Conclusion
In this paper, a new thresholding method based on the detection of edges of the given image was proposed. We compared the performance of the proposed method adopting Canny edge detector with those of the Otsu method and MCVT, and evaluated the performance of the proposed method adopting Canny, Prewitt, and Sobel edge detectors. The experimental results show that the proposed thresholding method adopting Canny edge detector provides more effective images for almost test images compared to those of other thresholding methods. Finally, we would like to stress that the proposed method has following limitations: (i) very slow performance due to edge detection and (ii) performance depending on the selected edge detection method. Further research on the topics is needed.
References
[1] R. C. Gonzalez, R. E. Woods, and S. L. Eddins, Digital Image Processing using MATLAB, Pearson, NJ, 2004.
[2] P. S. Sahoo, S. Soltani, and A. Wong, “A survey of thresholding techniques”, Comput. Vision Graphics Image Process., vol.41, no.2, pp.233-260, 1988.
[3] M. Sezgin, and B. Sankur, “Survey over image thresholding techniques and quantitative performance evaluation”, Journal of Electronic Imaging, vol.13, no.1, pp.146-165, 2004.
[4] N. Otsu, “A threshold selection method from gray-level histogram,” IEEE Trans. Syst. Man Cybern., vol.9, no.1, pp.62-66, 1979.
[5] P.-S. Liao. T.-S. Chen, and P.-C. Chung, “A Fast
Algorithm for Multilevel Thresholding,” Journal of
Information Science and Engineering, vol.17, no.5, pp.713- 727, 2001.
[6] Z. Hou, Q. Hu, and W.L. Nowinski, “On minimum variance thresholding”, Pattern Recognition Lett., vol.27, no.10, pp.1143-1154, 2006.
[7] S.H. Kwon, “Threshold selection based on cluster analysis,” Pattern Recognition Lett., vol.25, no.9, pp.1045- 1050, 2004.
[8] N. Bonnet, J. Cutrona, and M. Herbin, “A ‘no-threshold’
histogram-based image segmentation method,” Pattern Recognition, vol.35, no.10, pp.2319-2322, 2002.
[9] M. A. Oskoei and H. Hu, A Survey on Edge Detection Methods, Technical Report: CES-506, University of Essex, U.K., 2010.
[10] I. Jafar and H. Ying, “A New Method for Image Contrast Enhancement Based on Automatic Specification of Local Histogram”, Int. J. of Computer Science and Network Security, vol.7, no.7, pp.1-10, 2007.
저 자 소 개