1) Department of Construction & Disaster Prevention Engineering, Kyungpook National University Department of Civil Engineering, Thuyloi University, Hanoi, Vietnam
† Department of Construction & Disaster Prevention Engineering, Kyungpook National University (Corresponding Author : [email protected])
Effect of Rainfall Patterns on the Response of Water Pressure and Slope Stability Within a Small Catchment: A Case Study
in Jinbu-Myeon, South Korea
Tran The Viet1)・ Giha Lee†・ Sewook Oh2)・ Minseok Kim3) Received: July 19th, 2016; Revised: July 22nd, 2016; Accepted: October 27th, 2016
ABSTRACT : This study aims to assess the influence of rainfall patterns on shallow landslides initiation. Doing so, five typical rainfall patterns with the same cumulative amount and intensity components comprising Advanced (A1 and A2), Centralized (C), and Delayed (D1 and D2) were designed based on a historical rainstorm event in Jinbu. Mt area. Those patterns were incorporated as the hydrological conditions into the Transient Rainfall Infiltration and Grid-based Regional Slope-stability Model (TRIGRS) to assess their influences on groundwater pressure and changes in the stability of the slope. The results revealed that not only the cumulative rainfall thresholds necessary to initiate landslides, but also the rate at which the factor of safety decreases and the time required to reach the critical state, are governed by rainfall patterns. The sooner the peak rainfall intensity, the smaller the cumulative rainfall threshold, and the shorter the time until landslide occurrence. Left-skewed patterns were found to have a greater effect on landslide initiation. Specifically, among five rainfalls, pattern (A1) produced the most critical state. The severity of response was followed by patterns A2, C, D1, and D2. Our conclusion is that rainfall patterns have a significant effect on the cumulative rainfall threshold, the build-up of groundwater pressure, and the occurrence of shallow landslides.
Keywords : Landslide, Rainfall pattern, Rainfall threshold, Groundwater pressure, TRIGRS Journal of the Korean Geo-Environmental Society
17(12): 5~16. (December, 2016) http://www.kges.or.kr
ISSN 1598-0820 DOI https://doi.org/10.14481/jkges.2016.17.12.5
1. Introduction
Shallow landslides are generally the most common natural disaster in South Korea and often initiate into destructive debris flows. The natural slopes in this country are often quite steep (30° – 60° tilt angles) and overlain by a thin layer of weathered soil, (often less than 2 m thick) (Lee et al., 2008; Park et al., 2013a). Therefore, shallow landslides, in which slippage occurs at the boundary between bedrock and cover soil and are typically induced by intense rainfall (Park et al., 2013a). As such, this type of landslide is the main sediment-related disaster in the mountainous regions of South Korea (Lee et al., 2008; Kim et al., 2014). The occurrence of major landslides has been related to typhoons and short-term torrential rainfall events during the summer from June to August (Chae & Kim, 2012; Yune et al., 2013;
Kim et al., 2010; Lee et al., 2012c; Park et al., 2013b).
Therefore, with unfavorable mountainous terrains combining with weather conditions, the risk to lives and properties is
increasing as more development take place on sites close to steep slopes.
The climate of South Korea is typical of the Indian Ocean monsoon with pronounced seasonal rainfall (Park et al., 2013a).
The average annual precipitation in Korea is around 1,245 mm (1974 to 2003), and two-thirds of which occurs during the summer. Jung et al. (2002) studied 46 years of daily precipitation in the period from 1956 to 2000; and confirmed that extreme precipitation events had increased significantly in South Korea. Examining 187 stations around Korea during the period from 1973 to 2005, Chang & Kwon (2007) found that the number of days in which precipitation exceeded 50 mm and 30 mm rose at all stations. The increase in annual precipitation is significantly associated with the increase in heavy rainfall events during the summer. Such severe rain storms often result in serious damage, and their frequency and intensity have increased in South Korea (Kim, 2012).
In Korea, there are no reported cases in which slope failures were triggered by earthquakes. Instead, the majority
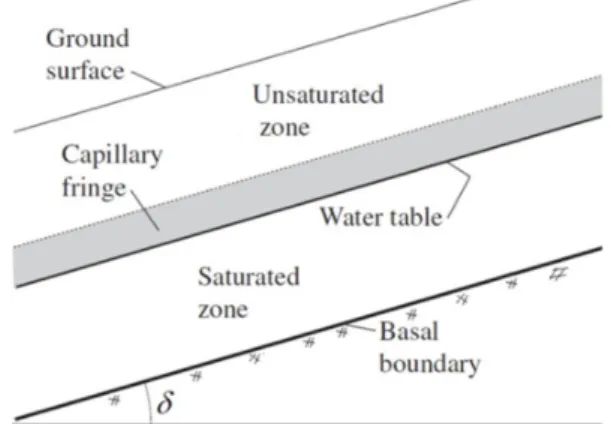
Fig. 1. Graph showing the boundary conditions assumed in TRIGRS (Baum et al., 2008)
of landslides are triggered by intense rainfall during the rainy season (Lee & Hencher, 2014). Rainfall is the most commonly recognized triggering factor for a landslide (Rahimi et al., 2011), and although the significance of rainfall infiltration in causing landslides is widely acknowledged, the role of antecedent rainfall is not yet fully resolved (Mukhlisin &
Taha, 2012). Specific cases from different regions produce differing conclusions (Rahardjo et al., 2007). However, the general principle of rainfall-induced landslides has been explained by Ng & Shi (1998), Tsai & Wang (2010), and Viet et al. (2015), Viet et al. (2016). As rainwater infiltrates the unsaturated zone of the soil slope, it leads to the increase in pore water pressures and consequently reduces the shear strength of the soil, and when the shear strength at the potential slip surface is exceeded, slope failure will occur.
However, prediction of the location and timing of rainfall- induced shallow landslides remains a difficult task, as slippage is controlled by various specific spatial and climatic factors (Lee & Park, 2014).
The temporal patterns of storms are determined by the arrangement of their rainfall intensity histograms (de Lima
& Singh, 2002). Although rainfall intensity has been identified as the main cause of rainfall-induced slope failure, the temporal pattern or spatial distribution of the antecedent rainfall has not yet received much attention (Rahimi et al., 2011). Storm patterns are important because they are one of the major factors determining the shape of the runoff hydrograph (de Lima & Singh, 2002), and thus, the occurrence of shallow landslides may not be adequately understood if the rainfall pattern is not taken into account (Tsai & Wang, 2010). Ng &
Tung (2001) studied the effect of rainfall patterns on changes in pore-water pressure on slopes and found a significant correlation between these two factors. Varying patterns of antecedent rainfall alter the rate which the factor of safety decreases, as well as the time corresponding to the Fs, and the value of Fs itself. Therefore, a better understanding of how rainfall patterns can influence the build-up of groundwater pressure, and the likelihood of slope instabilities, is essential.
In this study, five typical rainfall patterns with the same cumulative rainfall amount and intensity components were designed based on a historical rainstorm that caused severe landslides in the study area. These comprise the Advanced (A1 and A2), the Centralized (C), and Delayed (D1 and D2) patterns. Selection of the historical rainstorm was based
primarily on the geological conditions and the characteristics of rainfall in the study area, as explained in later section.
However, a rainfall event of short duration and high intensity which reflects the natural condition of Korea was sought as a priority. The influences of rainstorm patterns on groundwater pressure variations, changes in the stability conditions and cumulative rainfall threshold for landslide initiation were analyzed by using the Transient Rainfall Infiltration and Grid- based Regional Slope-stability Model (TRIGRS) (Baum et al., 2008) for the Mt. Jinbu area in Korea. This study site suffered severely from landslides and debris flow in 2006.
2. Application of TRIGRS for Rainfall- Induced Shallow Landslide Prediction
Most previous studies on the influence of rainfall pattern on landslide initiation were for a typical slope cross-section (Tsai, 2008; Kim et al., 2012) or a soil column (Jia et al., 2009). In this study, we evaluated this effect for a whole landscape using TRIGRS. The program is a physical based coupled hydro-mechanical slope stability assessment model.
It computes transient groundwater pressure variations, and attendant changes in the factor of safety over large areas, as a result of rainfall (Baum et al., 2008). Depending of the characteristics of the site, the model can be saturated or unsaturated with infinite-depth or finite-depth of the basal boundary (Fig. 1). The infiltration model in TRIGRS for initially wet conditions are adopted based on the linearized solution of the Richards equation as described by Iverson (2000) and the extensions of Baum et al. (2002). The stability of the slope is evaluated for transient pressure head at multiple
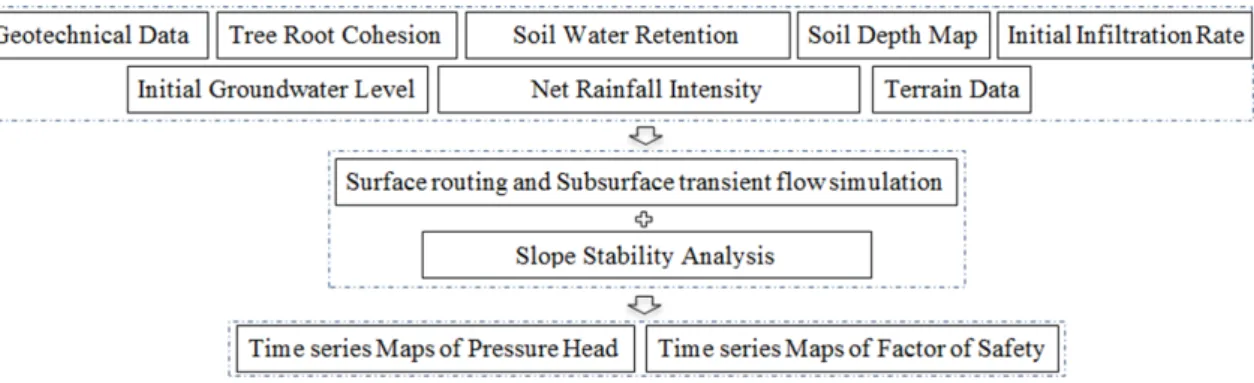
Fig. 2. Framework for applying TRIGRS to rainfall-induced landslide problem depths Z by using the infinite slope stability model. Like
other physical-based models, TRIGRS is subjected to limitations imposed by simplifying assumptions, approximations, and other shortcomings in the underlying theories (Baum et al., 2008). More details about the model are clearly described in the studies of Baum et al. (2010).
In this study, the unsaturated with finite-depth of basal boundary is selected regarding the characteristics of the study area. This approach treats the soil as a two-layer system consisting of a saturated zone with a capillary fringe above the water table, overlain by an unsaturated zone that extends upwards to the ground surface (Raia et al., 2014) (Fig. 1).
For modeling the problem related to rainfall-induced pore-pressure head in sloping ground, TRIGRS utilizes the coordinate transformation defined by Iverson (2000) to upgrade the 1-D form of the Richards’ equation (Eq. 1).
Four parameters including the saturated moisture content (), the residual moisture content (), the fitting parameter to the soil water characteristic curve (), and the hydraulic conductivity () are used to approximate the infiltration process as one dimensional, vertical flow. The infiltrating water accumulates at the base of the unsaturated zone and thus raises the water table (Baum et al., 2008).
cos (1)
where is the ground-water pressure head; is a function of hydraulic conductivity depending on the value of ; is the volumetric water content; t is time, and
cos is the vertical coordinate direction (positive downward) and depth below the ground surface, where z is the slope-normal coordinate direction (also positive downward), and is the slope angle (Fig. 1).
Unlike other previous approaches evaluating the influence of rainfall pattern without considering the effect of overland flow, TRIGRS uses a simplified method to route surface runoff from cells that have excess surface water to adjacent downslope cells when the precipitation and runoff supplied to a cell exceeds its infiltrability (Baum et al., 2008). The purpose of this simulation is to prevent the loss of excess precipitation that cannot infiltrate at the cell of origin and to improve the performance of the model in urbanized or other areas where pavements and other impervious surfaces exist (Baum et al., 2008). The saturated hydraulic conductivity, Ks, generally equals the infiltrability, I, for saturated and tension-saturated soils (Iverson, 2000). In TRIGRS, it is assumed that the infiltration I (the sum of the precipitation P and the runoff from upslope cells Ru) for a cell cannot exceed its saturated hydraulic conductivity Ks. Thus, under such conditions, runoff would occur. In both cases, the amount of infiltration is simulated based on the following assumptions:
≤ (2)
Thus, runoff Rd is calculated using the following equation:
≥ (3)
The slope stability analysis in TRIGRS is calculated for transient pressure heads at multiple depths Z using a simple infinite slope stability model to calculate the Fs value on a cell-by-cell basis. In such analysis, the failure of an infinite slope is characterized by the ratio of the resisting friction on the basal to the gravitationally induced downslope basal driving stress. This ratio is calculated for each grid cell at
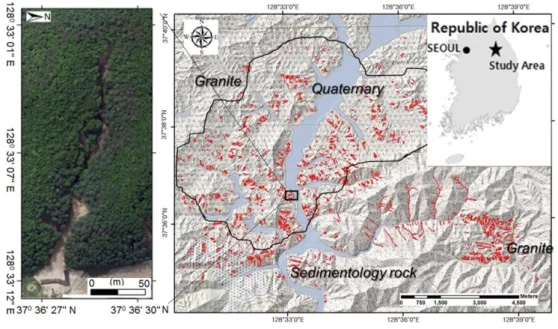
Fig. 3. Location of the study area (Kim et al., 2015b) an arbitrary depth, Z, by:
tan′ tan sin cos
′ tan′
(4)
where c’ (kN/m2) is the effective soil cohesion; (kN/m2) is the apparent cohesion provided by tree roots; ′ (degree) is the soil’s effective friction angle; (m) is the pressure head as a function of depth Z and time t; (degree) is the slope angle, and (kN/m3) and (kN/m3) are the unit weights of water and soil, respectively. Failure is predicted when Fs < 1, and stability is maintained when Fs ≥ 1. The state of limiting equilibrium exists when Fs = 1. Fig. 2 illustrates the framework for applying TRIGRS to a rainfall- induced landslide problem, further theoretical details of the TRIGRS model can be found in its open-file reports (Baum et al., 2008).
3. Study Area and TRIGRS Input Data
The research site is a small watershed that locates in Jinbu-Myeon, Pyeongchang-gun, Kangwon Prefecture, South Korea. The coordinate of the center of the area is situated at 37°37ʹ49ʹʹ N, 128°33ʹ29ʹʹ E (Fig. 3). Jinbu has a subtropical climate with year-round precipitation. Rainfall-triggered debris flows, and shallow soil slides are the most abundant types of landslides in this area (Lee et al., 2012b). In particular,
between 26 June and 29 July 2006, very intense precipitation episodes with the total rainfall amount and maximum rainfall intensity were approximately 500 mm/day and 45 mm/h;
respectively (Korea Meteorological Administration) caused many landslides of the flow type in the cover soil layer of the slopes in this region. As the rainiest area in Korea, Mt.
Jinbu is most often affected by landslides; therefore, it is considered a suitable site for evaluating the frequency and distribution of such disaster (Lee et al., 2012c).
3.1 Geomorphology
The surface of the study area is illustrated by a 1-m resolution elevation map (Fig. 4) which based on a digital elevation map (1:5,000) from the National Geographic Information Institute in the Republic of Korea. This map was then used to interpolate the slope map and the flow directions map using ArcMap program to compile the input files for TRIGRS model.
3.2 Soil Thickness
A survey of 117 landslides across Korea, triggered by Typhoon Rusa in 2002 and Maemi in 2003 showed that the majority of slips involved sliding along the boundaries between soil and bedrock (Lee et al., 2008; Park et al., 2013b). The determination of soil thickness is of particular importance, as it influences various engineering properties, including hydraulic conductivity, transmissivity, and the angle of internal friction
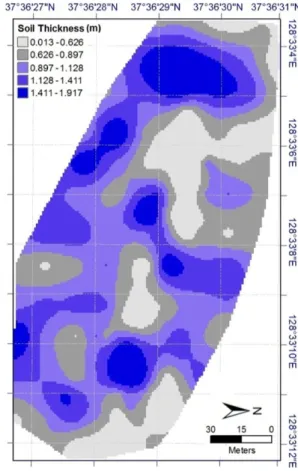
Fig. 4. Digital elevation model (Kim et al., 2015b) Fig. 5. Map of soil thickness (Kim et al., 2015b)
of the soils. Thus, the accuracy of shallow landslide prediction can be improved by incorporating soil parameters that fully represent the effects of soil thickness (Kim et al., 2015a).
However, mapping the thickness of the topsoil layer is difficult, costly, and time-consuming, especially for large areas with complex topography. Therefore, soil thickness information from landslide-prone areas is scarce in reality.
In the present study, the dynamic cone penetrometer (25 mm diameter with 60° tip angle), also known as the knocking pole test was used to measure the soil thickness. Total of 125 tests with the intervals from 10 to 15 meters were conducted on the site at typical locations. The data related to the soil depth and its corresponding location is recorded using a real-time kinematic – global positioning system (RTK-GPS:
GPT-7001L, Topcon, Tokyo, Japan). The soil depth map (Fig. 5) for the whole area was then interpolated using data from those test by the ordinary kriging method with linear variogram technique. More detail about the procedure to build the soil thickness map is described in the study of Kim et al. (2015b).
3.3 Geological Conditions and Soil Engineering Parameters
The field survey shows that this study area is covered only by well-weathered granite. In the larger scale, Imgye Granite, which is an extensive intrusion of granitoids formed during the Daebo Orogeny, is distributed across the majority of the study area (almost 77% of the total area) (Lee et al., 2012a) as shown in Fig. 3. All of the previous geological units were intensely deformed as a result of this intense orogenic event (Park et al., 2013b). The soil material mostly comprises granite residuum, with well-drained soils covering around 84% of the study area (Lee et al., 2012c).
For the properties of the colluvium, soil samples were collected at locations 1 m apart in the detritical-colluvial soil layer and bedrock soil layer. Unlike the typical triaxial shear testing that is accomplished by increasing the shear stress, the consolidated drained (CD) test approximates conditions during rainfall-induced failure by maintaining a constant shear stress while reducing the effective stress (Kim et al., 2015a).
Therefore, the CD triaxial test was conducted to obtain the shear strength parameters of the soil cover layer because
Fig. 6. Soil water characteristic curve in the study area
Table 1. Soil properties determined by triaxial test
Soil parameter Unit Value
Saturated soil density kN/m3 17.4
Cohesion c kPa 1.6
Internal friction angle (°) 36.5
Hydraulic conductivity Ksat m/s 1.389 E-05
Diffusivity D0 m2/s-1 100 × Ksat
Steady infiltration rate Iz m/s 0.01 × Ksat
Saturated volumetric water contents (%) 49.6 Residual volumetric water contents (%) 15.0
Fitting parameter (m-1) 1.0 Fig. 7. Typical representative rainfall patterns
shallow landslides are triggered by elevated pore pressure, which decreases the effective normal stress rather than increasing the shear stress (Anderson & Riemer, 1995). Hydraulic con- ductivity (Ks) also was conducted in the laboratory based on the “falling head” test.
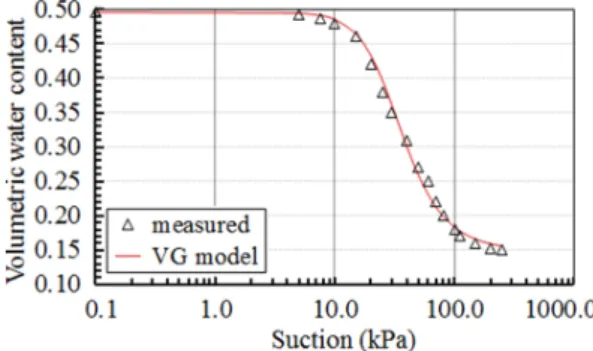
Together with the soil shear strength parameters, the hydraulic conductivity, dry and saturated soil densities, and volumetric water content were also defined. Two input parameters for the unsaturated flow including saturated volumetric water content (θs) and residual volumetric water content θr, were determined using the soil water characteristic curve (SWCC) test. The SWCC (Fig. 6) was defined by fitting the van Genuchten formula, the saturated and residual volumetric water contents thus determined were 49.6% and 15.0%, respectively (Table 1).
Other input parameters for TRIGRS, including the diffusivity (D0) and the steady infiltration rate (IZ) were estimated from empirical references as their values can vary widely and depend on many factors. Iverson (2000) identified D0 as the maximum characteristic diffusivity, given by the ratio of saturated conductivity (Ksat) to the minimum change in volumetric water content per unit change in a pressure head (C0). Owing to the fact that it is difficult to test for D0,
several studies have defined the range of D0 as between 5 and 500 times that of the hydraulic conductivity (Baum et al., 2010; Kim et al., 2010; Park et al., 2013a). In this study, based on the hydraulic properties of the soil, D0 was assumed to be 100 times the value of Ksat. The value of Iz can be approximated by defining the average precipitation rate needed to maintain the initial conditions in the days and months preceding an event (Baum et al., 2010). However, for simplicity, Iz was assumed to be 100 times less than Ksat, as suggested by Park et al., 2013a) based on the summer time conditions in Korea.
3.4 Groundwater Table
No data were collected documenting the depth of the groundwater table before the landslide occurred. In the natural hillslopes of Korea, groundwater commonly lies within the very deep soil around the mountain tops (Kim et al., 2013).
However, most conservative studies accept the assumption that the groundwater table coincides with the depth of the cover soil layer under initial conditions (Kim et al., 2010;
Kim et al., 2013; Park et al., 2013a). In this study, as the landslide occurred during the rainy season, and there was antecedent rainfall of 238 mm fell within more than one day before the main rainstorm. Therefore, it is reasonable to assume that the groundwater table was at the depth of the bedrock surface (Fig. 5) at the initial condition.
3.5 Rainfall and Rainfall Patterns
Several researchers have studied the influence of rainstorm patterns on the stability of slopes (Ng & Tung, 2001; de Lima & Singh, 2002; Tsai, 2008; Jia et al., 2009). These studies have generally examined six typical rainfall patterns that might represent the reality, namely: Advanced (A1 and
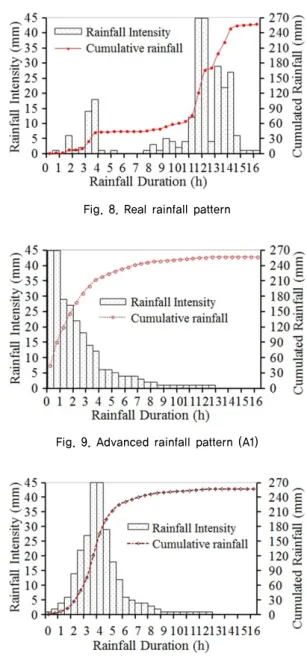
Fig. 8. Real rainfall pattern
Fig. 9. Advanced rainfall pattern (A1)
Fig. 10. Advanced rainfall pattern (A2) A2), Centralized (C), Delayed (D1 and D2) and Uniformed
patterns (Fig. 7). Among those patterns, Advanced types have peak intensity during the early part of the event; Centralized type has relatively high intensity in the center while Delayed pattern has the peak intensity at the end of the event.
However, a problem persists with the application of these patterns in that they may not well represent the actual rainfall patterns (Rahimi et al., 2011). Thus, the simulated results could represent an over- or underestimation because these linearly-distributed patterns do not reflect the actual conditions, in particular for rainstorms with extreme intensity and short duration. Moreover, these patterns may lead to extreme values for cumulated rainfall, and therefore, result in overprediction in the simulation. Hence, to represent the field conditions, it is necessary to examine the actual rainstorm patterns. In this study, a historical rainstorm event is selected as a basis for the simulations, and five new representative rainstorm patterns were then created by rearranging the base pattern.
Rainfall occurs primarily during the summer, from June to September, as part of the East Asian monsoon (Kim et al., 2015a). Jinbu, in the Pyeongchang District, lies within one of the rainiest areas in Korea. The typical soil cover is shallow (less than 2 m) across the study area. Consequently, rainfalls with short duration and high intensity often cause considerable variations in groundwater pressure at shallow depths. Additionally, reviewing large landslides on natural terrain in Korea since 1990, Kim & Chae (2009) concluded that landslide occurrence depended more on rainfall intensity than rainfall duration. Also, it should be noted that TRIGRS is more efficient at determining groundwater pressure variation earlier during a storm. Through events of longer duration, estimation of groundwater pressure may be erroneous once lateral flow begins in response to the storm (Baum et al., 2008). Therefore, in this study, a short-lived rainstorm event that resulted in severe landslides in the study area is selected for analyzing.
The 2006 rainstorm event was selected by reviewing all the rainfall-triggered landslide events in the study area based on the above conditions. The chosen rainstorm began at 00:00 on 15 July 2006 and ended at 16:00 on the same day.
Due to this event, more than 1200 shallow landslides with many debris flows were recorded. The total rainfall amount and maximum rainfall intensity of the triggering event were almost 500 mm/day and about 45 mm/h, respectively (Korea
Meteorological Administration). Fig. 8 shows the measured 30-min rainfall intensity in the study area before, during, and after the sliding event occurred.
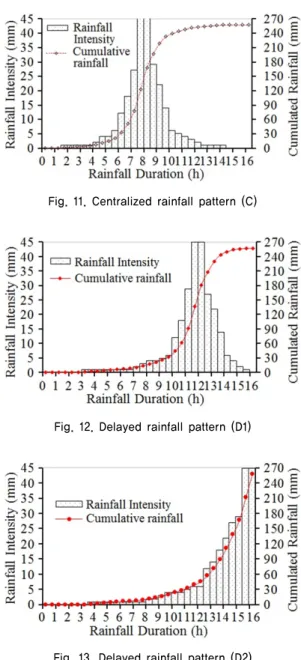
Five representative patterns were created by rearranging the histogram for this historical rainstorm event, so, each has the same cumulative rainfall amount as well as the intensity components. Figures 9 to 13 show all five of these created patterns, based on the real selected 2006 rainfall event. It can be noted that the five representative rainfall patterns have the same 16 h-duration and the same maximum rainfall intensity of 45 mm per 30 minutes as the real event. For each pattern, the intensity components have simply been rearranged so that they look like the corresponding typical rainfall patterns. Thus, the advanced patterns (A1 and A2)
Fig. 11. Centralized rainfall pattern (C)
Fig. 12. Delayed rainfall pattern (D1)
Fig. 13. Delayed rainfall pattern (D2)
have high intensity during the early stages of the event, the centralized pattern has the maximum intensity falling in the middle of the total rainfall duration, and the delayed patterns (D1 and D2) have high intensities at the end of the event.
In addition, as can be seen, the real rainfall pattern (Fig. 8) is quite similar to pattern D1. Therefore it is also considered to analyze in some cases for comparison.
3.6 Forest Properties and the Role of Tree Root Cohesion on Soil Reinforcement
Trees can have significant effects on the development of shallow landslides during severe storm events in steep, forested watersheds (Kim et al., 2013; Schwarz et al., 2013). Tree roots are inherently necessary for soil to build up and stay in place in steep hollows (D’Odorio & Fagherazzi, 2003).
Landslide scars often reveal broken root tendrils, suggesting that the tensile strength of the roots was mobilized during failure of the ground (Schmidt et al., 2001). Tree roots are known to reinforce soil by increasing soil shear strength.
However, Soil samples collected for laboratory testing often do not reflect the root cohesion in situ (Kim et al., 2015b) and few studies have quantified soil reinforcement by tree roots because of some experimental difficulties (Kim et al., 2010). Quantitatively analyzing the soil reinforcement caused by roots has many challenges because root structures are easy to be destroyed during the assessment.
Pyeongchang is a forested area, comprising 37.1% of coniferous forest, 39.7% of deciduous forest, and 23.2% of mixed forest cover. The crown coverage was mostly medium or dense, and the study area was covered by Korean pine (Pinus koraiensis) and Japanese larch (Larix kaempferi), which were two common plantation species of Korea (Kim et al., 2011). The influence of tree roots is taken into account in this study by simply adding an apparent cohesion to the soil strength. This apparent cohesion is defined based on the condition in reality that the entire area was stable before the rainstorm event, and in the simulation by the non-existence of unstable cells (cells with Fs <1) in the initial conditions.
By applying a trial-and-error method, in the TRIGRS model, the total cohesion (soil cohesion + root cohesion) was increased until there were no unstable cells in the Fs map during the initial conditions. In this way, the lower limit root cohesion was found to be 3.0 kPa. Although more studies should be conducted to support this conclusion, however, as the root cohesion value in this study only helps the predicted stability maps to be more realistic, and it is also not the primary objective. Therefore, the assumption of tree root cohesion above can be accepted.
4. Results and Discussion
TRIGRS model is applied to analyze five selected rainfall patterns with the same background conditions. The results of these models are evaluated to assess the influence of different rainstorm patterns on the response of the pressure head, the stability conditions, and the cumulative rainstorm threshold of the soil cover layer in the study area.
Fig. 14. Percentages of cells with the pressure head larger than 0.86 m, compared with rainfall duration
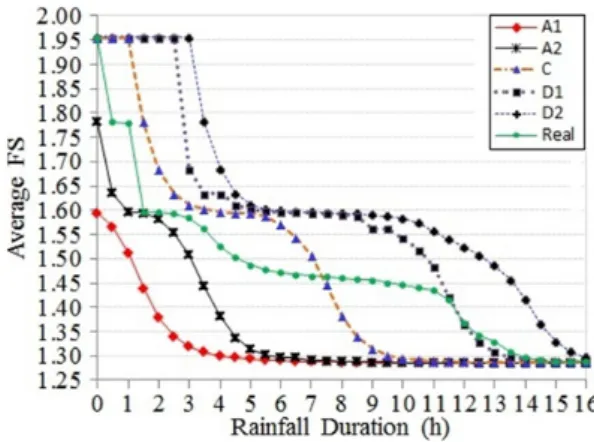
Fig. 15. Relationship between average Fs and rainfall duration
Fig. 16. Relationship between the percentage of unstable cells and rainfall duration
4.1 Evaluating the Effect of Rainfall Patterns on the Pressure Head
In this step, pressure head results calculated by TRIGRS, corresponding to the five selected rainstorm patterns were used for evaluation. The pressure head values at the depth corresponding to the minimum factor of safety for each cell on the six maps (including the real pattern) at all time step were analyzed. In this case, average soil thickness value over the entire area (0.86 m) were used as a reference value for comparing. Fig. 14 illustrates the change in the percentage of cells that had a greater pressure head than the average soil thickness with time, from the six different rainstorm patterns. As can be seen, under the influence of any rainfall, the pressure head increased as time elapsed, and except the Delayed rainfall pattern D2, all other patterns had almost the same start and end values. However, the time to reach the maximum value and their variation under each scenario differed significantly.
Advanced patterns A1 and A2 reached the highest percentage of cells in the shortest time of around 8 hr. For the centralized pattern, the time was much longer, taking around 12 hr to reach the critical condition. The time required for pattern D1 to arrive at the peak value was almost 16 hr, which was equal to the total rainfall duration. Among all five studied cases, only the delayed pattern D2 had a smaller number of cells with pressure head larger than 0.86 m. The response of pressure head on the real rainfall is quite similar to its response on pattern D1 as the two rainfalls are fairly common.
Therefore, the conclusion is that rainfall pattern with low intensity during the early stage of the duration may generate the least effect.
4.2 Evaluating the Influence of Rainfall Patterns on Stability Conditions
In order to assess the effect of rainfall patterns on the occurrence of shallow landslides, Fs maps corresponding to the five studied rainstorm patterns those simulated by TRIGRS were evaluated and analyzed. Figure 15 illustrates changes in the average Fs values under the five studied patterns and the real scenario with rainfall duration. As can be seen from this figure, a similar trend to that observed in the pressure head variation could be identified in the Fs analysis. The advanced patterns (A1 and A2) are considered the most critical cases as they need the shortest time to attain the smallest values, with 5 hr for A1 and 8 hr for A2. Following this, the centralized (C) (12 h), and then delayed (D1 (14h)) and D2 (16 h) patterns reached minimum values in progressively longer period.
Figure 16 represents the changes in the proportion of unstable cells in the Fs maps, corresponding to the five selected rainstorm patterns and the real pattern with rainfall duration. All five cases produce almost the same numbers
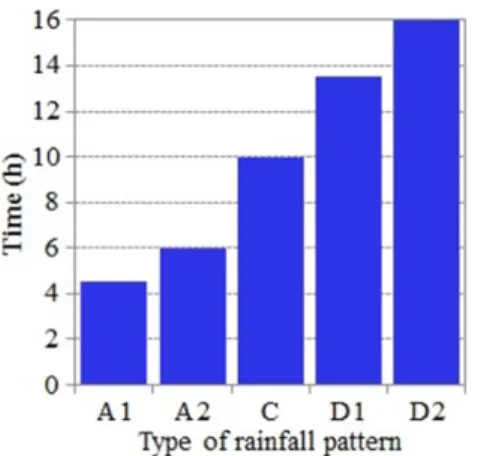
Fig. 17. Graph showing the time to reach the maximum percentage of unstable cells
Fig. 18. Graph showing the cumulative rainfall threshold of different rainfall patterns
of unstable cells at the end of the rainfall event. However, the time to reach these maximum numbers differs significantly.
Fig. 17 illustrates the time on which the percentage of unstable cells reach maximum. As can be seen, the time corresponding to each pattern is quite close to the occurrence of its peak rainfall intensity. Therefore, depending on the ratio between the maximum rainfall intensity and the saturated hydraulic conductivity of soil (Ksat) (it is about 2.5 times in this case), there might be a correlation between the time when the maximum rainfall intensity occurs and when the percentage of unstable cell is the largest. So, one can conclude that shallow landslide is strongly impacted not only by the amount and duration of the rain but also its pattern or the variation of rainfall intensity with time.
4.3 Evaluation of the Influence of Rainfall Patterns on the Cumulative Rainstorm Threshold Under the same background conditions, the cumulative rainfall thresholds corresponding to the five studied rainstorm patterns were also defined in this study. By calculating the
cumulative rainfall for the time at which the maximum number of unstable cells was reached, or when the highest percentage of cells had a pressure head greater than 0.86 m, the critical cumulative rainfall thresholds from the five representative rainstorm patterns were determined (Fig. 18).
From this, it can be clearly observed that the cumulative threshold of A1 is the smallest, followed by A2, C, D1, and D2. Thus, of all five rainstorm patterns, advanced or left- skewed rainfall patterns represent the greatest threat to the stability of slopes in the study area.
This finding can be explained by the variation of the infiltration capacity of soil with time as it tends to decrease as the rainfall advances (Jia et al., 2009). When the surface layer is dry, the infiltration capacity is high due to the steep matric suction gradient. Therefore, most of the rainfall will infiltrate into the soil to form underground flow, and the exceeded part will form runoff. So, in scenarios with a large early peak (pattern A1 and A2) rainfall intensity, more water can infiltrate into the ground surface, and less runoff is formed. This allows more critical groundwater pressure head and slope stability condition to develop. On the contrary, for other patterns (C, D1 and D2) as the infiltration capacity reduces with time, so it is likely that more runoff will be created.
5. Conclusion
In this study, the initially unsaturated watershed in Jinbu.
Mt subjected to different rainfall conditions was investigated.
Five typical rainstorm patterns were constructed by rearranging the intensities of a real critical rainstorm event that occurred in 2006. The analysis results indicate that the groundwater pressure head and the factor of safety are strongly connected with the rainfall pattern. The sooner the peak rainfall intensity occurs, the smaller the cumulative rainfall threshold, and the shorter the time until landslide occurrence. Left-skewed rainfall patterns were found to have a greater effect on the build-up of groundwater pressure head and landslide occurrence; they also produce the smallest rainfall duration thresholds for landslide initiation. Moreover, with the increase in the cumulative rainfall amount, the corresponding groundwater pressure head, and Fs values reduce to a constant level.
With a constant rainfall amount and duration, the advanced
storm pattern A1 is the most critical of the five analyzed cases.
It has the highest potential to induce significant groundwater pressure head and ultimate landslide occurrence. This conclusion can be explained by Ng & Tung (2001), is that the high hydraulic gradient induced by the advanced storm pattern during the first several hours of intense rainfall results in a higher infiltration rate than for the other storm patterns.
Thus, predicting rainfall-induced shallow landslide problems, rainfall amounts and durations are not the only controlling factors, the rainstorm pattern also plays a significant role in determining the timing and extent of the landslide. As such, rainstorm intensity patterns should be considered in any rainfall-induced landslide modeling problems.
This study also shows that there might be a relationship between the time of maximum rainfall intensity and the time when the unstable area is the largest. However, as only one scenario about the ratio between the maximum rainfall intensity and the hydraulic conductivity is considered. Also, our simulated results may be affected by limitations imposed by simplifying assumptions (infiltration is in 1D), shortcoming in the underlying theories (slope stability assessment is based on infinite slope model), and uncertainties related to the initial conditions as well as the input data. Therefore, more studies are needed to support the above conclusion. In addition, the uncertainty assessment and data assimilation with observed data are our next research plans.
Acknowledgement
This subject is supported by Korea Ministry of Environment (MOE) as “GAIA Program-2014000 540005”.
References
1. Anderson, S. and Riemer, M. (1995), Collapse of saturated soil due to reduction in confinement, Journal of Geotechnical Engineering, Vol. 121, No. 2, pp. 216~220.
2. Baum, B. R. L., Savage, W. Z. and Godt, J. W. (2008), TRIGRS-A Fortran program for transient rainfall infiltration and grid-based regional slope-stability analysis, Version 2.0.
Colorado, U.S. Geological Survey, pp. 1~26.
3. Baum, R. L., Godt, J. W. and Savage, W. Z. (2010), Estimating the timing and location of shallow rainfall-induced landslides using a model for transient, unsaturated infiltration, Journal of Geophysical Research, Vol. 115, No. 3, pp. 1~26.
4. Baum, R. L., Savage, W. Z. and Godt, J. (2002), TRIGRS-A Fortran program for transient rainfall infiltration and grid-based regional slope stability analysis, Version 1.0, Denver, U.A.
Geological Survey, pp. 1~61.
5. Chae, B. G. and Kim, M. (2012), Suggestion of a method for landslide early warning using the change in the volumetric water content gradient due to rainfall infiltration. Env. Earth Sci, Vol. 66, No. 7, pp. 1973~1986.
6. Chang, H. and Kwon, W. T. (2007), Spatial variations of summer precipitation trends in South Korea, 1973-2005, Environ. Res.
Lett, Vol. 2, No. 4, pp. 1~9.
7. De Lima, J. L. M. P. and Singh, V. P. (2002), The influence of the pattern of moving rainstorms on overland flow, Advances in Water Resources, Vol. 25, No. 7, pp. 817~828.
8. D’Odorico, P. and Fagherazzi, S. (2003), A probabilistic model of rainfall-triggered shallow landslides in hollows: a long-term analysis, Water Resources Research, Vol. 39, No. 9, pp. 1~14.
9. Iverson, R. M. (2000), Landslide triggering by rain infiltration, Water Resources Research, Vol. 36, No. 7, pp. 1897~1910.
10. Jia, G. W., Zhan, T. L. T., Chen, Y. M. and Fredlund, D. G.
(2009), Influence of rainfall pattern on the infiltration into landslide earthen final cover, Advances in Environmental Geo- technics, Chen, Y., Tang, X. and Zhan, L. (Editor), New York, Springer, 1, pp. 641~645.
11. Jung, H. S., Choi, Y., Oh J. H. and Lim, G. H. (2002), Recent trends in temperature and precipitation over South Korea, International Journal of Climatology, Vol. 22, No. 11, pp.
1327~1337.
12. Kim, D., Ho, L. S. and Im, S. (2011), Analysis of the effect of tree roots on soil reinforcement considering its spatial distribution, Korean Env Tech, Vol. 14, No. 4, pp. 41~54.
13. Kim, D., Im, S., Lee, C. and Woo, C. (2013), Modeling the contribution of trees to shallow landslide development in a steep, forested watershed, Ecological Engineering, Vol. 61, pp.
658~668.
14. Kim, D., Im, S. and Lee, S. H. (2010), Predicting the rainfall- triggered landslides in a forested mountain region using TRIGRS model, J. Mt. Science, Vol. 7, No. 1, pp. 83~91.
15. Kim, D., Lee, E. J., Ahn, B. and Im, S. (2014), Landslide susceptibility mapping using a grid-based infiltration transient model in mountainous regions, Landslide Science for a safer geoenvironment, K. Sassa, P. Canuti and Y. Yin. London, Springer International, Vol. 2, pp. 425~430.
16. Kim, J. (2012), Hazard area mapping during extreme rainstorms in South Korean mountain, Department of Civil and Environmental Engineering, Colorado, Colorado State University. Ph.D. Thesis, pp. 1~145.
17. Kim, M. S., Onda, Y. and Kim, J. K. (2015a), Improvement of shallow landslide prediction accuracy using soil parameterization for a granite area in South Korea, Nat. Hazards Earth Syst.
Sci, Vol. 3, No. 1, pp. 227~267.
18. Kim, M. S., Onda, Y., Kim, J. K. and Kim, S. W. (2015b), Effect of topography and soil parameterisation representing soil thicknesses on shallow landslide modelling, Quaternary International, Vol. 384, p. 91~106.
19. Kim, W. Y. and Chae B. G. (2009), Characteristics of rainfall, geology and failure geometry of the landslide areas on natural terrains, Korea, The Journal of Engineering Geology, Vol. 19, No. 3, pp. 331~344.
20. Lee, J. H. and Park H. K. (2014), GIS-Based probabilistic analysis of shallow landslide susceptibility using a transient hydrogeological model and monte carlo simulation, Landslide Science for a safer geoenvironment, Vol. 2, pp. 451~456.
21. Lee, M. J., Choi, J., Park, I. and Lee, S. (2012a), Ensemble- based landslide susceptibility maps in Jinbu area, Korea, Environ Earth Sci, Vol. 67, No. 1, pp. 23~37.
22. Lee, S., Hwang, J. and Park, I. (2012b), Application of data- driven evidential belief functions to landslide susceptibility mapping in Jinbu, Korea, Catena, Vol. 100, pp. 15~30.
23. Lee, S., Song, K. Y., Oh, H. J. and Choi, J. (2012c), Detection of landslides using web-based aerial photographs and landslide susceptibility mapping using geospatial analysis, International Journal of Remote Sensing, Vol. 33, No. 16, pp. 493~4966.
24. Lee, S. G. and Hencher, R. S. (2014), Recent extreme rainfall- induced landslides and governments countermeasures in Korea, Landslide Science for a safer geoenvironment, Sassa, K, Canuti, P and Yin, Y (Editor), Switzerland, Springer, pp. 357~361.
25. Lee, S. G., Lee, K. S., Villemin, D. C. and Hencher, R. S.
(2008), Characteristics of landslides related to various rock types in Korea, Landslides and Engineered Slopes, from the past to the future, Taylor & Francis Group, pp. 427~433.
26. Mukhlisin, M. and Taha, M. R. (2012), Numerical model of antecedent rainfall effect on slope stability at a hillslope of weathered granitic soil formation, Journal of Geo. Society of India, Vol. 79, No. 5, pp. 525~531.
27. Ng, C. W. W. and Shi, Q. (1998), A numerical investigation of the stability of unsaturated soil slopes subjected to transient seepage, Computers and Geotechnics, Vol. 22, No. 1, pp. 1~28.
28. Ng, C. W. W. and Tung Y. K. (2001), Three-dimensional numerical investigations of groundwater responses in an unsaturated slope subjected to various rainfall patterns, Canadian Geotechnical Journal, Vol. 38, No. 5, pp. 1049~1062.
29. Park, D. W., Nikhil, N. V. and Lee, S. R. (2013a), Landslide and debris flow susceptibility zonation using TRIGRS for the 2011 Seoul landslide event, Nat. Hazards Earth Syst. Sci, Vol.
1, No. 3, pp. 2547~2587.
30. Park, H. J., Lee, J. H. and Woo, I. (2013b), Assessment of
rainfall-induced shallow landslide susceptibility using a GIS- based probabilistic approach, Engineering Geology, Vol. 161, pp. 1~15.
31. Rahardjo, H., Ong, T. H., Rezaur, R. B. and Leong, E. C. (2007), Factors controlling instability of homogeneous soil slopes under rainfall, Journal of Geotechnical and Geoenvironmental Engineer, Vol. 133, No. 12, pp. 1532~1543.
32. Rahimi, A., Rahardjo, H. and Leong, E. C. (2011), Effect of antecedent rainfall patterns on rainfall-induced slope failure, Journal of Geotechnical and Geoenvironmental Engineering, Vol. 137, No. 5, pp. 483~491.
33. Raia, S., Alvioli, M., Rossi, M., Baum, R. L., Godt, J. W. and Guzzetti, F. (2014), Improving predictive power of physically based rainfall-induced shallow landslide models: a probabilistic approach, Geoscientific model development, Vol. 7, pp. 495~514.
34. Schmidt, K. M., Roering, J. J., Stock, J. D., Dietrich, W. E., Montgomery, D. R. and Schaub, T. (2001), The variability of root cohesion as an influence on shallow landslide susceptibility in the Oregon Coast Range. Can. Geotech, Vol. 38, pp. 995~1024.
35. Schwarz, M., Giadrossich, F. and Cohen, D. (2013), Modeling root reinforcement using root-failure weibull survival function, Hydrol. Earth Syst. Sci, Vol. 17, No. 11, pp. 4367~4377.
36. Tsai, T. L. (2008), The influence of rainstorm pattern on shallow landslide, Environ Geol, Vol. 53, No. 7, pp. 1536~1569.
37. Tsai, T. L. and Wang J. K. (2010), Examination of influences of rainfall patterns on shallow landslides due to dissipation of matric suction, Environ Earth Sci, Vol. 63, No. 1, pp. 65~75.
38. Viet, T. T., Thu, T. M., Lee, G., Oh, S. and Van, N. T. H.
(2015), Effect of extreme rainfall on cut slope stability: case study in Yen Bai city, Viet Nam, Vol. 16, No. 4, pp. 23~32.
39. Viet, T. T., Lee, G. H., Thu, T. M. and An H. U. (2016), Effect of digital elevation model resolution of shallow landslide modelling using TRIGRS, Natural Hazard Review, doi: 10.1061/
(ASCE)NH.1527-6996.0000233, 04016011, 1-14.
40. Yune, C. Y., Chae, Y. K., Pair, J., Kim, G., Lee, S.W. and Seo, H. S. (2013), Debris flow in metropolitan area - 2011 Seoul debris flow, J. Mt. Science, Vol. 10, No. 2, pp. 199~206.