Environmental Science
Vol. 33, No. 3, pp. 161-171, August, 2017 https://doi.org/10.7747/JFES.2017.33.3.161
Local Climate Mediates Spatial and Temporal Variation in Carabid Beetle Communities on Hyangnobong, Korea
Yong Hwan Park1, Tae Woong Jang2, Jong Cheol Jeong3, Hee Mun Chae2 and Jong Kuk Kim2,*
1Graduate School of Human Development and Environment, Kobe University, Nada, Kobe 657-8501, Japan
2College of Forest and Environmental Sciences, Kangwon National University, Chuncheon 24341, Republic of Korea
3Korea National Park Research Institute, Wonju 26441, Republic of Korea
Abstract
Global environmental changes have the capacity to make dramatic alterations to floral and faunal composition, and elucidation of the mechanism is important for predicting its outcomes. Studies on global climate change have traditionally focused on statistical summaries within relatively wide scales of spatial and temporal changes, and less attention has been paid to variability in microclimates across spatial and temporal scales. Microclimate is a suite of climatic conditions measured in local areas near the earth’s surface. Environmental variables in microclimatic scale can be critical for the ecology of organisms inhabiting there. Here we examine the effect of spatial and temporal changes in microclimates on those of carabid beetle communities in Hyangnobong, Korea. We found that climatic variables and the patterns of annual changes in carabid beetle communities differed among sites even within the single mountain system. Our results indicate the importance of temporal survey of communities at local scales, which is expected to reveal an additional fraction of variation in communities and underlying processes that has been overlooked in studies of global community patterns and changes.
Key Words: carabid beetle, community structure, environmental change, microclimate, species richness
Received: June 15, 2017. Revised: July 12, 2017. Accepted: July 12, 2017.
Corresponding author: Jong Kuk Kim
College of Forest and Environmental Sciences, Kangwon National University, Chuncheon 24341, Republic of Korea Tel: 82-33-250-8363, Fax: 82-33-259-5617, E-mail: [email protected]
Introduction
Global environmental changes have the capacity to make dramatic alterations to floral and faunal composition, spe- cies dominance, and the structure, function and distri- bution of ecosystems, and those processes may cause species extinction (Peters 1985; Busby 1988; Main 1988; Cohn 1989; Fajer 1989; Greenwood and Boardman 1989; Man- sergh and Bennett 1989; Botkin et al. 1991; Dennis and Shreeve 1991; Woodward and Rochefort 1991). This is the reason why enhanced greenhouse climate change has pre-
sented major problems for the survival of species (Jackson et al. 2009; Loarie et al. 2009; Dawson et al. 2011; Bellard et al. 2012). Thus, understanding the effects of global warming has become an important issue of the preservation of the global environment and biodiversity.
Studies on global climate change have traditionally fo- cused based on statistical summaries within relatively wide scales of spatial and temporal changes, and less attention has been paid to variability in microclimates across spatial and temporal scales. Microclimate is a suite of climatic con- ditions measured in localized areas near the earth’s surface
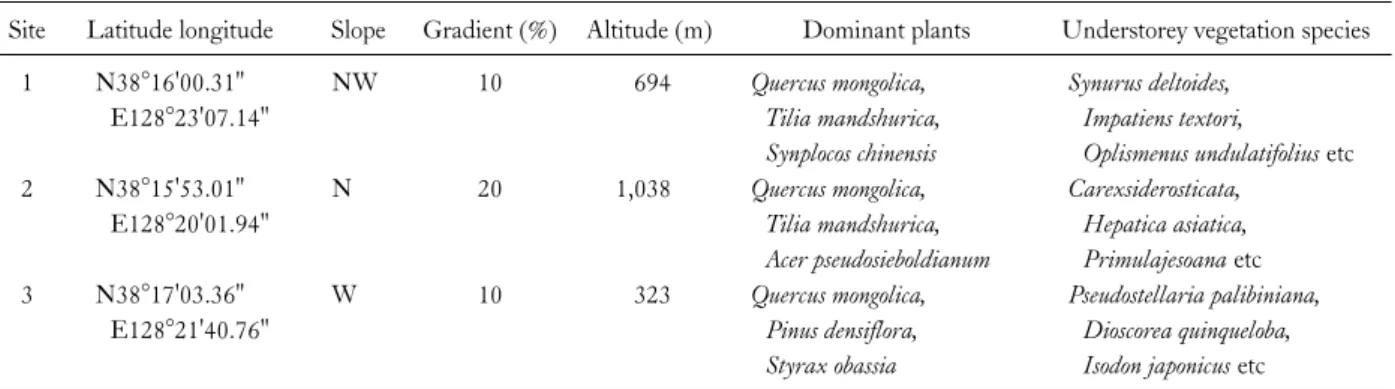
Table 1. Habitat and environmental information on the study sites on Hyangnobong, Korea
Site Latitude longitude Slope Gradient (%) Altitude (m) Dominant plants Understorey vegetation species 1 N38°16'00.31"
E128°23'07.14"
NW 10 694 Quercus mongolica,
Tilia mandshurica, Synplocos chinensis
Synurus deltoides, Impatiens textori,
Oplismenus undulatifolius etc 2 N38°15'53.01"
E128°20'01.94"
N 20 1,038 Quercus mongolica,
Tilia mandshurica, Acer pseudosieboldianum
Carexsiderosticata, Hepatica asiatica, Primulajesoana etc 3 N38°17'03.36"
E128°21'40.76"
W 10 323 Quercus mongolica,
Pinus densiflora, Styrax obassia
Pseudostellaria palibiniana, Dioscorea quinqueloba, Isodon japonicus etc (Geiger 1965; Chen et al. 1999). Environmental variables
in microclimatic scale include temperature, light, wind speed, and moisture, being critical for the ecology of organ- isms and providing meaningful indicators for their habitat selection and other activities. In seminal studies, Shirley (1929, 1945) emphasized microclimate as a determinant of ecological patterns in both plant and animal communities, and as a driver of such processes by influencing the growth and mortality of organisms. Relationships between micro- climate and biological processes are complex and often non- linear (Chen et al. 1999; Eyre et al. 2005; Gillingham et al.
2012). The microclimatic environment and its relative im- portance for driving biological processes can vary with spa- tial and temporal scales because ecosystem structure and function are scale dependent (Meentemeyer and Box 1987). Thus, relationships between microclimate and struc- tural landscape features or ecosystem processes developed at any single scale of study may not be applicable at other scales (Levin 1992). Additionally, global climatic change and its effects on global to local ecological processes are ongoing. Hence, continuous research is important to ad- dress this issue, although most studies have examined only a snapshot of these processes based on data for one or a few years (Jung et al. 2012).
Examining the relative importance of environmental fac- tors for faunal composition in different regions is a pre- requisite for understanding the interactions between re- gional species pools and local communities, delineating re- gions for environmental assessment and conservation, and predicting the effects of global change on species dis- tributions at large spatial scales. Even the most mobile spe- cies usually experience a potentially selective series of local
environments, rather than the ‘average’ conditions of a much larger area. Here we examine the effect of spatial and temporal changes in microclimates on carabid beetle co- mmunities. Carabid beetles (Coleoptera: Carabidae) are good environmental indicators due to the fact that they are likely to be affected by disturbance in local habitat because they are often flightless and have low dispersal ability (Thiele 1977; den Boer et al. 1980; Ishitani et al. 1997;
Rainio and Niemelä 2003; Pearce and Venier 2006;
Maleque et al. 2009). Beetles are composed with 40% of to- tal insects, which comprises approximately 0.8-1.2 million species. Coleoptera is diverse in size and feeding ecology, and plays an important role as primary and secondary con- sumers in the ecosystem. Carabid beetles are mainly carniv- orous, with some omnivorous and plant-feeding species.
Some carabid species live on the tree, but most species ex- ercise food crawling on the ground surface. Thus, carabid beetles occupy an important position within the ecosystem as predators to prey on small terrestrial arthropods (Pausch 1979; Kubota et al. 2001; Holland 2002; Sunderland 2002). These species mainly live in forest, grassland or wet- land, and their inhabitations are affected by geographical and seasonal variation in environment, biological commun- ity, vegetation, and biomass of litter layer therein (Luff 1975; Thiele 1977; Luff et al. 1989).
The aim of this study is to examine 1) whether and how carabid beetle communities temporally change within sites, and 2) how it differs between sites, in a local to regional scale. Our target is restricted to one mountain area, which differ exhibits variation in vegetation, slope direction and altitude. The within-site change and among-site difference in communities are expected to be attributed to different re-
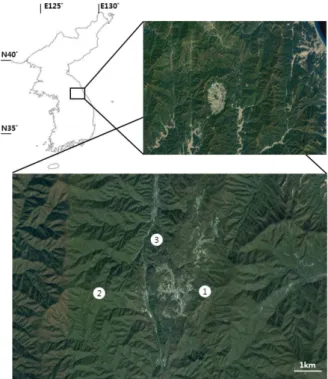
Fig. 1. Locations of the three study sites on Hyangrobong, Korea.
sponses to local microclimates. Based on the results, we will discuss about the importance of spatial and temporal varia- tion in microclimates in studies of global environmental change.
Materials and Methods
Study area and field survey
We conducted field surveys on Hyangnobong, Korea, in 2 months of each year when adult carabid beetles are active (July and August) for 5 consecutive years. This sampling was arranged to capture both spring and autumn breeders in limited opportunities within the national park. Spring breeders are active in Korean mountains before July, but most of them continue their activities until autumn. Autumn breeders start their activities from June or July and end in September or October (e.g. Kim and Lee 1992a). The average of temperature in August, February and annual precipitation in the study area during 5 years were 17.5°C, -14.5°C, 1,402.2 mm respectively. The three study sites were within the Hyangnobong (Table 1; Fig. 1) and were used with permission from Baekdudaegan Mountain Range
Ecological Monitoring (permit no. C1008923-01-01). Site 1 was on a north-west- facing slope (steepness=10°, 694 m above sea level), where trees were relatively tall and the for- est canopy was mostly closed. Site 2, the highest elevation site, was on the ridge of a north-facing slope (20°, 1,038 m), where trees were relatively short and the forest canopy was thin and sporadically opened. Site 3 was on a west-facing slope (10°, 323 m), where, as in Site 1, trees were relatively tall.
Environmental measurements were obtained using HOBO data loggers (Onset Computer Corporation) to re- cord air temperature, air humidity, light intensity and soil temperature hourly from June 2010 to September 2015.
Each logger was attached to a tree trunk 120 cm above the ground. Soil temperature was measured5 cm underground.
The data were downloaded directly from each logger every month. This system cannot measure precipitation, and gen- erally it is difficult to measure it hourly, although it is an im- portant environmental parameter to predict carabid beetle communities. We expected that air humidity is closely re- lated to the precipitation and can be a surrogate.
To capture community composition at each study site, we collected carabid beetles using pitfall traps (plastic cups 7.0 cm in diameter and 8.0 cm deep) containing an attractant (powder of silkworm pupa) (Löveiand Sunderland 1996;
Holland 2002; Heyborne et al. 2003). Two hundred traps were set in two or three lines at 2 m intervals at each study site in each month and year, and beetles were collected 24 hours later. All the beetles caught in the 200 traps were combined to form the sample for that site, month and year.
The exact position of the trap lines was changed arbitrarily within study sites each time to avoid any effects of previous captures. All carabid beetles that were captured were count- ed and identified to species, except for one Pterostichus and two Synuchus species that were regarded only as mor- phospecies. Our field survey resulted in 30 samples of cara- bid beetle communities: each of three sites was sampled in 2 months in each of 5 years.
Analysis of environmental factors
To summarise the microclimate data, we first calculated daily means from the data that had been collected at hourly intervals in each site. Then, 12 environmental variables were calculated for each year: summer mean air temper- ature (S.tem), winter mean air temperature (W.tem),
summer highest mean air temperature (S.H.tem), winter highest mean air temperature (W.H.tem), summer lowest mean air temperature (S.L.tem), winter lowest mean air temperature (W.L.tem), summer mean air humidity (S.hum), winter mean air humidity (W.hum), summer mean illumi- nation (S.illu), winter mean illumination (W.illu), summer mean soil temperature (S.Soil) and winter mean soil tem- perature (W.Soil). Winter variables were calculated from the data in the December to February period before the month of sampling. Summer variables were calculated from the data collected in the period from June to the date of sampling. We focused on summer and winter microclim- ates, because, for carabid beetles in this region, summer conditions may be important for reproduction and pop- ulation growth, and winter conditions may be important for survival during hibernation (Kim and Lee 1992a, 1992b).
To examine directional trends in climate change (e.g., en- vironmental warming) in our observation period, as well as local differences between study sites, we analysed each of the 12 climatic variables in turn using generalised linear models (GLMs). In this analysis, we used1 of 12 climatic variables as the dependent variable, and site and year (as a continuous variable) as independent variables. Identity-link and normal distribution were assumed, and likelihood ratio tests were used to examine the statistical significance of parameters. A significant effect of year was expected if di- rectional climate change occurred.
Analysis of beetle communities
Firstly, we examined relationships among variations in the carabid beetle community composition over the months and years of sampling and the 12 environmental variables by means of canonical correspondence analysis (CCA). Sta- tistical significance of the effect of the environmental meas- ures was examined by a randomisation test based on 999 pseudo-replications. We calculated the scores of the CCA axes (CCA1 and CCA2) for measures of community com- position. This analysis was performed using the function vegan in the software package R 3.1.3 (R Development Core Team 2015).
Secondly, we examined whether temporal changes in car- abid beetle communities differed between sites. To summa- rise the composition of communities, we calculated five measures characterising the community for each sample:
species richness (the number of species), individual abun- dance (the total number of individuals), diversity index (Shannon-Wiener 1963), CCA1 and CCA2. We constructed GLMs with one of four measures of community composi- tion as a dependent variable, and with site, year (as a catego- rical variable) and their interaction as independent varia- bles. Log-link and Poisson distribution were used for count data (species richness and individual abundance); iden- tity-link and normal distribution were used for metric data (diversity index and CCA scores). Statistical significance was based on likelihood ratio tests. Significant interactions were expected if the patterns of temporal change in com- munities differed between sites.
Thirdly, to determine which environmental factors influ- enced temporal changes in communities in each site, and al- so to confirm the results of the CCA, we constructed gener- alised linear mixed models (GLMMs) for each site, with one of the five measures of community composition as the dependent variable, and the 12 environmental factors as in- dependent variables. Since we sampled three times each year, year was included as a random term. Log-link and Poisson distribution were used for count data (species rich- ness and individual abundance); identity-link and normal distribution were used for metric data (diversity index and CCA scores). We used the automated model selection pro- cedure to run models for all possible combinations of the explanatory variables, and then selected the best-fitting models based on the Akaike Information Criterion (AIC), using ΔAIC<4 as a cut-off criterion to delineate a ‘top model set’ (Grueber et al. 2011). The relative importance of each predictor variable was calculated using the model average as a sum of the Akaike weights over all of the se- lected models in which the parameter of interest appeared.
These analyses were performed using the function lme4 and MuMIn in R.
Results
Spatial and temporal variation in environmental fac- tors
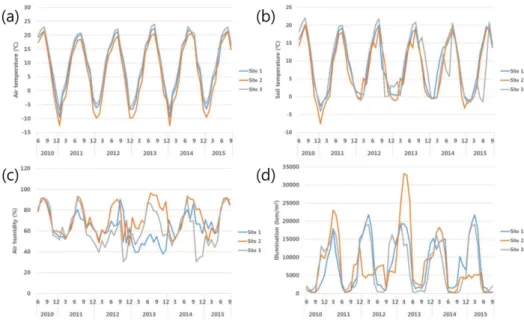
In all three study sites during the study period, the monthly means of air temperature, soil temperature and air humidity were highest in August and lowest in December or January (Fig. 2). Air temperature tended to be lowest in
Fig. 2. Temporal changes in mon- thly mean (a) air temperature, (b) soil temperature, (c) air humidity and (d) illumination in the three study sites on Hyangnobong, Korea.
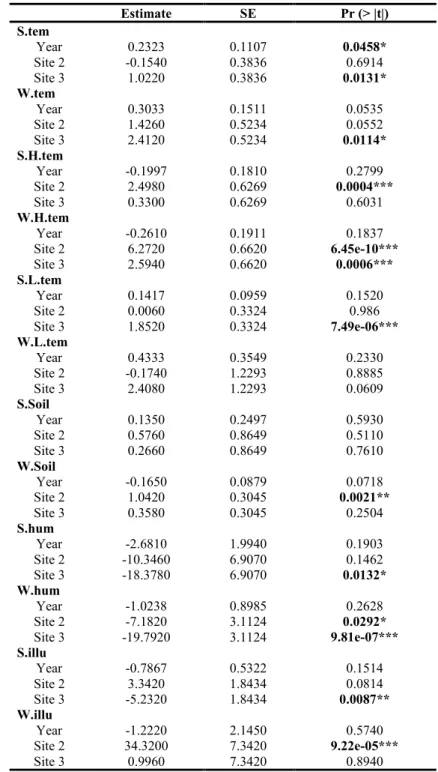
Site 2, followed by Sites 1 and 3 in winter. S.H.tem was sig- nificantly higher in Site 2, W.tem and S.L.tem were sig- nificantly higher in Site 3, and W.H.tem was significantly Site 2 and Site 3than in Site 1 (Table S1). This tendency was slight in soil temperature, but W.Soil was significantly higher in Site 2 than in Site 1 (Table S1). Air humidity tended to be lowest at Site 3, significantly so for W.hum (Table S1). Illumination was highest in December or January and lowest in August (Fig. 2), and was significantly higher in Site 2 and Site 3than in Site 1 (Table S1).We de- tected no significant directional trends in environmental changes in the 5 years of study (Table S1).
Spatial and temporal variation in beetle communities We collected 1,645 individual carabid beetles from three study sites. The beetles belonged to 23 species in 8 genera (Table S2). At the genus level, Carabus (790 individuals), Synuchus (359), and Pterostichus (349) were dominant.
The 30 community data-points (from three sites over 5 years, with repetitions in 2 months each year) were segre- gated along two CCA axes (Figs. 3, 4). Variation along the CCA1 axis was mainly determined by S.H.tem, W.tem, W.H.tem and W.hum. Variation along the CCA2 axis was by S.tem, W.L.tem, S.illu and W.illu (Fig. 3a). Total varia- tion between communities was significantly influenced by variation in S.tem, W.tem, S.illu and W.illu (Fig. 3a).
Synuchus species showed large variation in their preferred environments along the CCA1 axis, and Harpalus griseus (Panzer 1796) and Carabus mirabilissimus Ishikawa and Deuve 1982 were at the positive extreme of this axis (Fig.
3b). By contrast, Carabus and Pterostichus species showed large variation in their preferred environments along the CCA2 axis, and Trigonognatha coreana Tschitscherene 1985 and Carabus koreanus Reitter 1895 were at the pos- itive extreme of this axis (Fig. 3b).
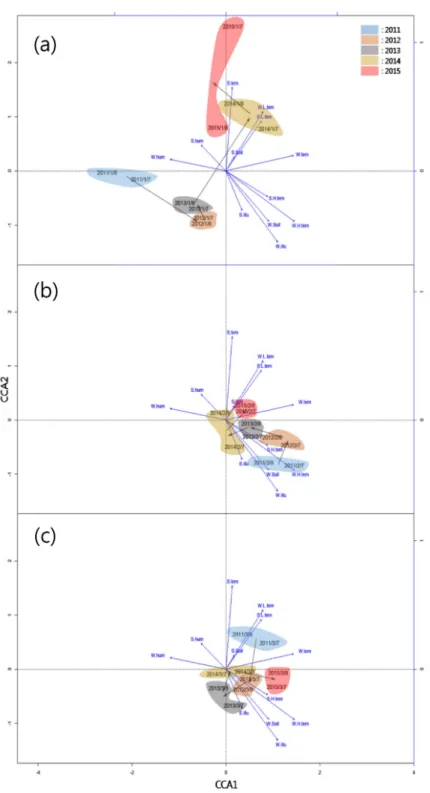
The patterns of temporal change in community composi- tion differed between sites. Community compositions in Sites 1 and 2 varied mostly along the CCA2 axis, and Site 3 var- ied mostly along the CCA1 axis (Fig. 4). Variation between the two monthly replications in each site within each year was less than that between years, indicating that this analy- sis mainly captured changes between years within each site.
Between-site differences in temporal community changes were confirmed by GLM analyses. Interaction terms be- tween site and year were significant for CCA1 (F8,23=4.02, p=0.009) and CCA2 (F8,23=2.76, p=0.04), but not sig- nificant for individual abundance (28=-5211.40, p=0.12), diversity index (F8,23=0.87, p=0.562) and species richness (28=-78.93, p=0.21).
Fig. 3. Canonical correspondence analysis (CCA) of associations be- tween environmental conditions and carabid beetle community co- mposition. (a) Directions of envi- ronmental variation; significant factors are shown as bold vectors.
(b) Environmental preference of species; species with fewer than ten individuals are not shown.
Environmental factors influencing beetle commun- ity within sites
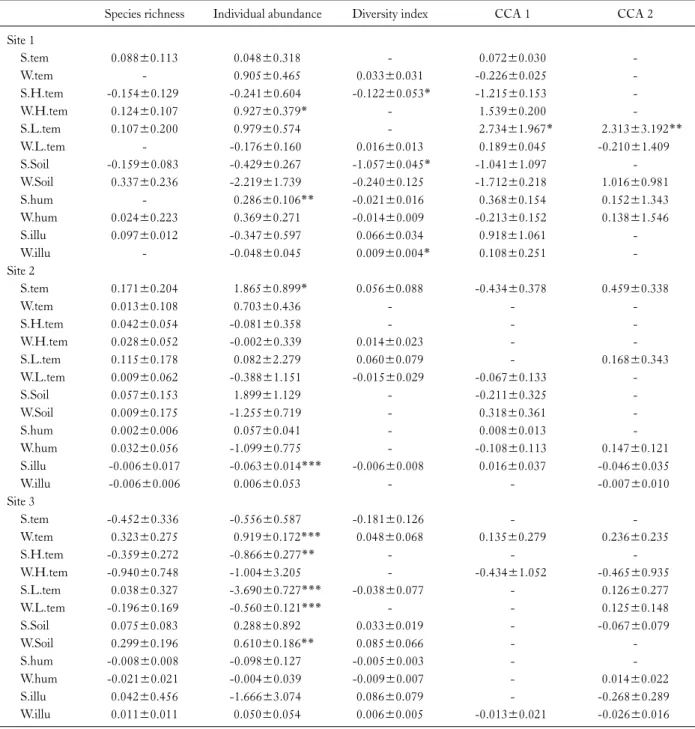
At Site 1, diversity index was significantly positively as- sociated with W.illu, and negatively associated with S.H.tem and S.Soil. Individual abundance was signi- ficantly positively associated with W.H.tem and S.hum.
The CCA1 and CCA2 score were significantly positively associated with S.L.tem (Table 2).
At Site 2, individual abundance was significantly pos- itively associated with S.tem, and negatively associated with S.illu (Table 2).
At Site 3, individual abundance was significantly pos- itively associated with W.tem and W.Soil, and negatively as- sociated with S.H.tem, S.L.tem and W.L.tem (Table 2).
Discussion
We revealed temporal changes in carabid beetle com- munities, the patterns of which differed between sites (Fig.
4) even within a relatively small area (Fig. 1). This could be explained by neutral processes via stochastic changes in communities and/or by deterministic processes via eco- logical and environmental factors affecting communities.
Fig. 4. Canonical correspondence analysis (CCA) of temporal varia- tions in communities in each study site. Black arrows are a rough in- dication of changes in carabid bee- tle community composition in each of the 5 years of sampling. *(a):
Site 1, (b) Site 2, (c) Site 3.
This study highlighted spatial and temporal variation in en- vironmental factors that is important for understanding changes in carabid beetle communities. We found evidence that microclimatic factors could be used to predict changes
in communities in all three of the study sites: the composi- tion of the ground beetle communities was influenced by various combinations of environmental factors (Table 2).
Additionally, these effects were not necessarily consistent
Table 2. Generalised linear mixed models (GLMMs) explaining temporal changes in carabid beetle communities in each of three study sites on Hyangnobong, Korea
Species richness Individual abundance Diversity index CCA 1 CCA 2 Site 1
S.tem 0.088±0.113 0.048±0.318 - 0.072±0.030 -
W.tem - 0.905±0.465 0.033±0.031 -0.226±0.025 -
S.H.tem -0.154±0.129 -0.241±0.604 -0.122±0.053* -1.215±0.153 -
W.H.tem 0.124±0.107 0.927±0.379* - 1.539±0.200 -
S.L.tem 0.107±0.200 0.979±0.574 - 2.734±1.967* 2.313±3.192**
W.L.tem - -0.176±0.160 0.016±0.013 0.189±0.045 -0.210±1.409
S.Soil -0.159±0.083 -0.429±0.267 -1.057±0.045* -1.041±1.097 -
W.Soil 0.337±0.236 -2.219±1.739 -0.240±0.125 -1.712±0.218 1.016±0.981
S.hum - 0.286±0.106** -0.021±0.016 0.368±0.154 0.152±1.343
W.hum 0.024±0.223 0.369±0.271 -0.014±0.009 -0.213±0.152 0.138±1.546
S.illu 0.097±0.012 -0.347±0.597 0.066±0.034 0.918±1.061 -
W.illu - -0.048±0.045 0.009±0.004* 0.108±0.251 -
Site 2
S.tem 0.171±0.204 1.865±0.899* 0.056±0.088 -0.434±0.378 0.459±0.338
W.tem 0.013±0.108 0.703±0.436 - - -
S.H.tem 0.042±0.054 -0.081±0.358 - - -
W.H.tem 0.028±0.052 -0.002±0.339 0.014±0.023 - -
S.L.tem 0.115±0.178 0.082±2.279 0.060±0.079 - 0.168±0.343
W.L.tem 0.009±0.062 -0.388±1.151 -0.015±0.029 -0.067±0.133 -
S.Soil 0.057±0.153 1.899±1.129 - -0.211±0.325 -
W.Soil 0.009±0.175 -1.255±0.719 - 0.318±0.361 -
S.hum 0.002±0.006 0.057±0.041 - 0.008±0.013 -
W.hum 0.032±0.056 -1.099±0.775 - -0.108±0.113 0.147±0.121
S.illu -0.006±0.017 -0.063±0.014*** -0.006±0.008 0.016±0.037 -0.046±0.035
W.illu -0.006±0.006 0.006±0.053 - - -0.007±0.010
Site 3
S.tem -0.452±0.336 -0.556±0.587 -0.181±0.126 - -
W.tem 0.323±0.275 0.919±0.172*** 0.048±0.068 0.135±0.279 0.236±0.235
S.H.tem -0.359±0.272 -0.866±0.277** - - -
W.H.tem -0.940±0.748 -1.004±3.205 - -0.434±1.052 -0.465±0.935
S.L.tem 0.038±0.327 -3.690±0.727*** -0.038±0.077 - 0.126±0.277
W.L.tem -0.196±0.169 -0.560±0.121*** - - 0.125±0.148
S.Soil 0.075±0.083 0.288±0.892 0.033±0.019 - -0.067±0.079
W.Soil 0.299±0.196 0.610±0.186** 0.085±0.066 - -
S.hum -0.008±0.008 -0.098±0.127 -0.005±0.003 - -
W.hum -0.021±0.021 -0.004±0.039 -0.009±0.007 - 0.014±0.022
S.illu 0.042±0.456 -1.666±3.074 0.086±0.079 - -0.268±0.289
W.illu 0.011±0.011 0.050±0.054 0.006±0.005 -0.013±0.021 -0.026±0.016
***p<0.001, **p<0.01, *p<0.05, -not included in final model.
between sites, and the directions of the effects (positive or negative) differed between sites. Thus, our results suggest that different modes of deterministic processes took place in each local community. Our results also provide support for
the notion that variation in the number of carabid beetle species and their abundance between years is to be ex- pected, not only in temporary habitats, but also in perma- nent habitats (den Boer 1986; Luff 1990).
Our results indicate that microclimatic variables influ- encing carabid beetle communities differed between sites within a relatively small area (Table 2). This finding is con- cordant with the notion that large-scale features such as cli- mate zonation determine the basic community structure of carabid beetles, while local-scale features such as habitat availability and landscape structure are more important in determining specific local species’ distribution (Penev 1996). Additionally, our results revealed that communities can change in response to site-specific environmental change.
For example, the carabid beetle community in Site 1 changed drastically in 2014 (Fig. 4); those in other sites did not. In that year, an exceptionally small number of Synucus and Pterostichus species collected at Site 1 (Table S2), and this may have been responsible for the observed large change in the community.
Why did responses to environmental factors differ be- tween communities at the different sites? Firstly, the differ- ences in the species composition of communities could play a role. Carabid beetle distribution depends on abiotic and biotic factors, involving temperature, humidity, food avail- ability, presence of competitors and life history (Lövei and Sunderland 1996), and the relationships can differ between species (Ribera et al. 2001). Thus, communities with differ- ent species compositions may respond differently to similar environmental changes. Secondly, communities with sim- ilar species compositions may respond differently to local environmental conditions, if local environments per se vary between sites. This means that a species experiences differ- ent environmental conditions in different sites. For exam- ple, the temperature in one site may be optimal for one spe- cies, but in another site it may be lower and suboptimal for another species. If so, increased temperature in this area will affect the species inhabiting the first site negatively while si- multaneously affecting the species in the second site pos- itively, resulting in different community responses at differ- ent sites. Although these two processes are not mutually ex- clusive, our results suggest that the second process played a major role in the study sites, because species compositions were similar at all three sites (Table S2). Additionally, inter- specific interactions, especially competition, may affect car- abid communities (Niemelä 1993), but this remains to be examined in our study sites.
Detailed examination of our data indicates that differ-
ences in environmental factors that determine the composi- tion of carabid beetle communities may result from varia- tion in environments per se between sites. For example, the effect of summer highest temperature was negatively asso- ciated diversity index in Site 1 and individual abundance in Site 3, while there was no relationship in the Site 2.
Cardenas and Hidalgo (2000) suggested that the life-cycle of univoltine carabid beetles was primarily determined by annual fluctuations in environmental (climatic) conditions in temperate zones. Our results are concordant with this suggestion.
In conclusion, our results suggest that local communities of carabid beetle are influenced by local variations in micro- climate, and that these influences vary between sites. This indicates the importance of conducting temporal surveys of communities at local scales. Such investigations are ex- pected to reveal an additional fraction of variation in com- munities, and to provide information on the underlying processes that have been overlooked, especially in studies of global community patterns and changes. Since our data are relatively limited (5 years and two sites), increases in tempo- ral and spatial scale sample sizes would be beneficial, and would allow more general conclusions to be drawn. Investi- gation of other environmental factors would also be benefi- cial; for instance, soil pH is of interest, as suggested by Elek et al. (2001). We did not find directional changes in microclimates over the5 years of this study; therefore, our results cannot provide information on global climate change or on the effects of ongoing global warming.
Acknowledgements
We thank Sungchan Lee for his invaluable help with the field work.This study was supported by 2015 Research Grant from Kangwon National University (No. D1000- 253-01-01).
References
Bellard C, Bertelsmeier C, Leadley P, Thuiller W, Courchamp F.
2012. Impacts of climate change on the future of biodiversity.
Ecol Lett 15: 365-377.
Botkin DB, Woodby DA, Nisbet RA. 1991. Kirtland's warbler habitats: a possible early indicator of climatic warming. Biol Conserv 56: 63-78.
Busby JR. 1988. Potential impacts of climate change on Australia’s flora and fauna. In: Greenhouse: planning for climate change (Pearman GI, ed). E. J. Brill, New York, pp 387-398.
Cardenas AM, Hidalgo JM. 2000. Seasonal activity and re- productive biology of the ground beetle Carabus dufouri (Coleoptera: Carabidae). Eur J Entomol 97: 329-338.
Chen J, Saunders SC, Crow TR, Naiman RJ, Brosofske KD, Mroz GD, Brookshire BL, Franklin JF. 1999. Microclimate in forest ecosystem and landscape ecology: variations in local cli- mate can be used to monitor and compare the effects of different management regimes. BioScience 49: 288-297.
Cohn JP. 1989. Gauging the biological impacts of the greenhouse effect. BioScience 39: 142-146.
Dawson TP, Jackson ST, House JI, Prentice IC, Mace GM. 2011.
Beyond predictions: biodiversity conservation in a changing climate. Science 332: 53-58.
Den Boer PJ, Luff ML, Mossakowski D, Weber F. 1986. Carabid beetles: their adaptations and dynamics: XVIIth International Congress of Entomology, Hamburg, 1984. G. Fischer, New York, 551 pp.
Den Boer PJ, Van Huizen THP, Den Boer-Daanje W, Aukema B, Den Bieman CFM. 1980. Wing polymorphism and di- morphism in ground beetles as stages in an evolutionary process (Coleoptera: Carabidae). Entomol Generalis 6: 107-134.
Dennis RLH. 1991. Climatic change and the British butterfly fau- na: opportunities and constraints. Biol Conserv 55: 1-16.
Elek Z, Magura T, Tóthmérész B. 2001. Impacts of non-native Norway spruce plantation on abundance and species richness of ground beetles (Coleoptera: Carabidae). Web Ecol 2: 32-37.
Eyre MD, Rushton SP, Luff ML, Telfer MG. 2005. Investigating the relationships between the distribution of British ground bee- tle species (Coleoptera, Carabidae) and temperature, precip- itation and altitude. J Biogeogr 32: 973-983.
Fajer ED. 1989. How enriched carbon dioxide environments may alter biotic systems even in the absence of climatic changes.
Conserv Biol 3: 318-320.
Geiger R. 1965. The Climate Near the Ground. Harvard Univer- sity Press, Cambridge, MA, 611 pp.
Gillingham PK, Palmer SCF, Huntley B, Kunin WE, Chipperfield JD, Thomas CD. 2012. The relative importance of climate and habitat in determining the distributions of species at different spatial scales: a case study with ground beetles in Great Britain.
Ecography 35: 831-838.
Greenwood G, Boardman R. 1989. Climatic change and some pos- sible effects upon terrestrial ecology of South Australia. In: The mallee lands: a conservation perspective: proceedings of the National Mallee Conference (Noble J, Joss P, Jones G, eds).
CSIRO, Canberra, pp 135-139.
Grueber CE, Nakagawa S, Laws RJ, Jamieson IG. 2011. Multim- odel inference in ecology and evolution: challenges and solu- tions. J Evol Biol 24: 699-711.
Heybornea WH, Millera JC, Parsonsb GL. 2003. Ground dwell-
ing beetles and forest vegetation change over a 17-year-period, in western Oregon, USA. Forest Ecol Manag 179: 123-134.
Holland JM. 2002. The agroecology of carabid beetles. Intercept Ltd., Andover, Hampshire, UK, pp 356.
Ishitani M, Tsukamoto T, Ikeda K, Yamakawa K, Yano K. 1997.
Faunal and Biological Studies of Ground Beetles (Coleoptera;
Carabidae and Brachinidae): (1) Species Compositions on the Banks of the Same River System. Jpn J Entomol 65: 704-720.
Jackson ST, Betancourt JL, Booth RK, Gray ST. 2009. Ecology and the ratchet of events: climate variability, niche dimensions, and species distributions. Proc Natl Acad Sci USA 106(Suppl 2): 19685-19692.
Jung JK, Kim ST, Lee SY, Park CG, Park JK, Lee JH. 2012.
Community structure of ground beetles (Coleoptera: Carabi- dae) along an altitudinal gradient on Mt. Sobaeksan, Korea. J Asia-Pacific Entomol 15: 487-494.
Kim JL, Lee CE. 1992a. Breeding patterns in southern Korean Carabina (Coleoptera, Carabidae). Proc Entomol Soc Wash 94:
136-150.
Kim JL, Lee CE. 1992b. Seasonal prevalence and geographical fluctuations of the southern Korean Carabina (Coleoptera:
Carabidae). Nature and Life 22: 33-41.
Kubota K, Kim JK, Lee CY, Furuta K. 2001. Ground beetle fauna in Pinus densiflora forests in Yangyang-gun, Kangwon province, with a special reference to the outbreaks of the pine needle gall-midge (Thecodiplosis japonensis). J Korean For Soc 90:
632-642.
Levin SA. 1992. The problem of pattern and scale in ecology: the Robert H. MacArthur award lecture. Ecology 73: 1943-1967.
Loarie SR, Duffy PB, Hamilton H, Asner GP, Field CB, Ackerly DD. 2009. The velocity of climate change. Nature 462:
1052-1055.
Lövei GL, Sunderland KD. 1996. Ecology and behavior of ground beetles (Coleoptera: Carabidae). Annu Rev Entomol 41: 231-256.
Luff ML, Eyre MD, Rushton SP. 1989. Classification and ordi- nation of habitats of ground beetles (Coleoptera, Carabidae) in North-East England. J Biogeogr 121-130.
Luff ML. 1975. Some features influencing the efficiency of pitfall traps. Oecologia 19: 345-357.
Luff ML. 1990. Spatial and temporal stability of Carabid com- munities in a grass/arable mosaic. In: The role of ground beetles in ecological and environmental studies (Stork NE, ed).
Intercept, Andover, pp 191-200.
Main AR. 1988. Climatic change and its impact on nature con- servation in Australia. In: Greenhouse: planning for climate change (Pearman GI, ed). CSIRO, Melbourne, pp 361-374.
Maleque MA, Maeto K, Ishii HT. 2009. Arthropods as bio- indicators of sustainable forest management, with a focus on plantation forests. Appl Entomol Zool 44: 1-11.
Mansergh I, Bennett S. 1989. Greenhouse' and wildlife manage- ment in Victoria. Vic Nat 106: 243-252.
Meentemeyer V, Box EO. 1987. Scale effects in landscape studies.
In: Landscape heterogeneity and disturbance (Turner MG, ed).
Springer-Verlag, New York, pp 15-34.
Niemelä J. 1993. Interspecific competition in ground-beetle as- semblages (Carabidae): what have we learned? Oikos 66:
325-335.
Pausch RD. 1979. Observations on the biology of the seed corn beetles, Stenolophus comma and Stenolophus lecontei. Ann Entomol Soc Am 72: 24-28.
Pearce JL, Venier LA. 2006. The use of ground beetles (Coleop- tera: Carabidae) and spiders (Araneae) as bioindicators of sus- tainable forest management: a review. Ecol Indic 6: 780-793.
Penev L. 1996. Large-scale variation in carabid assemblages, with special reference to the local fauna concept. Ann Zool Fennici 33: 49-63.
Peters RL, Darling JDS. 1985. The greenhouse-effect and nature reserves. Bioscience 35: 707-717.
Rainio J, Niemelä J. 2003. Ground beetles (Coleoptera: Carabidae)
as bioindicators. Biodivers Conserv 12: 487-506.
Ribera I, Dolédec S, Downie IS, Foster GN. 2001. Effect of land disturbance and stress on species traits of ground beetle assem- blages. Ecology 82: 1112-1129.
Shirley HL. 1929. The influence of light intensity and light quality upon the growth of plant. Am J Bot 16: 354-390.
Shirley HL. 1945. Light as an ecological factor and its measure- ment. Bot Rev 11: 497-532.
Sunderland KD. 2002. Invertebrate pest control by carabids. In:
The agroecology of carabid beetles (Holland JM, ed). Intercept Ltd., Andover, pp 165-214.
Thiele HU. 1977. Carabid beetles in their environments. Sprin- ger-Verlag, New York, 369 pp.
Woodward FI, Rochefort L. 1991. Sensitivity analysis of vegetation diversity to environmental change. Global Ecol Biogeogr Lett 1:
7-23.
1 1
Table S1. Generalised linear models explaining temporal and spatial variation in environmental measures.
2
Estimate SE Pr (> |t|)
S.tem
Year 0.2323 0.1107 0.0458*
Site 2 -0.1540 0.3836 0.6914
Site 3 1.0220 0.3836 0.0131*
W.tem
Year 0.3033 0.1511 0.0535
Site 2 1.4260 0.5234 0.0552
Site 3 2.4120 0.5234 0.0114*
S.H.tem
Year -0.1997 0.1810 0.2799
Site 2 2.4980 0.6269 0.0004***
Site 3 0.3300 0.6269 0.6031
W.H.tem
Year -0.2610 0.1911 0.1837
Site 2 6.2720 0.6620 6.45e-10***
Site 3 2.5940 0.6620 0.0006***
S.L.tem
Year 0.1417 0.0959 0.1520
Site 2 0.0060 0.3324 0.986
Site 3 1.8520 0.3324 7.49e-06***
W.L.tem
Year 0.4333 0.3549 0.2330
Site 2 -0.1740 1.2293 0.8885
Site 3 2.4080 1.2293 0.0609
S.Soil
Year 0.1350 0.2497 0.5930
Site 2 0.5760 0.8649 0.5110
Site 3 0.2660 0.8649 0.7610
W.Soil
Year -0.1650 0.0879 0.0718
Site 2 1.0420 0.3045 0.0021**
Site 3 0.3580 0.3045 0.2504
S.hum
Year -2.6810 1.9940 0.1903
Site 2 -10.3460 6.9070 0.1462
Site 3 -18.3780 6.9070 0.0132*
W.hum
Year -1.0238 0.8985 0.2628
Site 2 -7.1820 3.1124 0.0292*
Site 3 -19.7920 3.1124 9.81e-07***
S.illu
Year -0.7867 0.5322 0.1514
Site 2 3.3420 1.8434 0.0814
Site 3 -5.2320 1.8434 0.0087**
W.illu
Year -1.2220 2.1450 0.5740
Site 2 34.3200 7.3420 9.22e-05***
Site 3 0.9960 7.3420 0.8940
*** P< 0.001, ** P< 0.01, * P< 0.05.
3
2
Site 1 Site 2 Site 3 Total
Species 2011 2012 2013 2014 2015 2011 2012 2013 2014 2015 2011 2012 2013 2014 2015
Carabus (Eucarabus) sternbergi 2 27 14 8 13 10 33 27 3 11 14 12 11 6 191
Carabus (Leptocarabus) seishinensis 14 7 9 12 11 51 19 22 46 35 4 5 10 4 7 256
Carabus (Leptocarabus) semiopacus 1 7 2 8 18 2 15 8 6 74 4 4 7 11 167
Carabus (Leptocarabus) koreanus 8 22 1 31
Carabus (Morphocarabus) venustus 5 1 19 7 8 8 14 14 76
Carabus (Tomocarabus) fraterculus 2 5 2 9
Carabus (Coptolabrus) smaragdinus 3 2 2 3 1 2 3 1 2 4 23
Carabus (Coptolabrus) jankowskii 4 2 2 1 2 10 1 4 2 2 30
Carabus (Acoptolabrus) mirabilissimus 7 7
Synuchus callitheres 2 1 27 10 29 4 8 7 1 89
Synuchus cycloides 1 1 2 4
Synuchus nitidus 26 3 32 3 22 3 5 2 13 24 3 7 7 13 163
Synuchus sp.1 43 23 1 1 3 1 5 5 1 2 85
Synuchus sp.2 2 2 2 1 1 1 1 3 3 16
Platynus assimilis 5 4 3 3 3 2 20
Pterostichus orientalis 8 2 1 1 4 5 21
Pterostichus coerulescens 21 17 2 15 5 2 3 3 10 2 1 81
Pterostichus audax 3 12 10 27 6 7 8 5 2 13 7 100
Pterostichus scurra 6 8 6 10 1 3 10 22 2 9 10 87
Pterostichus compar 12 10 1 2 25
Pterostichus bellator 7 6 2 1 1 2 2 2 2 25
Pterostichus sp.1 3 4 1 1 1 10
Dolichus halensis 3 1 4 1 3 3 5 3 3 26
Pristosia vigil 1 12 27 4 9 3 8 64
Trigonognatha coreana 1 1
Harpalus griseus 1 1 2
Total 97 149 114 65 215 98 99 101 103 234 22 87 53 82 90 1,609