일반총설
실란 개질제가 실리카충전고무 컴파운드에 미치는 영향
김 광 제
김광제
2006~ West Virginia University, 2007 Chemical Engineering, 교수 2000~ Struktol Co. America, 2005 R&D Manager 1997~ The University of Akron, 1999 Post Doctoral Fellow 1992~ The University of Akron, 박사 1998
1987~ 인하대학교 화공과, 석사 1989
1987~ 인하대학교 화공과, 학사 1989
현재~ The University of Akron Research Faculty, 경상대학교 고분자공학과 Brain Pool 연구교수
Abstract
Effects of silane modifier, bis(triethoxysilylpropyl) tetrasulfide (TESPT(S4)) and bis(triethoxysilylpropyl) disulfide (TESPD(S2)), on silica filled compound were investigated upon processability, dynamic, mechanical, heat build-up, blowout properties, and silica dispersion in natural rubber (NR). The temperature of the S2 treat- ed silica compound generated higher than that of the S4 treated compound during internal mixer compoun- ding. The shear viscosity of the S2 compound exhibited lower than that of the S4 compound and the viscosity measured in dynamic mode was close to each other.
The elongation modulus of the S2 compound exhibited lower than that of the S4; however, the tear resistance strength of the S2 compound exhibited higher than that of the S4 compound. The loss tanδ values of the S2 compound exhibited higher than those of the S4 at room temperature. The augmentation of the test temper- ature lowered the tanδ values of each compound, which results in close tanδ values to each other at 100℃. The S2 compound deformed less than the S4 compound, and the blowout time of each compound was close to each other. The S2 compound generated more heat build-up than the S4 compound. The abrasion loss of the S2 compound was less than that of the S4 com- pound. The size of the silica agglomerate reduced on both S4 and S2 compounds upon vulcanization.
The addition of the bifunctional silanes (S2 and S4) on silica filled NR compound improved the process- ability of each compound and their effects were more significant on the S2 compound than the S4 compound.
After vulcanization the silica agglomerate size of each compound reduced compared with before vulcani- zation.
Keyword: silanes, natural rubber, silica, processability, blow out
1. Introduction
Silica particles are considered as a nano particle1,2 and their sizes are ranges from 1~10 nm to 10~500 nm depending on manufacturing conditions. Silica particles are existing as agglomerated form because of their high polar and hydrophilic character.3,4 Silica filled tire, ‘green tire’,5,6 exhibits low rolling resist- ance, which improves gas mileage and also shows good wet and snow traction,8 which improves grip on road surface. However, due to their high porous surface and polar character, silica particle are more difficult to process and disperse in rubber matrix than other particles.2,7-9 Silanes have been known to improve mechanical properties of silica compound via chemical bonding with silica particles.10,11 In 1962 Plueddemann established the expression coupling agent, which characterizes its function in
glass fiber reinforced polyester and epoxy laminates.12 Later, the application of ‘alkoxysilylpropyl-’ type si- lane coupling agent on particle filled composite sys- tems was applied on the plastic systems.13 The silani- zation of glass fibers exhibited improved reinforcing effects in plastics.14,15
In 1970’s, sulfur added bifunctional organosilanes were introduced to improve the bonding between silica surface and double bond in rubber chain during vulcanization stage for tire application.5,16 The bis (triethoxysilylpropyl) tetrasulfide (TESPT) has been introduced in ‘green tire’ due to their bifunctional character.6,16-19 Alkoxy groups attached on silane re- act with silica surface via hydrolysis mechanism and then form a silica-silane bond during mixing,20-23 while the other sulfur group chemically bonds with double bonds in rubber chain during curing stage.24 However, TESPT is known as sulfur donor and un- stable at high shear and high temperature,24 thus they react during mixing.25 The sulfur-sulfur bonding in tetra-sulfane easily splits at higher shear condition.5 The bond dissociation energy of tetra sulfane (less than 268 KJ/mole) was known less than disulfane (268 KJ/mole) and carbon-carbon (352 KJ/mole) bonding.26 The sulfur level exists in the silane play an important role during processing. In 1999, Luginsland showed the bis(triethoxysilylpropyl)di- sulfide (TESPD) treated silica exhibited lower vis- cosity, less polarity, and more stability than the TESPT treated silica.27 However, his work27 was car- ried in the presence of the squalene oil and did not focus on silica agglomerate dispersion during mixing in the rubber.
There have been other researches on the improve- ment of the processability and on reduction of the silica agglomerate size.10,11,13,28-32
Silane chain length effects on silica viscosity and agglomerate sizes have been studied to improve processability and dis- persion of silica agglomerates.10 Polymer chain was
chemically bonded on silica surface during precip- itation stage of silica in situ processing.11 Ultrasonic extruder was applied to break down the agglom- erated silica particles.32 The change of rotor design from tangential to intermeshing was introduced to control the temperature in stock to prevent the ther- mal degradation of silane during mixing and to de- crease mixing cycle.33 Different silane treatment on magnetic particle and their effects on dispersion and rheological properties were studied in an effort to replace the acrylate binder.34
The NR has widely used in the area of airplane tire, heavy-duty truck tire, and mechanical damping etc.
We revisit the effects of bifunctional silanes (TESPT and TESPD) in the silica filled NR com- pounds upon processing, dispersion and mechanical properties.40
2. Experimental 2.1 Materials
The silanes used in this study were TESPT and the TESPD trade name SCA98 and SCA985, re- spectively, which were a product of Struktol. The elastomer used in this study was NR (polyisoprene rubber), which was a Goodyear product by the brand name of SIR-20. The silica used in this study was Ultrasil VN3, which is precipitated silica with BET area 175 (m2/g) supplied by Degussa.
2.2 Mixing
Banbury internal mixer (BR 1600) was used com- pounding rubber and additives. Two-stage mixing was carried. The first stage mixing (master batch) was compounding of rubber, treated silica, and additives. At the second stage mixing, sulfur and oth- er accelerators were added into the master batch compound. The fill factor was fixed at 0.7 and the starting operation temperature of mixer was set to
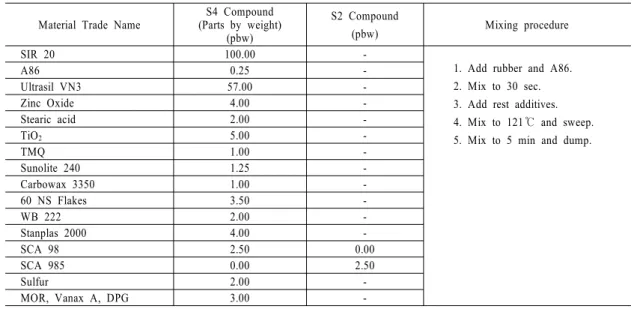
Table 1. Mixing formulations and procedure on NR compounds.
Material Trade Name S4 Compound (Parts by weight)
(pbw)
S2 Compound
(pbw) Mixing procedure
SIR 20 100.00 -
1. Add rubber and A86.
2. Mix to 30 sec.
3. Add rest additives.
4. Mix to 121℃ and sweep.
5. Mix to 5 min and dump.
A86 0.25 -
Ultrasil VN3 57.00 -
Zinc Oxide 4.00 -
Stearic acid 2.00 -
TiO2 5.00 -
TMQ 1.00 -
Sunolite 240 1.25 -
Carbowax 3350 1.00 -
60 NS Flakes 3.50 -
WB 222 2.00 -
Stanplas 2000 4.00 -
SCA 98 2.50 0.00
SCA 985 0.00 2.50
Sulfur 2.00 -
MOR, Vanax A, DPG 3.00 -
65.5℃. The rotor speed was set to 77 RPM. The mixing formulations and vulcanizations are included in Table 1.
2.3 Scanning Electron Microscope Cha- racterization
A Hitachi S-2150 Scanning Electron Microscope (SEM) was used to characterize the size of silica agglomerate. The prepared compounds were frac- tured in liquid nitrogen and coated with silver using sputter coater. The SEM pictures of agglomerate par- ticles were characterized using an Image Analyzer (IA) system Leica LQ500MC. The individual par- ticle diameters were converted to mass average par- ticle diameter.1,35,36
2.4 Rheology Measurement
A pressurized rotational rheometer with a bicon- ical rotor was used for measure shear viscosity of each compound.
2.5 Viscoelastic Property (tanδ) after Vulcanization
Cured materials were characterized using Mechan- ical Energy Resolver (MER-1100B) manufactured
by Instrumentors, Inc. This instrument measures os- cillatory input of axial compression and tension re- sponse of the cylindrical specimen. Oscillatory ten- sion/compression signal responses depending on ma- terial were measured.37
2.6 Elongation Test
The elongation test curves were obtained from the dumbbell shaped specimens measured following ASTM D 412-87 method. The Instron tensile tester (Instron Universal Testing Instruments Model 4201) with data acquisition system was used obtaining ten- sile test data of dumbbell specimen and the average of three specimens was obtained. This instrument meets ASTM E4 and measures mechanical proper- ties of materials, which is table mounted units con- sisting of loading frame and control console as sepa- rate assemblies. The thickness and the width of the specimens were average 2.2 mm and 6.3 mm, respectively.
2.7 Tear Resistance
The tear resistance test data were obtained from the die C shaped specimens measured following
ASTM D 624 method. Instron Universal Testing Instruments Model 4201, which described above was used obtaining test data. The tear resistance (N/mm) and maximum load (kN) of each specimen was measured. The average value out of three specimens was obtained. The thickness of the specimens was average 2.2 mm, and the width of the specimens at D-rad were average 12.7 mm.
2.8 Heat Build Up (HBU) and Blowout (BO) Time
The “Firestone Flexometer”38 was used measuring heat build up and blowout of the sample as of ASTM D 623. This is a testing apparatus for applying a uniform circulatory oscillating action onto the speci- men under compression. The test specimen is located between the fixed upper part and the moving bottom part. The bottom part is circulatory oscillating at con- stant speed of 13.1 Hz (787 RPM). The amplitude of the lower moving part was 7.62 mm. The com- pression pressure applied was 0.78 MPa on the HBU and 1.73 MPa on the BO sample.
2.9 Abrasion Resistance
The abrasion loss of each cured compound was measured using the APH-40 abrasion tester manufac- tured from Hampton Test Equipment Limited. An abrasive paper P-60 (DIN 53512) attached to the 150 mm diameter is rotating at the speed of 40 RPM.
The cylindrical sample (Diameter; 16 mm) with 10 mm thickness inserted into the sample holder travels over the surface of the abrasive paper at a rate of 0.32 m/sec under a loading of 10 N for a distance of 40 m.
3. Results and Discussion
3.1 Temperature Changes During Mixing Figure 1 represents the stock temperature changes during mixing. The TESPT treated silica compound (S4) exhibited lower temperature rise than that of
Figure 1. Temperature (℃) changes of the S4 and the S2 compounds with respect to mixing time.
the TESPD treated silica compound (S2). The slope of the temperature rises on the S4 compound during mixing was 1.276 and that of the S2 was 1.336. The S2 compound generated more heat and consumed more power than the S4 compound during mixing.
3.2 Steady Shear Viscosity
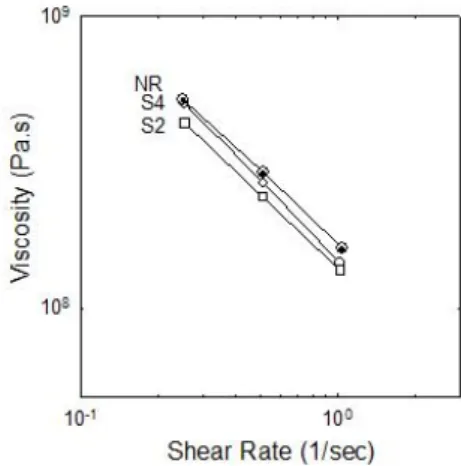
The shear viscosity of each compound from in- ternal mixer is summarized in Figure 2. The viscosity of the S4 compound exhibited higher than that of the S2 compound, and the viscosity of the S4 and the S2 compounds exhibited lower than that of the
Figure 2. Shear viscosity as a function of shear rate (1/sec) of the S4 and the S2 compound.
NR. It is well known that the viscosity increases as the filler concentration increases due to increment of the filler surface area contacting polymer chains.8,35-37,39 However, the viscosity of the silica filled compound exhibited lower than that of the NR in this study. This striking discovery was not re- ported previously. There have been studies on vis- cosity reduction by the addition of the TESPT treated silica into the EPDM compound.8 The research showed that the TESPT reduced the viscosity of the silica/EPDM compounds; however, the viscosity of the silica/TESPT/EPDM compound exhibited higher than that of the EPDM. The viscosity of 30 wt%
silica added (silica/silane/NR/other additives) com- pound in this study shows lower than that of the NR. This may relate with processing additives such as stearic acid and oil in the compound.39 The emul- sified silica particle with silane reduced the visco- sity.37 Similar phenomena from calcite and talc par- ticle filled thermoplastic compounds have already reported.39 The active site of the TESPT and the TESPD covalently bonded on silica surface via hy- drolysis20,21 changed the character of the silica sur- face from hydrophilic to oleophilic. The oleophilic silica slides better than untreated silica.10
3.3 Tensile Property
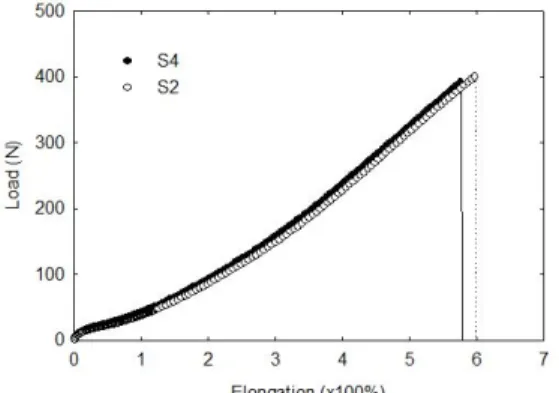
Figure 3 shows the tensile test curves obtained
Figure 3. Tensile test of dumbbell specimen of the S4 and the S2 compounds at 23℃.
from the dumbbell shaped specimens measured fol- lowing ASTM D 412-87 method. The S4 compound exhibited lower tensile stress maximum (Pa) and lower maximum elongation (%) than the S2 com- pound. The S4 compound exhibits less viscous (E”(S4) < E”(S2)) than the S2 compound in dumb- bell specimen, which matches with the viscoelastic properties (tanδ) at 1 Hz and 23℃. The S4 com- pound exhibited higher modulus (Pa) than the S2 compound at 100, 200, and 300% elongation. The stiffness (Kg/mm) of the S4 compound was 12.92 and that of the S2 was 13.84 (not shown).
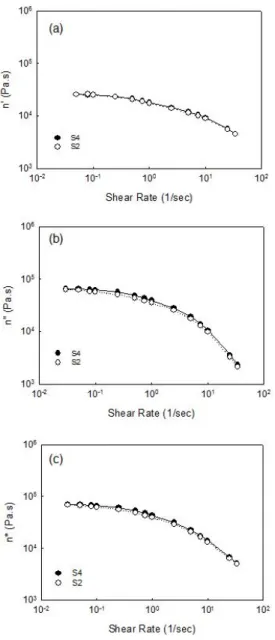
3.4 Complex Viscosity
The complex viscosity dependence on shear rate using RPA at 100℃ and 1 Hz is shown in Figure 4. As the shear rate was increased the viscosity of each compound was decreased due to shear thinning effect. While the real viscosity n’ of the S4 com- pound exhibited the same level compared with the S2 compound, the imaginary viscosity n” of the S2 compound exhibited lower than that of the S4 compound. Thus the complex viscosity of the S4 compound exhibited slightly higher than that of the S2 compound.
3.5 Viscoelastic Property (tanδ) after Vul- canization
Figure 5(a) shows the E’ and E” as a function of the frequency of the S4 and the S2 compounds at 23℃ and 100℃. The E’ and E” of both the S4 and the S2 compounds gradually increased as the frequency increased and the differences of the E’ and E” between the S4 and the S2 compound reduced as the test temperature increased from 23℃ to 100℃
as shown in Figure 5(a). As the temperature in- creased from 23℃ to 100℃, the differences between E’ and E” of the S4 and the S2 compound at the 23℃ exhibited smaller than that of the 100℃ re- sulted in higher tanδ values at 23℃ than at 100℃.
Figure 4. RPA measurement on (a) Real visco- sity (n’), (b) imaginary viscosity (n”), (c) complex viscosity (n*) of the S4 and the S2 compounds as a function of shear rate (1/sec) at 1 Hz, and 100℃.
The E’ of the S4 compound exhibited almost close or same compared with the S2 compound at 100℃, however, exhibited slightly lower compared with the S2 compound at 23℃. The E” of the S4 compound exhibited slightly lower or close to the S2 compound
(a)
(b)
Figure 5. Viscoelastic properties of vulcanized compounds of the S4 and the S2 (a) Compre- ssion modulus (E’, E”) vs. frequency (Hz), (b) Tanδ vs. frequency (Hz) at 23℃ and 100℃.
at 100℃, however, exhibited cross over to the higher modulus compared with the S2 compound, which re- sulted in cross over of the tanδ values over 5 Hz as shown in Figure 5(b).
Figure 5(b) shows that the tanδ values increase as the frequency increase on both compounds at 2 3℃ and 100℃. At low frequency region, the S4 compound exhibited lower tanδ values than the S2 compound on both temperatures, however, at the high frequency region over 5 Hz at 100℃, the tanδ values of the S4 compound exhibited cross over to the slightly higher than that of the S2 compound.
The tanδ values drop of the S2 compound was larger
than that of the S4 compound due to the larger drop of the E”(S4) than the E”(S2) as explained above.
Reading Figure 5(a) at 1 Hz at 23℃ gives E’(S4)≈
E’(S2), and E”(S4) < E”(S2),
thus, tanδ(S4) < tanδ(S2) (3.2)
At 23 ℃, the S4 compound exhibited lower tanδ values than the S2 compound, however, at 100℃, the S4 compound exhibited lower tanδ values than the S2 compound below 5 Hz and exhibited higher over 5 Hz.
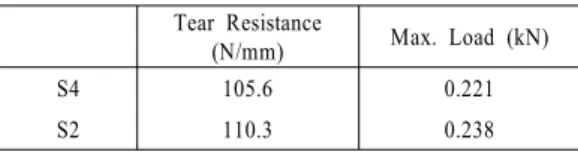
3.6 Tear Resistance
The S4 compound exhibited lower tear resistance (N/mm) and lower maximum load (kN) than that of the S2 compound. The S2 compound exhibited high- er resistance against tear, which related to higher maximum loading (kN), and exhibited more flexi- bility than the S4 compound. The results of tear re- sistance of the S4 and S2 compounds with ‘Die C’
specimen were summarized in Table 2.
Table 2. Tear resistance and load maximum of the S4 and S2 compounds.
Tear Resistance
(N/mm) Max. Load (kN)
S4 105.6 0.221
S2 110.3 0.238
3.7 Blow Out (BO) and Heat Build Up (HBU) Figure 6 shows the photograph of deformed speci- men after BO test following ASTM D 623 using
‘Firestone Flexometer’. The thickness of the center of the S4 compound specimen expanded (8%) more than that of the S2 (6%) compound, which implied the recovery property of the S2 compound was high- er than that of the S4 compound. The BO time on the S4 compound was around 84-134 (min) and that of the S2 was around 81-199 (min). At shear stress
Before Test
S4
S2
Figure 6. Photographs of after ‘Firestone Fle- xometer’ BO testing (45 min).
level 0.78 MPa, the HBU temperature of the S4 com- pound was 118℃ and that of the S2 compound was 121℃, and at shear stress level 1.73 MPa that of the S4 compound was 163℃ and that of the S2 com- pound was 174℃, respectively i.e. the temperature generated by the circular oscillation movement of the S4 sample exhibited lower than that of the S2 compound. The S4 compound generated less heat than the S2 compound in BO test, however, it de- formed further than the S2 compound. This result represents the S4 compound forms stronger 3-di- mension network structure than that of the S2 compound.
(a) (b)
(c) (d)
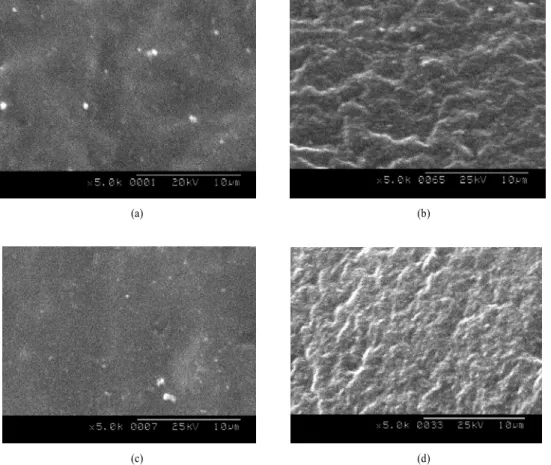
Figure 7. SEM photographs of silica agglomerates (a) the S4 unvulcanized, (b) the S4 vulcanized, (c) the S2 unvulcanized, (d) the S2 vulcanized at 5,000 magnifications.
3.8 Scanning Electron Microscope (SEM) Characterization
Figure 7 represents typical SEM photographs of TESPT and TESPD treated silica dispersion in NR matrix before and after vulcanization. The silica ag- glomerates were well dispersed after vulcanization.
The polydispersity (pd) of the S4 compound after vulcanization reduced from 0.780 to 0.966 and that of the S2 reduced from 0.966 to 0.708, respectively.
After vulcanization, the mass average of the S4 com- pound reduced from 1.006 to 0.608, and that of the S2 compound reduced from 1.706 to 0.450, respec- tively. The reduction of the pd of the S4 and the S2 compound might due to the breakdown of the big silica agglomerate existed before vulcanization.
The silica agglomerate size of the S4 and the S2 compound reduced significantly after vulcanization, and that of the S2 compound decreased more than the S4 compound. The size and dispersion of silica agglomerates before and after vulcanization of the compounds were summarized in Table 3.
Table 3. The size and dispersion of silica agg- lomerates on before and after vulcanization of the compounds.
Before vulcanization After vulcanization
S4 S2 S4 S2
Number Average 0.694 0.783 0.422 0.400 Mass Average 1.006 1.706 0.608 0.452
pd 0.780 0.966 0.741 0.708
Table 4. Density and abrasion loss of vulcanized S4 and S2 compounds.
Abrasion Loss (mm3) Density (g/cm3)
S4 143 1.18
S2 133 1.17
3.9 Abrasion Resistance
The abrasion loss (mm3) of the S4 compound was 143 and that of the S2 compound was 133, which represents that the S4 compound lost more debries than that of the S2 compound. And the density of the S4 compound (1.18) exhibited higher than that of the S2 compound (1.17). This is another instance that the S4 compound forms a rigid 3D network structure than that of the S2 compound. The result of the abrasion resistance of each compound was represented in Table 4.
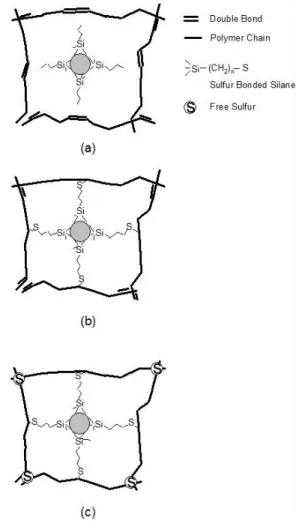
3.10 Mechanism
W e presum e the oil lubricates betw een the oleophilic silicas, the rubber chains, and between the silica-rubber chains as illustrated in Figure 8.40 Based the observation and experimental results shown
Figure 8. Schematic presentation of slip mecha- nism, oil effects on silane treated silica in rub- ber chain [K. J. Kim et al., Kautsch. Gummi Kunsts., 55, 518 (2002)].
Figure 9. Schematic presentation of vulcanized silane treated silica (a) TESP (no sulfur), (b) TESPD, and TESPT [K. J. Kim et al., Kautsch.
Gummi Kunsts., 55, 518 (2002)].
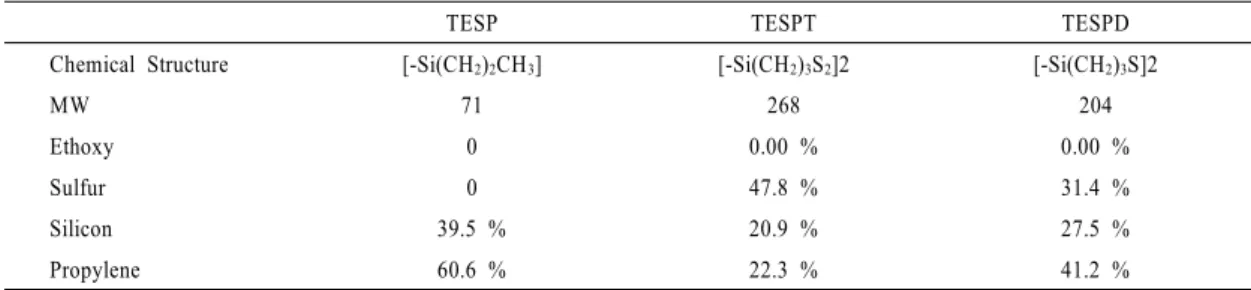
above, we present schematically the ideal structure of the triethoxysilyipropane (TESP), TESPT and TESPD treated silica composite in the NR in Figure 9. After coupling between silica and silanes via hy- drolysis mechanism ethanol evaporates. As shown in Table 5, the relative amount of sulfur and other functional group composition increase. The sulfur concentration in TESPT increased from 23.6% to 47.1% and that of TESPD increased from 13.4% to 30.8%. Sulfur attacks double bond in the NR then forms a covalent bond with the rubber chain is well
Table 5. Composition of the functional group of the TESP, TESPT and TESPD after hydrolysis.
TESP TESPT TESPD
Chemical Structure [-Si(CH2)2CH3] [-Si(CH2)3S2]2 [-Si(CH2)3S]2
MW 71 268 204
Ethoxy 0 0.00 % 0.00 %
Sulfur 0 47.8 % 31.4 %
Silicon 39.5 % 20.9 % 27.5 %
Propylene 60.6 % 22.3 % 41.2 %
known and they are more effective with the presence of zinc activator.41 After curing, the 3D structures of the rubber chain are different depending on the types of silane used. First, the TESP does not have sulfur to attack double bond in the NR polymer chain as shown in Figure 9 (a). Second, the TESPD have sulfur to attack the double bond in the NR polymer chain as shown in Figure 9 (b). Third, the TESPT have more sulfur to attack double bond in the NR polymer chain than the TESPD and the extra sulfur attack other double bond in the chain as shown in Figure 9 (c). Thus the TESPT treated silica com- pound forms more cross-linked structure than the TESPD treated silica compound as shown in Figure 9.
4. Conclusions
The S2 compound generated higher temperature and consumed more energy during internal mixer compounding than the S4 compound. The tensile moduli of the S2 compound exhibited lower than those of the S4 compound at elongations, and the S2 compound exhibited higher maximum tensile stress and higher tear resistance strength than that of the S4 compound. The S2 compound exhibited higher tanδ values than that of the S4 on temperature and rate sweep at 23℃ and 100℃ due to higher E”
of the S2 than that of the S4. The increment of tem- perature from 23℃ to 100℃ lowered the tanδ values of both compounds (S4 and S2). Both E’ and E”
were lowered, and the E” of the S4 and the S2 com-
pounds dropped more than the E’ in both com- pounds, respectively. The dynamic viscosity of each compound was close to each other and both systems exhibited reverting behavior at the vulcanization stage. Before vulcanization, the shear viscosity of the S2 compound exhibited lower than that of the S4 compound. Both compounds, before vulcanization, exhibited lower viscosity than the NR. The deforma- tion% of the S2 compound exhibited less than that of the S4 compound in the BO test due to higher recovery character of the S2 compound than the S4 compound. The BO times measured from each com- pound was close to each other. In the HBU test, the S2 compound generated more heat than the S4 compound. The TESPT and the TESPD might con- tribute to agglomerate and disperse the silica ag- glomerate particles in the non-polar characteristic NR47 during mixing,10 however, after vulcanization, the size of the silica agglomerates of both com- pounds reduced, and the polydispersity of the S4 compound exhibited higher than that of the S2 com- pound due to big silica agglomerates brake down af- ter vulcanization.
The S2 compound was more processable, con- sumed more energy, generated more heat during mixing, and deformed less after vulcanization than the S4 compound. However, the S2 compound ex- hibited lower tensile modulus and higher tanδ value than the S4 compound. The abrasion loss of the vul- canized S4 compound exhibited higher than that of
the S2 compound, which represents the S4 com- pound is more rigid than the S2 compound. The rigid 3D network surface structure of the S4 compound breaks down more easily than the S2 compound.
Acknowledgment
This presentation is modified from the pre- sentation at a meeting of the ACS: Rubber Division, Cleveland, Ohio October 16-19, 2001 and published in Kautsch. Gummi Kunsts., 55, 518 (2002).
References
1. J. L. White and K. J. Kim, “Thermoplastic and Rubber Compounds: Technology and Physical Chemistry”, Munich, Hanser Publisher, (2008) 2. R. K. Gupta, K. J. Kim, and E. Kennel “Handbook
of Polymer Nanocomposites” CRC Press, (in press).
3. R. Bassett, E. A. Boucher, and A. C. Zettlemoyer, J. Colloid Interface Sci., 27, 649 (1968).
4. J. A. Hockley and B. A. Pethica, Trans Faraday Soc., 57, 2247 (1961).
5. F. Thurn and S. Wolff, Kautsch. Gummi Kunstst., 28, 733 (1975).
6. U.S. Patent (filed Feb. 20, 1992) 5,227,425 (1993), R. Rauline (Michelin).
7. H. Ismail and P. K. Freakley, Polym. Plast.
Technol. Eng., 36, 873 (1997).
8. K. J. Kim and J. L. White, J. Ind. Eng. Chem., 6(4), 262 (2000)
9. K. J. Kim and J. L. White, Composite Interfaces, 9(6), 541-556 (2002).
10. K. J. Kim and J. L. White, J. Ind. Eng. Chem., 7(1), 50 (2001).
11. S. Kohjiya and Y. Ikeda, Rubber Chem. Technol., 73, 534 (2000).
12. E. P. Plueddemann, H. A. Clark, L. E. Nelson, and K. R. Hoffman., Mod. Plast., 8, 135 (1962) 13. B. Arkles, CHEMTECK 766 (1977).
14. J. Bjorksten, L. L. Yaeger, and J. E. Henning, Ind.
Eng. Chem., 46, 1632 (1954).
15. D. J. Vaughan, Soc. Plast. Eng, 23, 330 (1977) 16. S. Wolff, Kautsch. Gummi Kunstst., 32, 760
(1979).
17. P. Vondracek, M. Hradec, V. Chvalovsky, and H.
D. Khanh, Rubber Chem. Technol., 57, 675 (1984).
18. Europe Patent EP0501 227, (1991), R. Rauline (Michelin).
19. U. Goerl, A. Hunsche, A. Mueller, and H. G.
Koban, Rubber Chem. Technol, 70(4), 608 (1997) 20. H. Ishida, Polym. Compos., 5, 101 (1984) 21. H. Ishida and J. L. Koenig, J. Colloid Interface
Sci., 106, 334 (1985).
22. A. Hunsche, U. Görl, A. Müller, M. Knaack, and T. Göbel, Kautsch. Gummi Kunstst., 50, 881 (1997).
23. A. Hunsche, U. Görl, H. G. Koban, and T.
Lehmann, Kautsch. Gummi Kunstst., 51, 525 (1998).
24. S. Wolff, Kautsch. Gummi Kunstst., 34, 280 (1981).
25. E. G. Rochow, J. Amer. Chem. Soc., 67, 963 (1945).
26. R. Steudel, Angew. Chem. 87, 683 (1975).
27. H. Luginsland, “Reactivity of the sulfur functions of the disulfane silane TESPD and the tetrasulfane silane TESPT”, Degussa-Hülls, ACS Rubber Division meeting, Chicago IL, Apr. 1999.
28. J. H. Bachmann, J. W. Sellers, and M. P. Wagner, Rubber Chem. Technol., 32, 1286 (1959).
29. E. M. Dannenberg, Rubber Chem. Technol., 48, 410 (1975); 48, 558 (1975).
30. M. P. Wagner, Rubber Chem. Technol., 49, 703 (1976).
31. A. Krysztafkiewicz, Colloid Polym. Sci., 267, 399 (1989).
32. A. I. Isayev, C. K. Hong, and K. J. Kim, Rubber Chem. Technol., 76(4), 923 (2003); K. J. Kim and J. L. White, J. Ind. Eng. Chem., 6(6), 372 (2000).
33. G. Heiss, “Mixing silica compounds”, Krupp Rubber Machinery Inc., ITEC-2000 (No 5B), Akron OH, Sept. 2000.
34. J. Y. Huh, T. Woo, and D. E. Nikles, Polym. Mat.:
Sci.&Eng., 85, 387 (2001)
35. J. L. White, “Principle of Polymer Engineering Rheology”, Wiley Inter-Science, New York (1990).
36. J. L. White, “Rubber Processing: Technology, Materials, and Principles”, Hanser Publishers, Cincinnati (1995).
37. A. N. Gent, “Engineering with Rubber: How to Design Rubber Components”, Hanser Publishers,
New York (1992).
38. U.S. Patent (filed June 9, 1931) 02,048,314 (July 21, 1936), R. W. Allen (Firestone Tire & Rubber Co.).
39. K. J. Kim and J. L. White, Polym. Eng. & Sci., 39, 2189 (1999).
40. K. J. Kim and J. Vanderkooi, Kautsch. Gummi Kunsts., 55, 518 (2002)
41. A. D. Roberts, “Natural Rubber Science and Technology”, Oxford Science Publishers, New York, 1988.