ABSTRACT
Background and Objectives: Kawasaki disease (KD) is an acute systemic vasculitis that affects the coronary arteries. Abnormal immune reactions are thought to contribute to disease pathogenesis. The effect of immunoglobulin (Ig) isotype (IgG, IgA, IgM, and IgE) on inflammatory data and clinical outcomes of patients with KD was examined.
Methods: Ig levels in 241 patients with KD were measured during the acute, subacute, convalescent, and normal phases of the disease.
Results: Compared with reference Ig values, IgG, IgA, and IgM levels were significantly higher in the subacute phase, while IgE levels were elevated in 73.9% (178/241) of patients with KD in all clinical phases. However, high IgE levels were not associated with clinical outcomes, including intravenous immunoglobulin unresponsiveness and coronary artery lesions (CALs).
Significantly more CALs were observed in the high IgA group than in the normal IgA group (44.7% vs. 20.8%, respectively; p<0.01). In addition, IgA levels in the acute phase (p=0.038) were 2.2-fold higher, and those in the subacute phase were 1.7-fold higher (p <0.001), in the CAL group than in the non-CAL group. IgA concentrations increased along with the size of the coronary artery aneurysm (p <0.001). Furthermore, there was a strong correlation between IgA levels and CAL size (r=0.435, p<0.001), with a high odds ratio of 2.58 (p=0.022).
Conclusions: High IgA levels in patients with KD are prognostic for the risk of CALs.
Keywords: Mucocutaneous lymph node syndrome; IgA; Coronary aneurysms
Original Research
Received: Aug 6, 2020 Revised: Oct 6, 2020 Accepted: Nov 11, 2020 Correspondence to Jong-Keuk Lee, PhD
Asan Institute for Life Sciences, University of Ulsan College of Medicine, 88, Olympic-ro 43- gil, Songpa-gu, Seoul 05505, Korea.
E-mail: [email protected] Copyright © 2021. The Korean Society of Cardiology
This is an Open Access article distributed under the terms of the Creative Commons Attribution Non-Commercial License (https://
creativecommons.org/licenses/by-nc/4.0) which permits unrestricted noncommercial use, distribution, and reproduction in any medium, provided the original work is properly cited.
ORCID iDs Jae-Jung Kim
https://orcid.org/0000-0002-7406-3261 Hea-Ji Kim
https://orcid.org/0000-0002-6285-1121 Jeong Jin Yu
https://orcid.org/0000-0003-1601-3685 Sin Weon Yun
https://orcid.org/0000-0001-8947-703X Kyung-Yil Lee
https://orcid.org/0000-0001-6510-1580 Kyung Lim Yoon
https://orcid.org/0000-0003-4734-900X Hong-Ryang Kil
https://orcid.org/0000-0003-4925-8240 Gi Beom Kim
https://orcid.org/0000-0002-7880-280X
Jae-Jung Kim , PhD1, Hea-Ji Kim , MS1, Jeong Jin Yu , MD, PhD2,
Sin Weon Yun , MD, PhD3, Kyung-Yil Lee , MD, PhD4, Kyung Lim Yoon , MD, PhD5, Hong-Ryang Kil , MD, PhD6, Gi Beom Kim , MD, PhD7, Myung-Ki Han , MD, MS8, Min Seob Song , MD, PhD9, Hyoung Doo Lee , MD, PhD10, Hyun Ok Jun , MD, PhD11, Kee Soo Ha , MD, PhD12, Young Mi Hong , MD, PhD13, Gi Young Jang , MD, PhD14, Jong-Keuk Lee , PhD1, and the Korean Kawasaki Disease Genetics Consortium
1Asan Institute for Life Sciences, University of Ulsan College of Medicine, Seoul, Korea
2Department of Pediatrics, University of Ulsan College of Medicine, Asan Medical Center, Seoul, Korea
3Department of Pediatrics, Chung-Ang University Hospital, Seoul, Korea
4Department of Pediatrics, The Catholic University of Korea, Daejeon St. Mary's Hospital, Daejeon, Korea
5Department of Pediatrics, Kyung Hee University Hospital at Gangdong, Seoul, Korea
6Department of Pediatrics, Chungnam National University Hospital, Daejeon, Korea
7Department of Pediatrics, Seoul National University Children's Hospital, Seoul, Korea
8Department of Pediatrics, University of Ulsan, Gangneung Asan Hospital, Gangneung, Korea
9Department of Pediatrics, Inje University Paik Hospital, Busan, Korea
10Department of Pediatrics, Pusan National University Hospital, Busan, Korea
11Department of Pediatrics and Adolescent Medicine, Myongji Hospital, Goyang, Korea
12Department of Pediatrics, Korea University Guro Hospital, Seoul, Korea
13Department of Pediatrics, Ewha Womans University Hospital, Seoul, Korea
14Department of Pediatrics, Korea University Ansan Hospital, Ansan, Korea
IgA Levels Are Associated with
Coronary Artery Lesions in Kawasaki
Disease
Myung-Ki Han
https://orcid.org/0000-0003-1817-8088 Min Seob Song
https://orcid.org/0000-0003-3426-6803 Hyoung Doo Lee
https://orcid.org/0000-0002-6125-187X Hyun Ok Jun
https://orcid.org/0000-0003-2270-0123 Kee Soo Ha
https://orcid.org/0000-0001-6753-5411 Young Mi Hong
https://orcid.org/0000-0002-6600-7876 Gi Young Jang
https://orcid.org/0000-0002-4831-1188 Jong-Keuk Lee
https://orcid.org/0000-0003-1125-4017 Funding
This study was supported by the Ministry of Health & Welfare of the Republic of Korea (HI15C1575) and the National Research Foundation of Korea (2019R1F1A1061238).
Conflict of Interest
The authors have no financial conflicts of interest.
Author Contributions
Conceptualization: Lee JK; Data curation: Kim JJ, Kim HJ, Yu JJ, Yun SW, Lee KY, Yoon KL, Kil HR, Kim GB, Han MK, Song MS, Lee HD, Jun HO, Ha KS, Hong YM, Jang GY; Formal analysis: Kim JJ; Funding acquisition: Lee JK;
Investigation: Kim JJ; Project administration:
Hong YM, Jang GY, Lee JK; Resources: Yu JJ, Yun SW, Lee KY, Yoon KL, Kil HR, Kim GB, Han MK, Song MS, Lee HD, Jun HO, Ha KS, Hong YM, Jang GY; Supervision: Hong YM, Jang GY, Lee JK; Writing - original draft: Kim JJ; Writing - review & editing: Lee JK.
INTRODUCTION
Kawasaki disease (KD) is an acute, systemic vasculitis that affects infants and young children, mainly children under the age of 5 years. It is characterized by prolonged fever that is unresponsive to antibiotics; polymorphous skin rash; erythema of the oral mucosa, lips, and tongue; erythema of the palms and soles; bilateral conjunctival injection; and cervical lymphadenopathy.1) The primary pathological changes associated with KD include inflammation of medium-sized muscular arteries throughout the body, particularly the coronary arteries, and possible formation of coronary artery aneurysms.2)3) High-dose intravenous immunoglobulin (IVIG) (2 g/kg over 12 hours) together with aspirin effectively abrogate the fever and systemic inflammation, and reduce the rate of aneurysm to less than 5% of cases.4) Although the pathogenesis of KD remains unknown, it is thought to be due to an abnormal immune reaction triggered by unknown infectious agents in genetically susceptible individuals.5)
Recent genome-wide association studies (GWAS) identified several genes related to B cell signaling, including BLK, CD40, FCGR2A, and BCL2L11,6-9) as susceptibility genes for KD. Farh et al.10) conducted bioinformatics analyses integrating published GWAS results and information about gene expression, expression quantitative trait loci, and epigenetic information, which suggested the importance of B cells in KD pathogenesis.11) Thus, the data imply that B cells may play an important role in the pathogenesis of KD. Immunoglobulins (Igs) play key roles in B cell development and function. In this study, we measured Ig levels (IgG, IgA, IgM, and IgE) during the clinical course of KD and examined the effects of each Ig isotype level on inflammatory laboratory data and clinical outcomes (i.e., coronary artery lesions [CALs] and non-responsiveness to IVIG).
METHODS
Subjects
Children with KD were recruited from 11 tertiary academic hospitals in Korea, all of which participated in the Korean Kawasaki Disease Genetics Consortium. All patients were diagnosed by pediatricians in accordance with the diagnostic criteria of the American Heart Association.12) A total of 241 patients were selected from the pool of our KD patients, including severe cases with coronary artery aneurysms (n=61) and cases without coronary artery aneurysms (n=180). Among these, 210 had complete KD, with fever lasting 5 days or longer, and at least 4 of the 5 principal clinical features of KD. All patients received single high-dose IVIG (2 g/kg). Two-dimensional echocardiography results were interpreted by pediatric cardiologists and coronary arteries were categorized as normal or abnormal (showing CALs, i.e., dilation or aneurysm). In addition, the coronary artery aneurysms were classified by size: small (internal diameter 3 to <5 mm), medium (5 to <8), or giant (≥8 mm). The study protocol was approved by the Institutional Review Boards (2014-0823) of the involved institutions, and the parents or guardians of all patients provided written informed consent.
Ig measurement
Plasma samples from 241 children were collected during the acute (before IVIG treatment;
n=56), subacute (within 3 weeks after treatment; n=157), convalescent (between 3 weeks and 6
months after treatment; n=7), or normal (>6 months after treatment; n=21) phase of KD. The concentrations of IgG, IgA, and IgM were measured in a nephelometric immunoassay using the IgG/IgA/IgM Flex Reagent Cartridge kit (Siemens, Munich, Germany) and a Dimension Vista 500 instrument (Siemens). IgE concentrations were measured in a fluorescence enzyme immunoassay (UniCAP Total IgE kit; Phadia AB, Uppsala, Sweden) and the ImmunoCAP 1000 instrument (Phadia AB). Ig levels were classified as low (below the reference range), normal (within the reference range), or high (above the reference range) in accordance with the reference values from the Texas Children's Hospital Clinical Laboratory13) (for IgG, IgA, and IgM) and the ImmunoCAP Total IgE system14) (for IgE). The reference values are presented in Supplementary Tables 1 and 2.
Laboratory parameters
All laboratory tests (except Ig measurements) were performed before initial IVIG treatment;
these included a white blood cell count, a neutrophil count, a platelet count, the erythrocyte sedimentation rate, and the concentrations of hemoglobin, C-reactive protein, aspartate aminotransferase, alanine aminotransferase, serum albumin, and total protein.
Genotyping and quality control
Genotype data used for GWAS of Ig levels were obtained from our previous study.15) Genotyping methods and quality control steps for GWAS are also described in detail in the previous study.15) Briefly, 296 children with KD were genotyped using the Illumina Human Omni1-Quad Bead Chip (Illumina, San Diego, CA, USA), according to the manufacturer's instructions. Among them, 241 patients with Ig data were included in the analysis. To filter single nucleotide polymorphism (SNP) markers, the following were excluded: 2,553 SNPs with missing call rates >2%, 413 SNP markers with a Hardy-Weinberg Equilibrium p value of
<1×10⁻⁶, and 209,342 SNP markers with a minor allele frequency <0.01. After SNP filtration, 718,717 SNPs were included in the genome-wide association analysis.
Statistical analysis
Statistical analysis was performed using the SPSS Statistics, version 24 (IBM, Armonk, NY, USA). Because Ig data showed a skewed distribution, the data were log transformed. Data are expressed as mean±standard deviation, as the geometric mean (95% confidence interval), as the median (interquartile range), or as percentages as appropriate. For continuous variables, differences between 2 groups were analyzed using Student's t-test or the Mann-Whitney test.
Differences among 3 or more groups were analyzed by 1-way analysis of variance (followed by Tukey's test) and the Kruskal-Wallis test. An analysis of covariance test, adjusted for age at the time of sampling, was also used to compare Ig levels among the 4 groups. For categorical variables, the χ2 test was used. To determine the effects of Ig levels on CAL, logistic regression analysis adjusted for age, sex, and plasma sampling time point was performed and Pearson correlation coefficient was calculated. A 2-tailed p value <0.05 was considered statistically significant. To analyze the association between Ig levels and SNPs, linear regression analysis adjusted for age at sampling, sex, and plasma sampling time point was performed using PLINK software, version 1.07 (http://pngu.mgh.harvard.edu/~purcell/plink/).16) The levels of each Ig isotype and amount of isotype switching (the ratio of each Ig isotype to IgM) were log transformed before analysis.
RESULTS
IgG, IgA, and IgM levels were significantly higher during the subacute phase after IVIG treatment, whereas IgE levels were constitutively elevated at all clinical phases of KD
To measure the amount of each Ig isotype, we collected plasma samples from 241 patients during the acute phase (n=56), subacute phase (n=157), convalescent phase (n=7), or normal phase (n=21). Significantly higher IgA, IgG, and IgM levels were observed during the subacute phase after IVIG treatment than during the other phases. In particular, and as expected, plasma samples taken during the subacute phase (within 3 weeks after IVIG treatment) contained about 3 times more IgG than plasma samples collected before IVIG treatment (acute phase) (Table 1). By contrast, there were no significant changes in IgE levels during the 4 different clinical phases of KD. However, compared with the reference values, constitutively elevated IgE levels were observed in 73.9% (178/241) of patients during all clinical phases of KD (75.0% in the acute phase, 74.5% in the subacute phase, 71.4% in the convalescent phase, and 66.7% in the normal phase; Figure 1 and Supplementary Table 3).
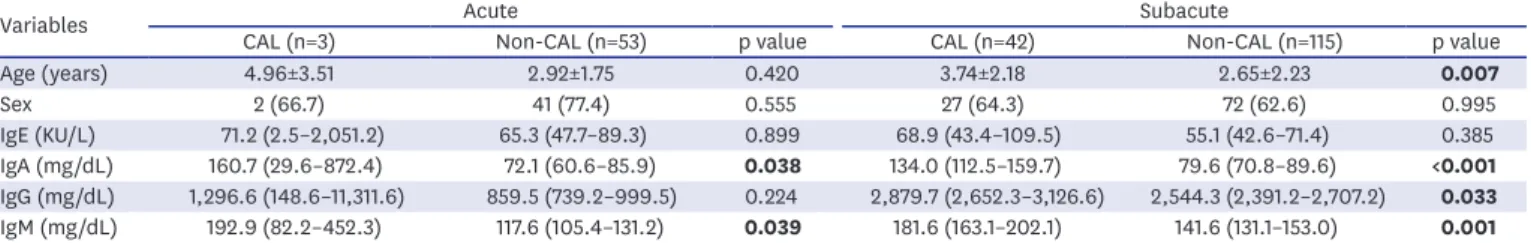
IgA and IgM levels are associated with CALs in KD, whereas high IgG and constitutively elevated IgE levels are not associated with clinical outcome To examine the effect of each Ig isotype level in KD, we compared inflammatory laboratory parameters and clinical outcomes of KD between the normal and high groups for each Ig isotype (Supplementary Tables 4-9). Significantly more CALs were observed in the high IgA group than in the normal IgA group (44.7% vs. 20.8%, respectively; p<0.01; Supplementary Table 4). In particular, we observed 2.2-fold (p=0.038) and 1.7-fold (p <0.001) higher IgA levels in the CAL group than in the non-CAL group during the acute and subacute phases, respectively (Table 2). Less significant increases in IgM levels were observed in the CAL group during the acute phase (1.6-fold, p=0.039) and subacute phase (1.3-fold, p=0.001) than in the non-CAL group (Table 2). Since Ig levels can be affected by compounding factors such as age and sex, we performed logistic regression analysis after adjusting for age, sex, and sampling time point to determine the effects of each Ig isotype on CAL formation in KD patients.
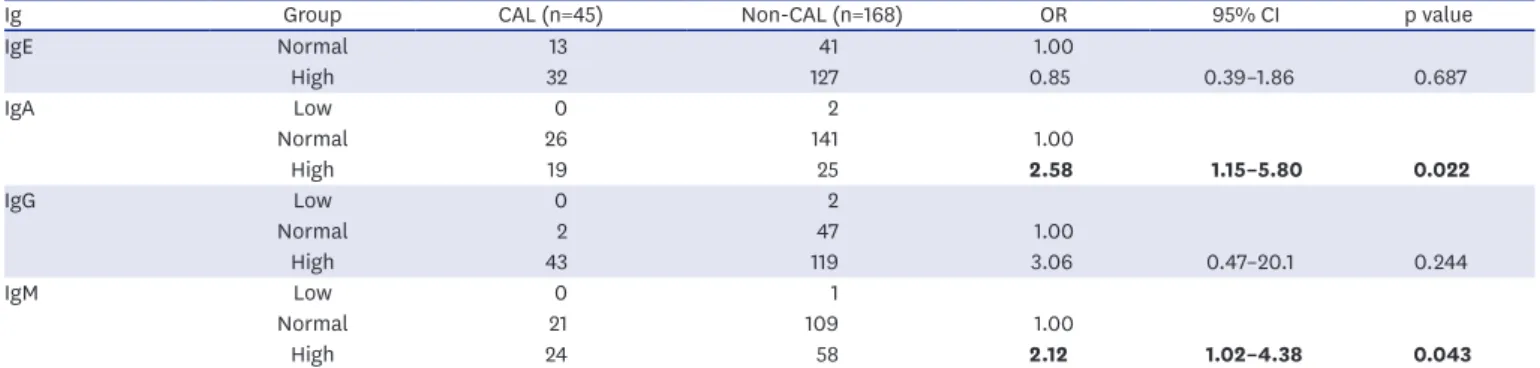
High IgA and IgM levels were significantly associated with the incidence of CALs (odds ratio [OR]=2.58, p=0.022 and OR=2.12, p=0.043, respectively) (Table 3). When the same logistic regression analysis was performed separately for the 2 subgroups (acute and subacute), a larger effect size was observed for the acute phase than for the subacute phase (IgA: OR=6.31, p=0.199 vs. OR=2.46, p=0.035, respectively; IgM: OR=25.7, p=0.073 vs. OR=1.84, p=0.113, respectively; Supplementary Table 10). This result suggests that the high IgA and IgM levels in the acute phase are a potential prognostic marker for predicting the risk of CALs. In Table 1. Clinical characteristics and Ig levels of patients with KD
Variables Acute (n=56) Subacute (n=157) Convalescent (n=7) Normal (n=21) p value
Age at onset (years) 3.03±1.891 2.94±2.261 5.85±3.352 2.46±1.661 0.004
Male 43 (76.8) 99 (63.1) 4 (57.1) 16 (76.2) 0.199
Incomplete KD 8 (14.5) 21 (13.4) 1 (14.3) 0 (0.0) 0.342
CAL 3 (5.4) 42 (26.8) 2 (28.6) 14 (66.7) <0.001
IVIG non-responders 22 (39.3) 49 (31.2) 3 (42.9) 12 (57.1) 0.109
IgE (KU/L) 65.3 (45.6–93.6) 59.0 (47.6–73.2) 103.6 (37.3–287.7) 57.7 (32.0–104.1) 0.727
IgA (mg/dL) 75.0 (63.4–88.6) 92.4 (83.6–102.2) 69.4 (43.1–111.6) 67.1 (51.0–88.3) 0.040
IgG (mg/dL) 877.4 (791.6–973.0)1,2 2,636.0 (2,478.3–2,803.7)3 1,099.9 (821.2–1,473.8)2 693.0 (585.2–820.6)1 <0.001 IgM (mg/dL) 120.7 (108.5–1.34.2)1 151.4 (142.1–161.4)2 114.5 (84.7–155.0)1,2 101.2 (85.0–120.5)1 <0.001 Data are shown as the mean±standard deviation, number (%), or geometric mean (95% confidence interval). The p values were calculated by analysis of variance test, the χ2 test, or analysis of covariance (adjusted for age). Significant values are shown in bold. The same group is designated by the same number.
CAL = coronary artery lesion; Ig = immunoglobulin; IVIG = intravenous immunoglobulin; KD = Kawasaki disease.
addition, the concentrations of IgA and IgM increased in line with the size of the coronary artery aneurysms (non-CAL, 74.3 mg/dL; small, 111.3 mg/dL; medium, 159.2 mg/dL; giant, 197.6 mg/dL for IgA, p <0.001; non-CAL, 132.4 mg/dL; small, 170.9 mg/dL; medium, 171.6 mg/dL; giant, 320.9 mg/dL for IgM, p=0.001) (Table 4). Furthermore, correlation analysis revealed that IgA and IgM levels correlated significantly with CAL size (IgA: r=0.435, p<0.001;
IgM: r=0.272, p<0.001; Figure 2). However, IgE and IgG levels were not associated with clinical outcomes such as CALs and non-response to IVIG (Supplementary Tables 6-9).
Notably, elevated IgE during all clinical phases of KD was not associated with inflammatory laboratory data or other clinical variables, although the incidence of complete KD in the high IgE group was slightly higher than that in the normal IgE group (90.4% vs. 79.4%, A
%
Convalescent Subacute
IgG IgA
Acute 0
20 100
40 60 80
Normal
B
%
Convalescent Subacute
Acute 0
20 100
40 60 80
Normal
Low Normal High
C
%
Convalescent Subacute
IgM IgE
Acute 0
20 100
40 60 80
Normal
D
%
Convalescent Subacute
Acute 0
20 100
40 60 80
Normal
Low Normal High
Figure 1. Distribution of Ig levels according to the sampling time point. (A) IgG, (B) IgA, (C) IgM, and (D) IgE levels were classified as low, normal, or high according to the reference values for each Ig. The percentage of each Ig during the different disease phases (acute, n=56; subacute, n=157; convalescent, n=7;
normal, n=21) is presented.
Ig = immunoglobulin.
Table 2. Comparison of Ig levels between the CAL and non-CAL groups during the acute and subacute phases
Variables Acute Subacute
CAL (n=3) Non-CAL (n=53) p value CAL (n=42) Non-CAL (n=115) p value
Age (years) 4.96±3.51 2.92±1.75 0.420 3.74±2.18 2.65±2.23 0.007
Sex 2 (66.7) 41 (77.4) 0.555 27 (64.3) 72 (62.6) 0.995
IgE (KU/L) 71.2 (2.5–2,051.2) 65.3 (47.7–89.3) 0.899 68.9 (43.4–109.5) 55.1 (42.6–71.4) 0.385
IgA (mg/dL) 160.7 (29.6–872.4) 72.1 (60.6–85.9) 0.038 134.0 (112.5–159.7) 79.6 (70.8–89.6) <0.001
IgG (mg/dL) 1,296.6 (148.6–11,311.6) 859.5 (739.2–999.5) 0.224 2,879.7 (2,652.3–3,126.6) 2,544.3 (2,391.2–2,707.2) 0.033 IgM (mg/dL) 192.9 (82.2–452.3) 117.6 (105.4–131.2) 0.039 181.6 (163.1–202.1) 141.6 (131.1–153.0) 0.001 Data are shown as the mean±standard deviation, number (%), or as the geometric mean (95% confidence interval). The p values were calculated using Student's t-test and the χ2 test. Significant values are shown in bold.
CAL = coronary artery lesion; Ig = immunoglobulin.
respectively; p=0.040; Supplementary Table 6). This result suggests that elevated IgE levels in patients with KD do not play a crucial role in disease pathogenesis.
Genetic loci affecting Ig levels in patients with KD are not associated with known KD susceptibility loci (except the ACOXL-BCL2L11 locus)
To test whether the loci determining Ig levels are associated with known KD susceptibility genes, we performed a GWAS using our previous SNP chip data derived from 241 KD Table 3. Effect of Igs on CALs
Ig Group CAL (n=45) Non-CAL (n=168) OR 95% CI p value
IgE Normal 13 41 1.00
High 32 127 0.85 0.39–1.86 0.687
IgA Low 0 2
Normal 26 141 1.00
High 19 25 2.58 1.15–5.80 0.022
IgG Low 0 2
Normal 2 47 1.00
High 43 119 3.06 0.47–20.1 0.244
IgM Low 0 1
Normal 21 109 1.00
High 24 58 2.12 1.02–4.38 0.043
Logistic regression analysis adjusted for age, sex, and sampling time point was performed. Data collected during the acute and subacute phases were used for analysis. Significant values are shown in bold.
CAL = coronary artery lesion; CI = confidence interval; Ig = immunoglobulin; OR = odds ratio.
Table 4. Ig levels according to CAL size during the acute and subacute phases
Acute Non-CAL (n=168) Small (n=32) Medium (n=12) Giant (n=1) p value
IgE (KU/L) 54.7 (43.5–68.8) 48.8 (29.2–81.4) 119.2 (55.1–258.1) 427.1 (30.7–5,935.9) 0.090
IgA (mg/dL) 74.3 (66.8–82.6)1 111.3 (87.9–141.0)2 159.2 (111.5–227.5)2 197.6 (58.6–666.0)1,2 <0.001 IgG (mg/dL) 1,477.3 (1,378.3–1,582.0) 1,697.6 (1,454.7–1,980.0) 1,766.9 (1,401.3–2,229.9) 1,162.1 (526.6–2,563.1) 0.159 IgM (mg/dL) 132.4 (123.6–141.8)1 170.9 (146.6–199.3)2 171.6 (136.2–216.2)1,2 320.9 (145.9–705.2)1,2 0.001 Data are shown as the geometric mean (95% confidence interval) adjusted for age. The p values were tested by ANCOVA adjusted for age, sex, and sampling time point. Significant values are shown in bold. The Bonferroni test was used to identify significant differences between groups after the ANCOVA test. The same group is designated by the same number.
Values are presented as below: small: ID 3 to <5 mm, medium: ID 5 to <8 mm, giant: ID ≥8 mm.
ANCOVA = analysis of covariance; CAL = coronary artery lesion; ID = internal diameter; Ig = immunoglobulin.
A
CAL size (mm)
r=0.435, p<0.001
IgA (mg/dL)
0 0 100 200 300 400 500
2 10
4 6 8
B
CAL size (mm)
r=0.272, p<0.001
IgM (mg/dL)
0 100 200 300 400
2 10
4 6 8
Figure 2. Correlation between CAL size and (A) IgA and (B) IgM levels during the acute and subacute phases of KD. The largest internal diameters of coronary arteries were plotted against (A) IgA and (B) IgM levels. IgA and IgM levels correlated significantly with CAL size (IgA: r=0.435, p<0.001; IgM; r=0.272, p<0.001).
CAL = coronary artery lesion; Ig = immunoglobulin; KD = Kawasaki disease.
patients. Several potential genes associated with Ig levels were identified (Supplementary Tables 11 and 12). However, with the exception of the ACOXL-BCL2L11 locus, none of the loci associated with Ig levels or specific Ig isotype switching were associated with loci linked to KD susceptibility. One SNP (rs875063; located in the intron of the ACOXL gene) showed a strong association with IgE levels (p=2.73×10⁻⁶) and with IgE isotype switching (IgE/IgM) (p=2.61×10⁻⁷) (Supplementary Table 11). In particular, at the IgE level in patients with KD, the T allele increased by 1.5-fold per allele (GG genotype=38.4 KU/L; GT genotype=57.9 KU/L;
TT genotype=119.2 KU/L; p=2.3×10⁻⁵; Table 5). SNP rs875063 is located 65.4 kb upstream from the transcription start site of the BCL2L11 gene, which was identified as a strong KD susceptibility gene, especially in IVIG responders.9) However, the SNP associated with IgE levels (rs875063) was not linked to a previously reported SNP (rs3789065) located in the intron of the BCL2L11 gene, which is associated with KD (r2=0.013; Supplementary Figure 1).
This result indicates that the locus in the ACOXL gene determining IgE levels is independent of the KD susceptibility locus in the BCL2L11 gene, although both genes are located very near to each other. In addition, well-known susceptibility genes for KD (rs6993775 in BLK, rs1801274 in FCGR2A, rs3789065 in BCL2L11, rs9378199 in HLA-B) reported by us9)15) did not show an association with IgE levels or IgE isotype switching (Supplementary Table 13). These results suggest that elevated IgE levels in patients with KD do not affect the pathogenesis of KD (at least not directly).
DISCUSSION
The data presented herein show that 74% of patients with KD had elevated IgE levels, and that the ACOXL-BCL2L11 locus is associated significantly with IgE levels and IgE isotype switching. However, elevated IgE levels in patients with KD were not associated with inflammatory data or with clinical outcomes. By contrast, high levels of IgA and IgM were significantly associated with development of CALs.
High IgE levels during the acute phase are a characteristic of KD.17)18) This study also observed elevated IgE levels during all clinical phases of KD (compared with reference IgE values). Compared with controls, children with KD have a significantly higher incidence of allergic diseases associated with high IgE levels, including asthma, atopic dermatitis, and allergic rhinitis.19)20) Wei et al.21) also reported that children with allergic diseases are at high risk of KD, with the following adjusted ORs for having KD: 1.82 for urticaria, 1.44 for allergic rhinitis, and 1.22 for atopic dermatitis. All of these data suggest that KD tends to be associated with allergic diseases, and that both KD and allergic diseases share a common B cell-mediated pathogenesis. We also found that IgE levels were not associated with inflammatory laboratory data or with clinical outcome; the exception was that the incidence of complete KD was slightly higher in high IgE group (90.4% with complete KD vs. 79.4%
Table 5. Ig levels in patients with KD according to the genotype of rs875063 in ACOXL
Variables TT (n=55) TG (n=123) GG (n=63) p value
Age at onset (years) 3.08±1.67 3.03±2.40 2.88±2.30 0.877
IgE (KU/L) 119.2 (82.5–172)2 57.9 (45.9–72.9)1 38.4 (27.6–53.4)1 2.3×10⁻⁵ IgE/IgM 0.22 (0.16–0.32)2 0.10 (0.08–0.13)1 0.06 (0.04–0.09)1 3.0×10⁻⁶ Data are shown as the mean±standard deviation or as the geometric mean (95% confidence interval). The p values were calculated using ANOVA. Significant values are shown in bold. Tukey's test was used to identify significant differences between groups after the ANOVA test. The same group is designated by the same number.
ANOVA = analysis of variance; Ig = immunoglobulin; KD = Kawasaki disease.
in the normal IgE group; p=0.040). Therefore, the results indicate that elevated IgE levels in patients with KD may not affect the severity of inflammation or the pathogenesis of KD.
In this study, we found no significant difference between IgE and IgG levels and the clinical outcome of KD. However, IgA and IgM levels in the CAL group were significantly higher than those in the non-CAL group, and correlated with the severity of CALs. In particular, high IgA was much more significantly associated with CALs than IgM. For example, a larger effect size and significance was observed for IgA than for IgM when comparing the CAL group with the non-CAL group (Tables 2 and 4). Moreover, a higher correlation was observed between CAL size and Ig levels for IgA than for IgM (r=0.435, p<0.001 for IgA; r=0.272, p<0.001; Figure 2).
Furthermore, high IgA levels were significantly associated with CALs (44.7% vs. 20.8% in the normal IgA group, p<0.01; Supplementary Table 4), whereas high IgM levels were not (30.6% vs. 22.6% in the normal IgM group, p=0.332; Supplementary Table 5). All of these results indicate that high IgA levels are superior to high IgM levels as a prognostic marker for predicting CAL risk in KD. Sawaji et al.22) showed that IgG, IgM, and IgA z-scores in the CAL group (n=20) were significantly lower than those in the non-CAL group (n=68), and that a low IgG z-score was a risk factor for CALs. However, Yanagimoto et al.23) reported no difference in IgG, IgA, or IgM z-scores in patients with and without CALs (16 cases with CAL vs. 181 cases without CALs). However, these 2 studies examined a very small number of samples obtained before IVIG treatment. Ding et al.3) also reported no difference in IgA, IgG, and IgM levels between the CAL and non-CAL groups in a Chinese population. All of these results are different from our own. However, none of these previous studies are conclusive due to small sample sizes, different study populations, different measurement time points, and differences in data analysis methods. Further investigations are needed to identify true differences.
Recent studies suggest that the IgA response in KD may be an important contributor to vasculitis linked to cardiovascular inflammation. Noval Rivas et al.24) revealed that vascular inflammation is associated with intestinal permeability and elevated circulating secretory IgA (sIgA) levels in patients with KD, as well as with elevated sIgA and IgA deposition in vascular tissues in a mouse model of KD vasculitis. Furthermore, a high number of infiltrating oligoclonal IgA plasma cells were detected in inflammatory tissues of patients with KD.25)26) These results suggest that IgA plays an important role in mediating vascular damage in KD.
We observed elevated levels of IgA, IgM, and IgG during the subacute phase of KD, and constitutively elevated IgE levels during the entire clinical course of KD. However, GWAS suggested that none of the loci associated with Ig levels or specific Ig isotype switching in patients with KD were associated with known loci for Ig levels or KD susceptibility; the exception was the ACOXL-BCL2L11 locus. SNPs located in the ACOXL gene were significantly associated with both IgE levels and IgE isotype switching (Supplementary Table 11). ACOXL, which encodes acyl-CoA oxidase-like protein, participates in fatty acid β-oxidation, fatty acid metabolic processes, and oxidation/reduction. Missense variant rs1554005 in the ACOXL gene is associated with IgG isotype switching.27) Recent GWAS has implicated the ACOXL gene and its neighboring BCL2L11 gene, which is located 2.4 kb downstream, in chronic lymphocytic leukemia.28) The BCL2L11 gene is also associated with KD.9) In addition, rs1448187 in the BCL2L11 locus is associated with elevated levels of IgA and IgG.27) Wood et al.29) reported that upon infection by EBV, BCL2L11 was repressed by the EBV repressors EBNA3A and EBNA3C through inactivation of multiple enhancers in the regulatory hub encompassing the ACOXL gene. Therefore, even if the ACOXL gene SNP associated with IgE levels is not linked to the BCL2L11 gene SNP associated with KD susceptibility, the ACOXL locus may function as an enhancer that controls expression of BCL2L11 in human B cells (Supplementary Figure 1).
In this study, we demonstrated that high IgA levels may be a prognostic marker for predicting CAL risk in KD; however, the study has some limitations, including lack of healthy control Ig data, no continuous measurement of Ig concentrations in the same patients during all clinical phases, no information on the effect of IVIG infusion on the change of IgA and IgM levels, and no replication studies to confirm the GWAS results for Ig levels and Ig isotype switching. Therefore, further research is needed to overcome these limitations.
In summary, we found that the elevated IgE levels during all clinical phases are characteristic of KD, and we identified the ACOXL locus as being associated with IgE and IgE isotype switching in patients with KD. However, elevated IgE levels in patients with KD are not associated with clinical outcome. By contrast, IgA levels were significantly associated with development of CALs in KD.
ACKNOWLEDGEMENTS
We thank all patients and their families for participating in this study.
SUPPLEMENTARY MATERIALS
Supplementary Table 1
Reference values for IgA, IgG, and IgM13) Click here to view
Supplementary Table 2 Reference values for IgE14) Click here to view
Supplementary Table 3
Distribution of Ig levels according to sampling time Click here to view
Supplementary Table 4
Comparison of clinical and laboratory parameters among IgA groups Click here to view
Supplementary Table 5
Comparison of clinical and laboratory parameters among IgM groups Click here to view
Supplementary Table 6
Comparison of clinical and laboratory parameters between high IgE and normal IgE groups Click here to view
Supplementary Table 7
Comparison of clinical and laboratory parameters among IgG groups during the acute phase Click here to view
Supplementary Table 8
Comparison of clinical and laboratory parameters between low IgG (lower than median) and high IgG (higher than median) groups during the subacute phase
Click here to view
Supplementary Table 9
Comparison of clinical and laboratory parameters between the low IgG (bottom 25%) and high IgG (top 25%) groups during the subacute phase
Click here to view
Supplementary Table 10
Effects of Igs on CALs during the acute and subacute phases Click here to view
Supplementary Table 11
SNPs associated with Ig levels and the ratio of specific Igs to IgM in patients with KD Click here to view
Supplementary Table 12
SNPs associated with the IgG levels and the ratio of IgG to IgM in patients with KD Click here to view
Supplementary Table 13
Association between IgE or IgE/IgM levels and previously reported KD-associated SNPs Click here to view
Supplementary Figure 1
Association between the ACOXL-BCL2L11 locus and IgE levels (A) and KD susceptibility (B).
Shown are regional association plots, recombination rates, and LD for the ACOXL-BCL2L11 region on chromosome 2q13, with gene annotations superimposed. Each SNP was plotted with respect to its chromosomal position (x axis) and its −log10 p value (left, y axis) for the linear regression analysis of IgE levels (A) and allelic tests (B) from the GWAS. The significance level for the combined analysis of GWAS and the replication study for rs3789065 is also shown with respect to KD susceptibility (purple diamond) implied from published data.9) Estimated recombination rates (right, y axis) based on combined Japanese in Tokyo and Han Chinese in Beijing samples from the 1,000 genome project are plotted as a blue line.
The color of each SNP symbol represents its LD (using the r2 algorithm) with the top SNP
(purple diamond) within the association locus. The image above was generated using the LocusZoom program (http://locuszoom.org/).
Click here to view
REFERENCES
1. Kawasaki T. Acute febrile mucocutaneous syndrome with lymphoid involvement with specific desquamation of the fingers and toes in children. Arerugi 1967;16:178-222.
PUBMED
2. Scuccimarri R. Kawasaki disease. Pediatr Clin North Am 2012;59:425-45.
PUBMED | CROSSREF
3. Ding Y, Li G, Xiong LJ, et al. Profiles of responses of immunological factors to different subtypes of Kawasaki disease. BMC Musculoskelet Disord 2015;16:315.
PUBMED | CROSSREF
4. Bayers S, Shulman ST, Paller AS. Kawasaki disease: part II. Complications and treatment. J Am Acad Dermatol 2013;69:513.e1-513.e8.
PUBMED | CROSSREF
5. Newburger JW, Fulton DR. Kawasaki disease. Curr Opin Pediatr 2004;16:508-14.
PUBMED | CROSSREF
6. Onouchi Y, Ozaki K, Burns JC, et al. A genome-wide association study identifies three new risk loci for Kawasaki disease. Nat Genet 2012;44:517-21.
PUBMED | CROSSREF
7. Lee YC, Kuo HC, Chang JS, et al. Two new susceptibility loci for Kawasaki disease identified through genome-wide association analysis. Nat Genet 2012;44:522-5.
PUBMED | CROSSREF
8. Khor CC, Davila S, Breunis WB, et al. Genome-wide association study identifies FCGR2A as a susceptibility locus for Kawasaki disease. Nat Genet 2011;43:1241-6.
PUBMED | CROSSREF
9. Kwon YC, Kim JJ, Yun SW, et al. BCL2L11 is associated with Kawasaki disease in intravenous immunoglobulin responder patients. Circ Genom Precis Med 2018;11:e002020.
PUBMED | CROSSREF
10. Farh KK, Marson A, Zhu J, et al. Genetic and epigenetic fine mapping of causal autoimmune disease variants. Nature 2015;518:337-43.
PUBMED | CROSSREF
11. Onouchi Y. The genetics of Kawasaki disease. Int J Rheum Dis 2018;21:26-30.
PUBMED | CROSSREF
12. Newburger JW, Takahashi M, Gerber MA, et al. Diagnosis, treatment, and long-term management of Kawasaki disease: a statement for health professionals from the Committee on Rheumatic Fever, Endocarditis and Kawasaki Disease, Council on Cardiovascular Disease in the Young, American Heart Association. Circulation 2004;110:2747-71.
PUBMED | CROSSREF
13. Gregory GA, Andropoulos DB. Gregory's Pediatric Anesthesia, Fifth Edition. Hoboken (NJ): Blackwell Publishing Ltd.; 2012. p.1300-14.
14. Lindberg RE, Arroyave C. Levels of IgE in serum from normal children and allergic children as measured by an enzyme immunoassay. J Allergy Clin Immunol 1986;78:614-8.
PUBMED | CROSSREF
15. Kim JJ, Yun SW, Yu JJ, et al. A genome-wide association analysis identifies NMNAT2 and HCP5 as susceptibility loci for Kawasaki disease. J Hum Genet 2017;62:1023-9.
PUBMED | CROSSREF
16. Purcell S, Neale B, Todd-Brown K, et al. PLINK: a tool set for whole-genome association and population- based linkage analyses. Am J Hum Genet 2007;81:559-75.
PUBMED | CROSSREF
17. Kusakawa S, Heiner DC. Elevated levels of immunoglobulin E in the acute febrile mucocutaneous lymph node syndrome. Pediatr Res 1976;10:108-11.
PUBMED | CROSSREF
18. Koo CM, Choi SY, Kim DS, Kim KH. Relation between Kawasaki disease and immunoglobulin E. J Rheum Dis 2013;20:4-8.
CROSSREF
19. Liew WK, Lim CW, Tan TH, et al. The effect of Kawasaki disease on childhood allergies - a sibling control study. Pediatr Allergy Immunol 2011;22:488-93.
PUBMED | CROSSREF
20. Kuo HC, Chang WC, Yang KD, et al. Kawasaki disease and subsequent risk of allergic diseases: a population-based matched cohort study. BMC Pediatr 2013;13:38.
PUBMED | CROSSREF
21. Wei CC, Lin CL, Kao CH, et al. Increased risk of Kawasaki disease in children with common allergic diseases. Ann Epidemiol 2014;24:340-3.
PUBMED | CROSSREF
22. Sawaji Y, Haneda N, Yamaguchi S, et al. Coronary risk factors in acute Kawasaki disease: correlation of serum immunoglobulin levels with coronary complications. Acta Paediatr Jpn 1998;40:218-25.
PUBMED | CROSSREF
23. Yanagimoto K, Nomura Y, Masuda K, et al. Immunoglobulin G values before treatment are correlated with the responsiveness to initial intravenous immunoglobulin therapy for Kawasaki disease. Int Arch Allergy Immunol 2014;164:83-8.
PUBMED | CROSSREF
24. Noval Rivas M, Wakita D, Franklin MK, et al. Intestinal permeability and IgA provoke immune vasculitis linked to cardiovascular inflammation. Immunity 2019;51:508-521.e6.
PUBMED | CROSSREF
25. Rowley AH, Eckerley CA, Jäck HM, Shulman ST, Baker SC. IgA plasma cells in vascular tissue of patients with Kawasaki syndrome. J Immunol 1997;159:5946-55.
PUBMED
26. Rowley AH, Shulman ST, Mask CA, et al. IgA plasma cell infiltration of proximal respiratory tract, pancreas, kidney, and coronary artery in acute Kawasaki disease. J Infect Dis 2000;182:1183-91.
PUBMED | CROSSREF
27. Jonsson S, Sveinbjornsson G, de Lapuente Portilla AL, et al. Identification of sequence variants influencing immunoglobulin levels. Nat Genet 2017;49:1182-91.
PUBMED | CROSSREF
28. Berndt SI, Camp NJ, Skibola CF, et al. Meta-analysis of genome-wide association studies discovers multiple loci for chronic lymphocytic leukemia. Nat Commun 2016;7:10933.
PUBMED | CROSSREF
29. Wood CD, Veenstra H, Khasnis S, et al. MYC activation and BCL2L11 silencing by a tumour virus through the large-scale reconfiguration of enhancer-promoter hubs. Elife 2016;5:e18270.
PUBMED | CROSSREF