http://e-nrp.org
Sarcopenic obesity can be negatively associated with active physical activity and adequate intake of some nutrients in Korean elderly:
Findings from the Korea National Health and Nutrition Examination Survey (2008-2011)
Jina Son, Qiming Yu and Jung-Sook Seo
§Department of Food and Nutrition, Yeungnam University, 280, Daehak-ro, Gyeongsan 38541, Korea
BACKGROUND/OBJECTIVES: The aim of this study was to analyze the factors related to sarcopenic obesity among the elderly in South Korea.
SUBJECTS/METHODS: A total of 3,367 elderly (≥ 65 years) from the Korea National Health and Nutrition Examination Survey (2008-2011) were included in this analysis. The subjects were assessed to determine their sarcopenia and obesity status. Sarcopenia was assessed by determining their appendicular skeletal muscle mass (ASM). Obesity was defined by the waist circumference.
An association of sarcopenic obesity and the related factors was analyzed using multiple logistic regression models.
RESULTS: The risk of sarcopenic obesity of the subjects was decreased by active physical activity. After adjusting for age, smoking, and alcohol consumption, the risk of sarcopenic obesity in men of the highest level group (Q4) decreased by 45% (OR =
0.550, 95% CI = 0.334-0.905, P trend 0.018) compared to that in the reference group (Q1). Among the women, the risk of sarcopenic obesity in the Q3 and Q4 groups decreased by 29.0% (OR = 0.710, 95% CI = 0.512-0,984) and 56.7% (OR = 0.433, 95% CI = 0.281-0.668), respectively, compared to that in the Q1 group (P trend < 0.001). The mean daily energy intake was higher in the non-sarcopenia group than in the sarcopenia group. The risk of sarcopenic obesity in subjects not meeting the recommended intakes of energy, riboflavin, and vitamin C increased significantly by 25.4%, and 36.6%, and 32.6%, respectively, compared to that in the subjects meeting the recommended nutrient intake.
CONCLUSION: Active physical activity as well as an adequate intake of energy and some vitamins might be negatively associated with the development of sarcopenia and sarcopenic obesity in the elderly.
Nutrition Research and Practice 2019;13(1):47-57; https://doi.org/10.4162/nrp.2019.13.1.47; pISSN 1976-1457 eISSN 2005-6168
Keywords: Sarcopenia, sarcopenic obesity, elderly, physical activity, nutrient
INTRODUCTION
7)Within the aging process, an increase in body fat mass and a gradual decrease in muscle mass may cause changes in body composition, which may have a negative effect on the health of the elderly [1,2]. As the elderly portion of the population is increasing rapidly, such changes in body composition can be a source of major health problems in the elderly [3].
Sarcopenia is defined as a loss of muscle mass and muscle strength with age [4]. Typically, the body has the highest muscle mass at 30 years of age. The muscle mass begins to decrease gradually from 40 years of age onward with muscle loss accelerating with age [5].
Recently, a remarkable increase in morbidity of obese elderly subjects in western countries has been reported [6,7]. According to the results from the 2011-2012 U.S. national health and nutrition examination survey, more than a third of Americans
aged 60 years and over are obese [8]. A similar trend has been detected in South Korea with the prevalence of obesity among the elderly increasing from 38.9% in 2010 to 46% in 2015 [9].
The physiological changes associated with age-related muscle mass loss and body fat gain, have recently been described as part of an overall medical condition known as sarcopenic obesity [10]. Some studies have indicated that sarcopenic obesity in the elderly may not only increase the incidence of cardiovascular diseases [11] and diabetes [12], but also have an adverse influence on the state of inflammation in the body [13]; it may even increase mortality [14]. In other studies, the risk of morbidity was much higher in subjects exhibiting both obesity and sarcopenia than in subjects with only one of those conditions [15].
Previous studies have reported that sarcopenic obesity can be prevented by actively participating in physical activities [16], increasing muscle movement [17], having an adequate protein
§Corresponding Author: Jung-Sook Seo, Tel. 82-53-810-2875, Fax. 82-53-810-4768 Email. [email protected] Received: January 15, 2019, Revised: January 18, 2019, Accepted: January 22, 2019
This is an Open Access article distributed under the terms of the Creative Commons Attribution Non-Commercial License (http://creativecommons.org/licenses/by-nc/3.0/) which permits unrestricted non-commercial use, distribution, and reproduction in any medium, provided the original work is properly cited.
intake [18], and consuming foods that incorporate antioxidant nutrients [19].
In the present study, data obtained from the nationally representative 2008-2011 Korea National Health and Nutrition Examination Survey (KNHANES) were analyzed to determine if the factors associated with exercise and nutrition are related to the presence of sarcopenic obesity among the elderly in South Korea.
SUBJECTS AND METHODS Study subjects
The target subjects in the present study were people aged 65 years and older who participated in the 4
thand 5
thKNHANES (2008-2011). KNHANES is a survey initiated in 1995 and was initially conducted every three years until it was changed to an annual survey system from the 4
thperiod onward. KNHANES was designed to provide useful data on the health and nutritional status of people in South Korea.
The subjects in the present study completed the KNHANES diagnostic surveys regarding their bone density and body fat, which are required to calculate the muscle mass. The number of potential participants was 6370; however, 3003 of those were excluded from participation because they did not provide dual-energy X-ray absorptiometry (DXA), dietary intake, or blood biochemical data. Therefore, the data obtained from 3,367 subjects were included in this study. The institutional Review Board (IRB) of the Korea Center for Disease Control and Prevention approved the KNHANES (IRB. 2008-04EXP-01-C, 2009-01CON-03-2C, and 2011-02CON-06-C). In addition, this study was conducted with approval from the IRB of Yeungnam University (IRB 2018-04-012).
Assessment of sarcopenia and obesity
The standard described by Lim et al. [20] was used to diagnose sarcopenia in this study. The appendicular skeletal muscle mass (ASM) was calculated by subtracting the weight of bone and fat from the weight of the limbs based on the DXA results. After converting the ASM (kg) to ASM/body weight x 100, the subjects were diagnosed as being sarcopenic when their ASM estimate was less than one standard deviation below the gender-specific mean ASM for healthy young adults. Obesity was defined as the presence of a waist circumference > 90 cm for men or > 85 cm for women subjects and was based on the obesity assessment of the Korean Society for the Study of Obesity (2012) [21].
All subjects were then divided into two obesity-based groups:
non-obese and obese. The two groups were divided further into a non-sarcopenia group and sarcopenia group.
Blood biochemical parameters of the subjects
The total cholesterol, triglyceride, HDL-cholesterol, LDL- cholesterol, fasting plasma glucose, glycated hemoglobin (HbA1c), homeostatic model assessment for insulin resistance (HOMA-IR), vitamin D, and parathyroid hormone were used to assess status of the blood biochemical parameters in the subjects. The total cholesterol, triglyceride, HDL-cholesterol, LDL-cholesterol, and fasting plasma glucose were measured
using an automatic analyzer (AVIDA 1650, Bayer, New York, USA). HbA1c was measured by high-performance liquid chromatography (Tosoh G8, Tokyo, Japan).
Assessment of physical activity participation
The parameters related to physical activity of the subjects included vigorous physical activity, moderate physical activity, and walking. Vigorous physical activity of the subjects was reported if they answered ever having exercised vigorously for more than 10 minutes per session, 20 minutes per day, and 3 days per week. Moderate physical activity and walking practice rate of the subjects were reported if they answered ever having exercised moderately or having walked more than 10 minutes per session, 30 minutes per day, and 5 days per week, respectively. Considering that the subjects were elderly, the physical activity participation rate was analyzed by classifying the subjects into two groups of vigorous physical activity and moderate physical activity participation or not. The walking participation rate was reported after dividing into quartiles according to the levels, such as low, mid-low, mid-high, and high. The range of values for each walking quartile was as follows [22]: for men, low, mid-low, mid-high, and high were 0-19 minutes, 20-59 minutes, 60-119 minutes, and ≥ 120 minutes, respectively; and for women, the values were 0-9 minutes, 10-29 minutes, 30-59 minutes, and ≥ 60 minutes, respectively. The metabolic equivalent task (MET) was calculated using the parameters of vigorous physical activity, moderate physical activity, and walking as follows: MET (min/week) = {days of vigorous physical activity /week × minutes of vigorous physical activity/day × 8} + {days of moderate physical activity/week × minutes of moderate physical activity/day × 4} + {days of walking/
week × minutes of walking/day × 3.3}. The odds ratio of sarcopenic obesity according to physical activity level was analyzed by MET quartile.
Measurement of the dietary intake
The dietary intake data of the subjects from a 24-h recall method were analyzed to estimate the energy and nutrient intakes. The dietary intake survey was conducted in a way that people trained by regular education have interviews with the subjects. The odds ratio of sarcopenic obesity according to the nutrient intake level or recommended nutrient intake was analyzed by the nutrient intake quartile or assessing the risk of the subjects who did not meet the recommended nutrient intake, respectively.
Statistical Analysis
All analyses were extracted by stratified cluster sampling, and
the standard plots and weights were used so that the data used
in this study would represent the Korean people using the data
analysis method of complex sampling. To compare the general
characteristics of the sarcopenia and non-sarcopenia groups,
chi-squares and Student’s t-tests were used to analyze the
categorical variables and continuous variables, respectively. The
results are presented as the mean±SD. The continuous variables
of the four groups were analyzed by ANOVA and a least
significance difference (LSD) post hoc comparison. In addition,
the odds ratio of the sarcopenic obesity risk was analyzed using
Variable
Non-obese
P-value2)
Obese
P-value Non-sarcopenia
(n = 1,612) Sarcopenia
(n = 508) Non-sarcopenia
(n = 509) Sarcopenia
(n = 738) Age
Men 71.4 ± 0.221) 72.5 ± 0.42 0.021 70.7 ± 0.41 71.9 ± 0.37 0.023
Women 73.1 ± 0.27 71.9 ± 0.40 0.014 71.4 ± 0.31 72.4 ± 0.34 0.035
Body weight (kg)
Men 58.7 ± 0.34a 61.0 ± 0.48b < 0.001 71.7 ± 0.81c 72.5 ± 0.53c 0.395
Women 49.2 ± 0.27a 53.2 ± 0.42b < 0.001 60.6 ± 0.37c 62.7 ± 0.46d < 0.001
Body mass index (kg/m2)
Men 21.6 ± 0.10a 22.8 ± 0.15b < 0.001 25.6 ± 0.21c 26.2 ± 0.17d 0.023
Women 21.8 ± 0.09a 23.9 ± 0.15b < 0.001 25.8 ± 0.11c 27.3 ± 0.16d < 0.001
Waist circumference (cm)
Men 79.6 ± 0.33a 83.0 ± 0.39b < 0.001 93.8 ± 0.33c 95.3 ± 0.31d < 0.001
Women 75.9 ± 0.26a 80.3 ± 0.29b < 0.001 90.6 ± 0.28c 92.9 ± 0.36d < 0.001
Total body fat Percentage (%)
Men 19.1 ± 0.20a 26.1 ± 0.38c < 0.001 23.2 ± 0.28b 28.6 ± 0.27d < 0.001
Women 30.0 ± 0.25a 37.9 ± 0.32c < 0.001 34.4 ± 0.22b 39.8 ± 0.19d < 0.001
ASM (kg)
Men 19.4 ± 0.12b 17.5 ± 0.17a < 0.001 22.9 ± 0.29d 20.3 ± 0.17c < 0.001
Women 13.1 ± 0.06b 11.9 ± 0.12a < 0.001 15.3 ± 0.10d 13.7 ± 0.11c < 0.001
1)Mean±SD.
2)P-values from a Student’s t-test.
a-dLSD multiple-comparisons post hoc test (a) < (b) < (c) < (d).
ASM, appendicular skeletal muscle.
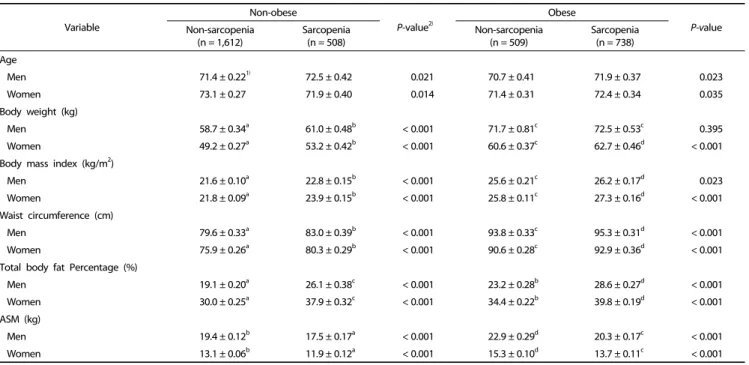
Table 1. General characteristics and physical measurements of the subjects
multiple logistic regression models. All statistical tests were performed using IBM SPSS Statistics (ver. 22.0; IBM Co., Armonk, NY, USA). Statistical significance was considered at P < 0.05.
RESULTS
General and physical characteristics of the subjects
The subjects were divided into four groups: obese, sarcopenic obese, non-obese, and sarcopenic non-obese. Table 1 lists the general characteristics and physical measurements of each group. The average age of the non-obese sarcopenic men was 72.5 ± 0.42 years, which was significantly higher than that of the non-obese men without sarcopenia (P = 0.021). The average ages of the obese and sarcopenic obese men were 70.7 ± 0.41 years and 71.9 ± 0.37 years, respectively. Similar to the results in the non-obese men groups, the average age of the sarcopenic obese men was significantly higher than that of the obese-only men. Likewise, for female subjects, the age of the sarcopenic obese women was significantly higher than that in the obesity- only group (P = 0.035). The average age of the sarcopenia group was significantly lower than that of the non-sarcopenia group in non-obese women (P = 0.014).
With regard to the body fat percentages among the male subjects, the sarcopenia group had significantly higher percentages than the non-sarcopenia group, regardless of the obesity status (P < 0.001). The body fat percentage in the obesity-only men was 23.2 ± 0.28%, which was significantly lower than that of the sarcopenic obese men (28.6 ± 0.27%;
< 0.001). Among the female subjects, the body fat percentage of the non-obese sarcopenia group was 37.9 ± 0.32%, which was significantly higher than that of the non-obese women without
sarcopenia (30.0 ± 0.25%; P < 0.001). Among the obese women, the body fat percentage was significantly higher in the sarcopenic group (39.8 ± 0.19%) than in the non-sarcopenic group (34.4 ± 0.22%; P < 0.001). Regardless of gender, the body fat percentage was highest in the sarcopenic obese group (P
< 0.001). ASM was significantly lower in the sarcopenia group than in the non-sarcopenia group according to gender and obese status (P < 0.001).
Blood biochemical parameters of the subjects
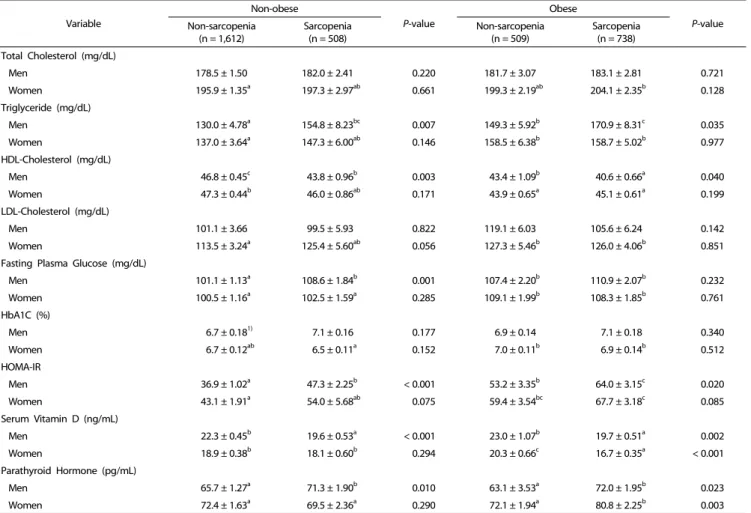
Table 2 lists the results of blood biochemical analyses. The blood triglyceride level of the men was significantly higher in the sarcopenic obese group (170.9 ± 8.31 mg/dL) than in the obese-only group (P = 0.035). The triglyceride level was 154.8
± 8.23 mg/dL among the men in the non-obese sarcopenia group, which was significantly higher than the 130.0 ± 4.78 mg/dL measured in the non-obese men without sarcopenia (P = 0.007). Based on post hoc analysis, the blood triglyceride level was highest in the sarcopenic obese men (P < 0.001). The triglyceride levels were similar in the obese women groups.
Among the men, the concentration of HDL-C was 40.6 ± 0.66 mg/dL in the sarcopenic obese group, which was significantly lower than that in the obese-only group (43.4 ± 1.09 mg/dL;
P = 0.040). Among the non-obese men, there was a significant difference between those with sarcopenia (43.8 ± 0.96 mg/dL) and those without (46.8 ± 0.45 mg/dL; P = 0.003). The HDL-C level was lower in the sarcopenic obese men than in the non-sarcopenic obese men (P = 0.040). The HDL-cholesterol levels were similar in the female groups.
The fasting plasma glucose level in the non-obese male
subjects was significantly lower in the non-sarcopenia group
Variable
Non-obese
P-value
Obese
P-value Non-sarcopenia
(n = 1,612)
Sarcopenia (n = 508)
Non-sarcopenia (n = 509)
Sarcopenia (n = 738) Total Cholesterol (mg/dL)
Men 178.5 ± 1.50 182.0 ± 2.41 0.220 181.7 ± 3.07 183.1 ± 2.81 0.721
Women 195.9 ± 1.35a 197.3 ± 2.97ab 0.661 199.3 ± 2.19ab 204.1 ± 2.35b 0.128
Triglyceride (mg/dL)
Men 130.0 ± 4.78a 154.8 ± 8.23bc 0.007 149.3 ± 5.92b 170.9 ± 8.31c 0.035
Women 137.0 ± 3.64a 147.3 ± 6.00ab 0.146 158.5 ± 6.38b 158.7 ± 5.02b 0.977
HDL-Cholesterol (mg/dL)
Men 46.8 ± 0.45c 43.8 ± 0.96b 0.003 43.4 ± 1.09b 40.6 ± 0.66a 0.040
Women 47.3 ± 0.44b 46.0 ± 0.86ab 0.171 43.9 ± 0.65a 45.1 ± 0.61a 0.199
LDL-Cholesterol (mg/dL)
Men 101.1 ± 3.66 99.5 ± 5.93 0.822 119.1 ± 6.03 105.6 ± 6.24 0.142
Women 113.5 ± 3.24a 125.4 ± 5.60ab 0.056 127.3 ± 5.46b 126.0 ± 4.06b 0.851
Fasting Plasma Glucose (mg/dL)
Men 101.1 ± 1.13a 108.6 ± 1.84b 0.001 107.4 ± 2.20b 110.9 ± 2.07b 0.232
Women 100.5 ± 1.16a 102.5 ± 1.59a 0.285 109.1 ± 1.99b 108.3 ± 1.85b 0.761
HbA1C (%)
Men 6.7 ± 0.181) 7.1 ± 0.16 0.177 6.9 ± 0.14 7.1 ± 0.18 0.340
Women 6.7 ± 0.12ab 6.5 ± 0.11a 0.152 7.0 ± 0.11b 6.9 ± 0.14b 0.512
HOMA-IR
Men 36.9 ± 1.02a 47.3 ± 2.25b < 0.001 53.2 ± 3.35b 64.0 ± 3.15c 0.020
Women 43.1 ± 1.91a 54.0 ± 5.68ab 0.075 59.4 ± 3.54bc 67.7 ± 3.18c 0.085
Serum Vitamin D (ng/mL)
Men 22.3 ± 0.45b 19.6 ± 0.53a < 0.001 23.0 ± 1.07b 19.7 ± 0.51a 0.002
Women 18.9 ± 0.38b 18.1 ± 0.60b 0.294 20.3 ± 0.66c 16.7 ± 0.35a < 0.001
Parathyroid Hormone (pg/mL)
Men 65.7 ± 1.27a 71.3 ± 1.90b 0.010 63.1 ± 3.53a 72.0 ± 1.95b 0.023
Women 72.4 ± 1.63a 69.5 ± 2.36a 0.290 72.1 ± 1.94a 80.8 ± 2.25b 0.003
1)Mean±SD.
2)P-values from a t-test.
a-cLSD multiple-comparisons post hoc test (a) < (b) < (c).
HbA1C, glycosylated hemoglobin; HOMA-IR, homeostatic model assessment for insulin resistance.
Table 2. Blood biochemical parameters of the subjects
(101 ± 1.13 mg/dL) than in the sarcopenia group (108.6 ± 1.84 mg/dL; P = 0.001). Among the non-obese men, HOMA-IR was significantly lower in the non-sarcopenia group (36.9 ± 1.02) than in the sarcopenia group (47.3 ± 2.25; P < 0.001). Among the obese men, the HOMA-IR level was significantly lower in the obese-only group (53.2 ± 3.35) than in the sarcopenic obese group (64.0 ± 3.15; P = 0.020). Among all male groups, the insulin resistance level was highest in the sarcopenic obese group followed in order by the obese non-sarcopenia group, non-obese sarcopenia group, and non-obese non-sarcopenia group (P < 0.001; Table 1). The HOMA-IR levels were similar in the female groups
The blood vitamin D level in the non-obese men was significantly higher in the non-sarcopenia group (22.3 ± 0.45 ng/mL) than in the sarcopenia group (19.6 ± 0.53 ng/mL; P <
0.001). Similarly, among the obese men, there was a significantly higher vitamin D level in the non-sarcopenic group (23.0 ± 1.07 ng/mL) than in the sarcopenic group (19.7 ± 0.51 ng/mL; P = 0.002). Among the obese women, the vitamin D level was significantly lower in the sarcopenic group than in the non-sarcopenic group (P < 0.001).
The parathyroid hormone level of the obese men was 72.0
± 1.95 pg/mL in the sarcopenic group, which was significantly higher than that in the non-sarcopenic group (63.1 ± 3.53 pg/dL;
P = 0.023). Among the non-obese men, the sarcopenia group had a significantly higher level of parathyroid hormone than the non-sarcopenia group (P = 0.010). In the female subjects, the parathyroid hormone level was higher in the sarcopenic obese group (80.8 ± 2.25 pg/mL) than in the obese group without sarcopenia (72.1 ± 1.94 pg/mL; P = 0.003).
Physical activity participation rate of the subjects
Table 3 lists pysical activity participation rates among the four
obesity/sarcopenia groups. The rate of participation in vigorous
physical activity among the obese men was 10.2% in the
sarcopenia group and significantly higher (20.4%; P = 0.023) in
the non-sarcopenia group. Among the obese women, the rate
of participation in moderate physical activity in the non-
sarcopenia group (14.3%) was significantly higher than that in
the sarcopenia group (8.0%; P = 0.028). In addition, in the obese
women, there was significant difference in the participation in
walking between the sarcopenia and non-sarcopenia groups (P
Variable
Non-obese
P-value2)
Obese
P-value Non-sarcopenia
(n = 1,612)
Sarcopenia (n = 508)
Non-sarcopenia (n = 509)
Sarcopenia (n = 738) Vigorous physical activity
Men 107 (12.8)1) 30 (11.2) 0.547 23 (20.4) 26 (10.2) 0.023
Women 89 (10.5) 20 (9.0) 0.615 40 (8.9) 39 (6.9) 0.331
Moderate physical activity
Men 124 (14.9) 30 (11.2) 0.217 21 (11.1) 29 (10.6) 0.877
Women 120 (12.2) 26 (11.5) 0.799 55 (14.3) 44 (8.0) 0.028
Walking Men
Low 202 (26.6) 78 (27.4) 0.276 37 (27.0) 68 (24.1) 0.832
Mid-Low 151 (19.2) 68 (25.7) 41 (24.7) 58 (25.2)
Mid-High 198 (24.2) 64 (21.8) 39 (23.9) 74 (28.2)
High 216 (30.0) 63 (25.2) 41 (24.3) 66 (22.5)
Women
Low 210 (24.5) 45 (16.3) 0.221 70 (18.6) 132 (27.5) 0.032
Mid-Low 136 (14.7) 39 (17.4) 64 (19.4) 71 (14.2)
Mid-High 205 (26.9) 67 (30.5) 93 (26.4) 146 (29.5)
High 294 (33.8) 84 (35.8) 124 (35.5) 123 (28.7)
Resistance exercise (days) Men
less than 2 days 157 (21.7) 64 (25.6) 0.293 33 (20.3) 66 (22.7) 0.609
2 days or more 610 (78.3) 209 (74.4) 125 (79.7) 200 (77.3)
Women
less than 2 days 53 (5.9) 20 (8.0) 0.407 14 (4.6) 28 (7.0) 0.298
2 days or more 792 (94.1) 215 (92.0) 337 (95.4) 444 (93.0)
1)N (%)
2)P-values from a chi-square test.
Table 3. Physical activity participation rates of the subjects
Variable
Non-obese
P-value2)
Obese
P-value Non-sarcopenia
(n = 1,612) Sarcopenia
(n = 508) Non-sarcopenia
(n = 509) Sarcopenia
(n = 738) Men
Low 134 (16.6)1) 66 (23.8) 0.011 17 (7.4) 48 (20.3) < 0.001
Mid-Low 156 (21.6) 75 (27.2) 40 (23.6) 73 (29.7)
Mid-High 205 (27.0) 67 (25.8) 46 (30.6) 86 (28.3)
High 272 (34.8) 65 (23.3) 55 (38.5) 59 (21.7)
Women
Low 232 (28.1) 73 (29.5) 0.293 98 (27.3) 174 (36.4) 0.065
Mid-Low 212 (26.0) 67 (25.6) 92 (27.2) 128 (28.6)
Mid-High 194 (22.9) 59 (28.2) 83 (27.3) 104 (23.0)
High 207 (23.0) 36 (16.8) 78 (18.3) 66 (12.0)
1)N (%)
2)P-values from a chi-square test.
MET, metabolic equivalent task.
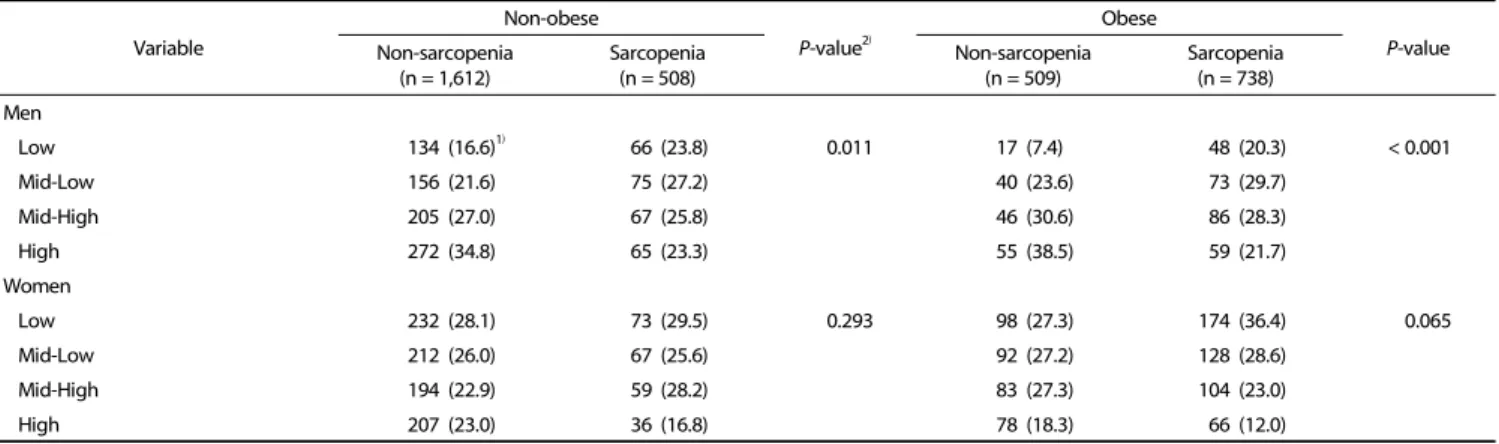
Table 4. Physical activity (MET-min/week) level of the subjects
= 0.032). The rates of participation in resistance exercise were similar in all groups of both sexes.
Physical activity level of the subjects
The physical activity levels of each group of subjects were divided into quartiles based on the metabolic equivalent of a task (MET) measured in minutes per week (MET-min/week): low,
mid-low, mid-high, and high, as summarized in Table 4. Significant
differences in MET levels in both the non-obese and obese men
were observed between the sarcopenia and non-sarcopenia
groups (P = 0.011, P < 0.001, respectively). Despite the trend
toward a difference between the non-sarcopenia and sarcopenia
groups (p = 0.065) of obese women, the difference was not
significant.
Physical activity (MET-min/week)
Q1 (< 325)
Q2 (325-1,154)
Q3 (1,155-2,969)
Q4
(2,970 ≤) P-trend3)
Model 11) OR (95% CI)
Men reference 1.090 (0.651-1.827) 0.895 (0.545-1.469) 0.575 (0.352-0.937) 0.014
Women reference 0.836 (0.595-1.173) 0.696 (0.503-0.964) 0.432 (0.281-0.665) < 0.001
Model 22) OR (95% CI)
Men reference 1.029 (0.616-1.719) 0.851 (0.514-1.408) 0.550 (0.334-0.905) 0.018
Women reference 0.841 (0.599-1.182) 0.710 (0.512-0.984) 0.433 (0.281-0.668) < 0.001
1)Model 1 was adjusted for age.
2)Model 2 was adjusted for age, smoking, and alcohol drinking.
3)P-trend values from multiple regression models.
OR, odds ratio; CI, confidence interval.
Table 5. Odds ratio of sarcopenic obesity according to physical activity level
Variable
Non-obese Obese
P-value2) Non-sarcopenia
(n = 1,612) Sarcopenia
(n = 508) Non-sarcopenia
(n = 509) Sarcopenia
(n = 738)
Energy (kcal) 1,961.7 ± 37.591)b 1,827.4 ± 42.95a 2,126.8 ± 99.53b 1,857.6 ± 41.08a 0.006
Carbohydrate (g) 179.13 ± 1.34 175.13 ± 2.49 177.82 ± 3.52 177.90 ± 2.02 0.530
protein (g) 32.79 ± 0.39 33.96 ± 0.65 34.15 ± 0.85 33.19 ± 0.65 0.168
Fat (g) 13.31 ± 0.32 15.09 ± 0.66 13.78 ± 0.62 14.32 ± 0.55 0.058
Calcium (mg) 257.72 ± 8.79 263.68 ± 12.13 278.94 ± 13.65 266.44 ± 14.55 0.623
phosphorus (mg) 598.38 ± 5.81 618.58 ± 11.12 613.03 ± 13.93 603.37 ± 11.03 0.376
Sodium (mg) 2,566.73 ± 66.42 2,534.27 ± 89.74 2,678.93 ± 156.74 2,671.96 ± 105.42 0.666
potassium (mg) 1,523.62 ± 23.81 1,590.67 ± 53.71 1,572.98 ± 60.83 1,558.53 ± 51.18 0.612
Iron (mg) 8.01 ± 0.37 8.47 ± 0.58 8.83 ± 0.46 7.71 ± 0.35 0.223
Vitamin A (μg/RE) 359.43 ± 17.14a 348.78 ± 26.32a 453.13 ± 29.20b 348.31 ± 24.66a 0.021
Thiamin (mg) 0.61 ± 0.01 0.63 ± 0.02 0.59 ± 0.02 0.60 ± 0.02 0.504
Riboflavin (mg) 0.52 ± 0.01 0.52 ± 0.02 0.56 ± 0.02 0.50 ± 0.02 0.125
Niacin (mg) 7.81 ± 0.11 8.03 ± 0.22 8.00 ± 0.25 7.88 ± 0.18 0.795
Vitamin C (mg) 50.03 ± 1.71 51.71 ± 2.69 52.68 ± 4.68 44.76 ± 2.40 0.125
1)Mean±SD.
2)P-values from an ANOVA test.
a,bLSD multiple-comparisons post hoc test (a) < (b).
Table 6. Mean daily energy and nutrient intake per 1,000 kcal of the male subjects
Variable
Non-obese Obese
P-value2) Non-sarcopenia
(n = 1,612)
Sarcopenia (n = 508)
Non-sarcopenia (n = 509)
Sarcopenia (n = 738)
Energy (kcal) 1,417.2 ± 23.381)a 1,363.3 ± 44.92a 1,524.8 ± 42.10b 1,371.2 ± 27.48a 0.016
Carbohydrate (g) 195.56 ± 0.87b 191.53 ± 1.79a 192.00 ± 1.43a 192.74 ± 1.27ab 0.038
protein (g) 30.39 ± 0.34a 32.47 ± 0.72b 30.95 ± 0.52ab 31.71 ± 0.53b 0.025
Fat (g) 11.08 ± 0.28a 12.97 ± 0.57b 12.13 ± 0.46b 12.18 ± 0.44b 0.007
Calcium (mg) 244.18 ± 7.19 270.46 ± 14.52 255.67 ± 13.35 297.18 ± 32.73 0.193
phosphorus (mg) 580.63 ± 5.66a 625.29 ± 12.96b 580.32 ± 8.69a 593.20 ± 7.98a 0.015
Sodium (mg) 2,339.98 ± 62.84 2,446.10 ± 122.67 2,375.58 ± 102.72 2,423.30 ± 75.44 0.797
potassium (mg) 1,515.04 ± 29.02 1,660.26 ± 59.93 1,485.49 ± 32.61 1,527.98 ± 34.53 0.086
Iron (mg) 8.21 ± 0.54 7.84 ± 0.37 8.85 ± 0.71 8.36 ± 0.48 0.614
Vitamin A (μg/RE) 385.24 ± 22.11 382.37 ± 33.06 362.69 ± 32.14 390.85 ± 23.84 0.905
Thiamin (mg) 0.58 ± 0.01 0.61 ± 0.02 0.58 ± 0.01 0.60 ± 0.01 0.250
Riboflavin (mg) 0.48 ± 0.01 0.53 ± 0.02 0.48 ± 0.02 0.51 ± 0.01 0.097
Niacin (mg) 7.02 ± 0.09a 7.65 ± 0.19b 7.32 ± 0.12b 7.47 ± 0.14b 0.002
Vitamin C (mg) 51.56 ± 1.72 55.32 ± 3.46 46.27 ± 2.30 49.82 ± 2.25 0.103
1)Mean±SD.
2)P-values from an ANOVA test.
a,bLSD multiple-comparisons post hoc test (a) < (b).
Table 7. Mean daily energy and nutrient intake per 1,000 kcal of the female subjects
Odds ratio of sarcopenic obesity according to the physical activity level of the subjects
Table 5 lists the results of the OR-based analysis of sarcopenic obesity by physical activity level. The subjects were divided into
quartiles (Q1, Q2, Q3, and Q4) based on their level of
MET-min/week. The data were adjusted for age (model 1) and
for age, smoking, and alcohol consumption (model 2). Among
the men, the risk of sarcopenic obesity was significantly lower
Nutrient Model Q1 Q2 Q3 Q4 P-trend3) Energy (< 1,209.89 kcal) (1,209.89-1,555.70 kcal) (1,555.71-1,949.34 kcal) (1,949.35 kcal≤)
11) (reference) 0.966 (0.729-1.279) 0.871 (0.658-1.154) 0.702 (0.514-0.959) 0.125
22) (reference) 0.967 (0.730-1.280) 0.861 (0.652-1.138) 0.725 (0.529-0.993) 0.197
protein (< 33.61 g) (33.61-47.70 g) (47.71-65.98 g) (65.99 g ≤)
1 (reference) 1.074 (0.792-1.457) 0.992 (0.716-1.373) 1.010 (0.743-1.372) 0.966
2 (reference) 1.085 (0.797-1.478) 0.982 (0.710-1.359) 1.022 (0.751-1.391) 0.944
Calcium (< 203.58 mg) (203.58-327.07 mg) (327.08-513.77 mg) (513.78 mg≤)
1 (reference) 0.904 (0.670-1.220) 1.109 (0.815-1.508) 1.014 (0.742-1.386) 0.593
2 (reference) 0.902 (0.667-1.220) 1.158 (0.849-1.579) 1.055 (0.771-1.442) 0.418
phosphorus (< 673.79 mg) (673.79-905.63 mg) (905.64-1,179.54 mg) (1,179.55 mg≤)
1 (reference) 0.866 (0.645-1.162) 0.978 (0.720-1.328) 0.839 (0.610-1.155) 0.583
2 (reference) 0.880 (0.653-1.184) 0.977 (0.720-1.326) 0.864 (0.626-1.192) 0.717
Iron (< 6.42 mg) (6.42-9.92 mg) (9.93-15.88 mg) (15.89 mg≤)
1 (reference) 0.884 (0.657-1.189) 1.139 (0.859-1.511) 0.880 (0.632-1.226) 0.242
2 (reference) 0.884 (0.655-1.193) 1.118 (0.840-1.488) 0.926 (0.663-1.293) 0.394
Potassium (< 1,564.19 mg) (1,564.19-2,245.07 mg) (2,245.08-3,148.39 mg) (3,148.40 mg≤)
1 (reference) 1.052 (0.767-1.443) 1.013 (0.757-1.356) 0.952 (0.688-1.318) 0.940
2 (reference) 1.064 (0.775-1.460) 0.997 (0.744-1.336) 0.999 (0.724-1.378) 0.976
Vitamin A (< 192.33 μg) (192.33-398.26 μg) (398.27-769.58 μg) (769.59 μg≤)
1 (reference) 1.017 (0.742-1.395) 1.161 (0.830-1.626) 0.984 (0.715-1.356) 0.673
2 (reference) 1.007 (0.731-1.387) 1.140 (0.813-1.600) 1.014 (0.732-1.404) 0.801
Thiamin (< 0.61 mg) (0.61-0.85 mg) (0.86-1.21 mg) (1.22 mg≤)
1 (reference) 0.807 (0.606-1.076) 0.969 (0.717-1.310) 0.731 (0.528-1.012) 0.142
2 (reference) 0.791 (0.595-1.051) 0.951 (0.704-1.285) 0.746 (0.537-1.034) 0.171
Riboflavin (< 0.46 mg) (0.46-0.71 mg) (0.72-1.07 mg) (1.08 mg≤)
1 (reference) 1.163 (0.859-1.575) 1.251 (0.956-1.638) 0.844 (0.609-1.168) 0.021
2 (reference) 1.117 (0.826-1.511) 1.246 (0.951-1.631) 0.866 (0.623-1.206) 0.050
Niacin (< 7.80 mg) (7.78-10.93 mg) (10.94-15.37 mg) (15.38 mg≤)
1 (reference) 0.995 (0.743-1.332) 0.973 (0.712-1.329) 0.921 (0.663-1.278) 0.962
2 (reference) 0.998 (0.743-1.341) 0.964 (0.705-1.319) 0.926 (0.667-1.286) 0.968
Vitamin C (< 32.91 mg) (32.91-63.12 mg) (63.13-107.68 mg) (107.69 mg≤)
1 (reference) 1.097 (0.805-1.493) 1.024 (0.748-1.403) 0.731 (0.539-0.991) 0.024
2 (reference) 1.108 (0.816-1.505) 1.000 (0.733-1.365) 0.742 (0.548-1.006) 0.038
1)Model 1 was adjusted for age.
2)Model 2 was adjusted for age, smoking, and alcohol drinking.
3)P-trend values from multiple regression models.
OR, odds ratio; CI, confidence interval.
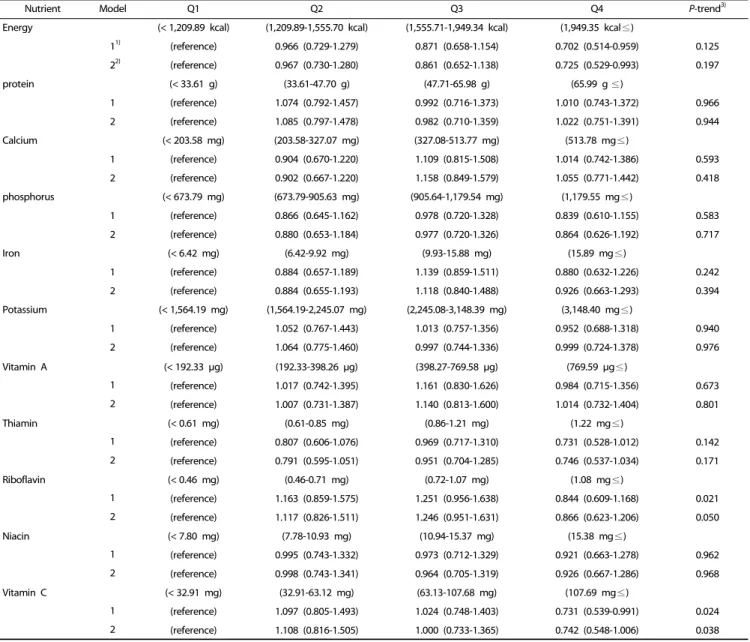
Table 8. Odds ratio of sarcopenic obesity according to nutrient intake
in the highest physical activity level (Q4) than that in the lowest group (Q1) in both models (P for trend = 0.014 and 0.018, respectively). In women, the risk of sarcopenic obesity was significantly lower in the Q4 group than in the Q1 group for both models 1 (OR = 0.432, 95% CI = 0.281-0.665, P for trend
< 0.001) and 2 (OR = 0.433, 95% CI = 0.281-0.668, P for trend
< 0.001).
Assessment of the nutrient intake status and sarcopenic obesity risk of the subjects according to the nutrient intake level
Table 6 and 7 summarize mean daily energy intake and nutrient intake adjusted for energy intake of the subjects. For men, the energy and vitamin A intakes were significantly
different among the groups (P = 0.006). The energy intake of the non-obese and obese groups was significantly high in the non-sarcopenia group than the sarcopenia group. The energy intake of women was significantly higher in the non-sarcopenia obese group than the sarcopenia obese group. A significant difference in the carbohydrate, protein, fat, phosphorus, niacin, and vitamin C intakes of the women was observed among the groups.
Table 8 lists the odds ratio results of sarcopenic obesity
according to the nutrient intake quartile. The energy intake
results from model 2 (adjusted for gender, age, smoking, alcohol
drinking, physical activity, and energy intake) showed that the
risk of sarcopenic obesity was 27.5% lower in Q4 than in Q1
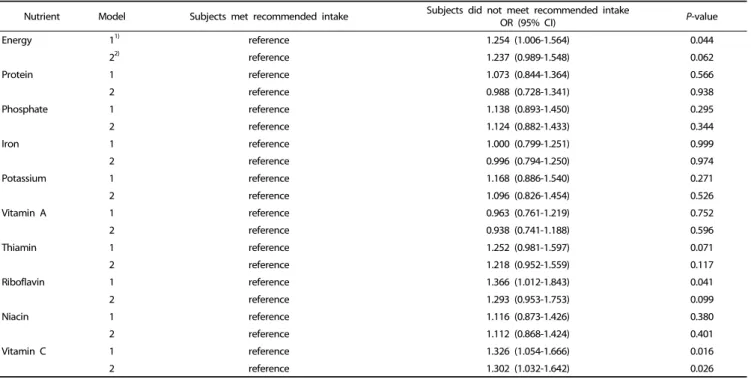
Nutrient Model Subjects met recommended intake Subjects did not meet recommended intake
OR (95% CI) P-value
Energy 11) reference 1.254 (1.006-1.564) 0.044
22) reference 1.237 (0.989-1.548) 0.062
Protein 1 reference 1.073 (0.844-1.364) 0.566
2 reference 0.988 (0.728-1.341) 0.938
Phosphate 1 reference 1.138 (0.893-1.450) 0.295
2 reference 1.124 (0.882-1.433) 0.344
Iron 1 reference 1.000 (0.799-1.251) 0.999
2 reference 0.996 (0.794-1.250) 0.974
Potassium 1 reference 1.168 (0.886-1.540) 0.271
2 reference 1.096 (0.826-1.454) 0.526
Vitamin A 1 reference 0.963 (0.761-1.219) 0.752
2 reference 0.938 (0.741-1.188) 0.596
Thiamin 1 reference 1.252 (0.981-1.597) 0.071
2 reference 1.218 (0.952-1.559) 0.117
Riboflavin 1 reference 1.366 (1.012-1.843) 0.041
2 reference 1.293 (0.953-1.753) 0.099
Niacin 1 reference 1.116 (0.873-1.426) 0.380
2 reference 1.112 (0.868-1.424) 0.401
Vitamin C 1 reference 1.326 (1.054-1.666) 0.016
2 reference 1.302 (1.032-1.642) 0.026
1)Model 1 was adjusted for gender and age.
2)Model 2 was adjusted for gender, age, smoking, alcohol drinking, physical activity, and total energy intake.
OR, odds ratio; CI, confidence interval.
Table 9. Odds ratio of sarcopenic obesity according to recommended nutrient intake
(OR = 0.725, 95% CI = 0.529-0.993), but the risk reduction with increasing energy intake was not statistically significant (P for trend = 0.197). Regarding riboflavin, the risk of sarcopenic obesity was significantly lower in model 1 adjusted for gender and age (P trend = 0.021), whereas model 2 only showed a trend to a lower risk (P for trend = 0.050). In addition, the risk of sarcopenic obesity was 26.9% lower in the highest vitamin C quartile (Q4) than in Q1 in model 1 (OR = 0.731, 95% CI = 0.539-0.991, P for trend = 0.024), whereas in model 2, there was only a trend toward a decreased risk of sarcopenic obesity (P for trend = 0.038).
Table 9 lists odds ratio of the sarcopenic obesity risk according to the recommended nutrient intake level. For model 1, the risk of sarcopenic obesity was 25.4% higher in the subjects not meeting the recommended total energy intake than in those meeting the recommended intake level (OR 1.254, 95% CI = 1.006-1.564; P = 0.044). The model 1 result for riboflavin showed that the risk of sarcopenic obesity increased by 36.6%
in the subjects not meeting the recommended riboflavin intake than the subjects meeting that level (95% CI = 1.012-1.843; P
= 0.041). For the models 1 and 2 results, there were significantly higher risks of sarcopenic obesity (32.6% increase; 95% CI = 1.054-1.666; P = 0.016 and 30.2% increase; 95% CI = 1.032-1.642;
P = 0.026, respectively) in the subjects not meeting the recommended vitamin C intake than in those meeting the level.
DISCUSSION
In this study, data from the nationally representative KNHANES (2008-2011) were used to determine if physical activity and
dietary intake can be associated with sarcopenic obesity among the elderly in South Korea. The results showed that a reduction of the sarcopenic obesity risk was associated with active participation in a physical activity and adequate intake of nutrients.
A subject’s participation in physical activities, such as vigorous physical activity, moderate physical activity, and walking, was calculated as the MET-min/week. After adjusting for confoun- ding factors, male subjects in the highest quartile of MET-min/
week showed a 45.0% risk reduction in sarcopenic obesity compared to the subjects in Q1 (P trend = 0.018). A similar risk reduction (56.7%) was detected in the Q4 and Q1 women (P trend < 0.01). These results suggest that sarcopenic obesity can be prevented by participating in physical activity. Similar results showing that the risks of sarcopenia and sarcopenic obesity can be decreased by increasing the intensity of physical activity have been reported [16,23,24].
The increase in basal metabolic rate and total energy expenditure are related to a decrease in muscle mass, and an energy imbalance can lead to visceral obesity [25]. Zamboni et al. [10] reported that decreased physical activity reduces the physical stimulation of muscle cells, which might decrease the number and size of muscle fibers by inducing muscle cell death.
Sarcopenia is a pathogenic condition that progresses with aging, and can reduce participation in physical activities and result in a progressive deterioration of body muscle mass. Low muscle mass and low physical activity can interact with each other, and become a significant cause of sarcopenic obesity by decreasing the total energy consumption [26].
Moderate aerobic exercise has a positive correlation with
muscle mass and muscle strength of the lower limbs in the elderly [27]. An earlier study found that the muscle thickness and strength of the lower limbs were increased after six months of walking training in elderly subjects [28]. Hwang et al. [29]
suggested that in 2,221 subjects participating in resistance exercise more than three times a week, flexibility exercise, and more than one hour of walking, reduced sarcopenic obesity by 53%, 30%, and 49%, respectively, even though the decreases were not significant.
The risk of sarcopenic obesity in the group not meeting the recommended energy intake was higher than that in those consuming the recommended level. Jang and Bu [30] also reported that the total energy intake was positively associated with the sarcopenia index and relative skeletal mass in Korean adults aged 30 years and older. Based on these results, the total energy intake meeting the recommended level has a positive effect on the prevention of sarcopenic obesity in the elderly.
In this study, there was no significant correlation between the protein intake and the risk of sarcopenia. This differs from the results of some studies in western countries, in which the protein intake was shown to effectively reduce the risk of sarcopenia [18,31]. This difference might be due to the different sources of protein consumed in Korea and western countries.
The traditional diet in Korea is comprised of a high portion of carbohydrates and low portions of fat and animal protein [32].
The major protein source of Korean elderly tends to be more plant-based than meat- or other animal-based [9,33]. Animal protein contains nearly all the essential amino acids and has excellent biological value compared to plant protein [34].
Houston et al. [18] reported that animal protein with its excellent biological value has a positive effect on muscle mass.
Another study analyzed the correlation between the limb muscle mass and the consumption of total protein, animal protein, and plant protein among 2,675 subjects. Compared to subjects in the lowest quartile of total protein and animal protein intake, subjects in the highest quartile had significantly higher limb muscle mass [35]. On the other hand, this tendency was not observed among all quartiles of subjects consuming plant protein. The amount and types of the protein sources were not analyzed in the present study. Further study will be needed to examine the correlation between protein intake and muscle health. In addition, along with the aging effects on muscles, there is anabolic resistance in muscle synthesis from protein intake by foods [36]. Among the older subjects, the muscle mass was still low despite the relatively high protein intake. This result was in agreement with those reported by Burd et al. [36].
In this study, there was a 1.366 times higher risk of sarcopenic obesity in the group not meeting the recommended riboflavin intake than in the group meeting the recommendation. Ashoori
& Saedisomeolia [37] indicated that riboflavin, an antioxidant, can ameliorate inflammation in the body. In addition, the vitamin C intake was negatively correlated with sarcopenic obesity in this study. Many studies have reported that the accumulation of reactive oxygen species can cause oxidative stress, which can result in a loss of muscle mass and muscle strength in the elderly [38]. Furthermore, oxidative stress is associated with muscle function, which may be relaed to walking disorders in
the elderly [39]. A cross-sectional study by Kim et al. [3] included 1,912 Korean elderly subjects in an analysis of whether the intake of vegetables and fruits can be a sarcopenia prevention factor. They reported that the dietary intake of vegetables or fruits and both vegetables and fruits reduced the risk of sarcopenia significantly in men while the dietary intake of fruits decreased the risk of sarcopenia in women significantly. As fruits and vegetables contain abundant vitamin C and other antioxidants, their intake could effectively lower the level of oxidative stress in skeletal muscle, thereby reduce the risk of sarcopenia. The recommended vitamin C intake for the elderly in Korea was 100 mg/day [40], and these results showed that meeting the recommended vitamin C intake could reduce the risk of sarcopenic obesity. In this study, the lower intake of vitamin A in sarcopenic obese men compared to non- sarcopenic obese men reinforces these reports. In addition, the study using Women’s Health and Aging Study reported that the blood carotenoids concentration was associated with the indicator of muscle mass loss in female elderly [38].
The increased prevalence of sarcopenia was associated with elevated serum ferritin levels in Korean elderly women. Women with sarcopenia showed higher levels of serum ferritin than those without sarcopenia [41]. On the other hand, the iron intake was not associated with the risk of sarcopenic obesity in this study.
According to the case-control study of the elderly people with sarcopenia or non-sarcopenia, the non-sarcopenia group consumed more phosphorus than the sarcopenia group [42]
In addition, a recent systematic review showed that unlike the data of the present study, a lack of phosphorus can lead to muscle weakness and is positively associated with the prevalence of sarcopenia [43].
Symptoms related to niacin deficiency include neuromuscular deficits, such as muscle weakness and wasting [44]. This report was different from the data of this study, which was not consistent according to gender.
In this study, the nutrient intake of elderly subjects was analyzed using the food consumption data from a 24-hour recall. Bathalon et al. [45] and Sawaya et al. [46] reported that the accuracy of food consumption data by the 24-recall method was similar in elderly and adults. Despite these reports, food intake analysis of elderly subjects from the 24-hour recall method would be a limitation of this study.
In a recent study, Denison et al. [47] indicated that to prevent
and manage sarcopenia, a combined strategy that included
exercise and diet factors should be applied rather than a single
strategy of exercise or diet. In another study, after dividing 100
women aged 60-90 into two groups, which included an RT+M
group (progressive resistance training (RT) combined with a
protein-enriched diet (M)) and an RT group (progressive
resistance training only), they observed differences in muscle
mass, muscle strength, and inflammatory markers. After four
months, the gain of muscle mass and muscle strength in the
RT+M group was greater than that in the RT group, and the
inflammatory marker level was significantly lower in RT+M than
in RT [48]. Kim et al. [49] reported positive changes in the body
composition by the combination of exercise and nutritional
therapy among women with sarcopenic obesity.
All of the results in this study were obtained from the data obtained in a cross-sectional study. The limitations of such a study are that the approach makes it difficult to clarify the causes and effects in the relationship between sarcopenic obesity and related factors. On the other hand, this analysis used data from a representative elderly population in Korea and can be used as a descriptive reference on the sarcopenic elderly in Korea. This study was limited to data from KNHANES 2008-2011 because muscle mass data were not included in the surveys conducted before 2008 or after 2011.
In conclusion, sarcopenia and sarcopenic obesity increase gradually with aging and are particularly important due to the recent acceleration of aging in the Korean population. Therefore, active participation in physical activity after individualized consideration of the physical activity level and exercise capacity of elderly subjects, as well as ensuring an adequate intake of energy and vitamins, such as vitamin C in the elderly, would help prevent sarcopenia and sarcopenic obesity.
CONFLICT OF INTEREST
The authors declare no potential conflicts of interests.
ORCID
Jina Son: https://orcid.org/0000-0003-0434-9763 Qiming Yu: https://orcid.org/0000-0001-8992-2578 Jung-Sook Seo: https://orcid.org/0000-0001-8963-1375 REFERENCES
1. Smalley KJ, Knerr AN, Kendrick ZV, Colliver JA, Owen OE.
Reassessment of body mass indices. Am J Clin Nutr 1990;52:405-8.
2. Gallagher D, Visser M, Sepúlveda D, Pierson RN, Harris T, Heymsfield SB. How useful is body mass index for comparison of body fatness across age, sex, and ethnic groups? Am J Epidemiol 1996;143:
228-39.
3. Kim J, Lee Y, Kye S, Chung YS, Kim KM. Association of vegetables and fruits consumption with sarcopenia in older adults: the Fourth Korea National Health and Nutrition Examination Survey. Age Ageing 2015;44:96-102
4. Rosenberg IH. Sarcopenia: origins and clinical relevance. J Nutr 1997;127:990S-991S.
5. Grimby G, Saltin B. The ageing muscle. Clin Physiol 1983;3:209-18.
6. Lean ME, Katsarou C, McLoone P, Morrison DS. Changes in BMI and waist circumference in Scottish adults: use of repeated cross- sectional surveys to explore multiple age groups and birth-cohorts.
Int J Obes 2013;37:800-8.
7. Flegal KM, Carroll MD, Kit BK, Ogden CL. Prevalence of obesity and trends in the distribution of body mass index among US adults, 1999-2010. JAMA 2012;307:491-7.
8. Ogden CL, Carroll MD, Kit BK, Flegal KM. Prevalence of childhood and adult obesity in the United States, 2011-2012. JAMA 2014;
311:806-14.
9. Ministry of Health and Welfare, Korea Centers for Disease Control and Prevention. Korea Health Statistics 2010: Korea National Health and Nutrition Examination Survey (KNHANES V-1). Cheongwon:
Korea Centers for Disease Control and Prevention; 2011.
10. Zamboni M, Mazzali G, Fantin F, Rossi A, Di Francesco V. Sarcopenic obesity: a new category of obesity in the elderly. Nutr Metab Cardiovasc Dis 2008;18:388-95.
11. Kim TN, Choi KM. The implications of sarcopenia and sarcopenic obesity on cardiometabolic disease. J Cell Biochem 2015;116:1171-8.
12. Gadelha AB, Paiva FM, Gauche R, de Oliveira RJ, Lima RM. Effects of resistance training on sarcopenic obesity index in older women:
a randomized controlled trial. Arch Gerontol Geriatr 2016;65:168-73.
13. Batsis JA, Mackenzie TA, Jones JD, Lopez-Jimenez F, Bartels SJ.
Sarcopenia, sarcopenic obesity and inflammation: results from the 1999-2004 National Health and Nutrition Examination Survey. Clin Nutr 2016;35:1472-83.
14. Szulc P, Munoz F, Marchand F, Chapurlat R, Delmas PD. Rapid loss of appendicular skeletal muscle mass is associated with higher all-cause mortality in older men: the prospective MINOS study. Am J Clin Nutr 2010;91:1227-36.
15. An KO, Kim J. Association of sarcopenia and obesity with multimorbidity in Korean adults: a nationwide cross-sectional study.
J Am Med Dir Assoc 2016;17:960. E1-7.
16. Aggio DA, Sartini C, Papacosta O, Lennon LT, Ash S, Whincup PH, Wannamethee SG, Jefferis BJ. Cross-sectional associations of objectively measured physical activity and sedentary time with sarcopenia and sarcopenic obesity in older men. Prev Med 2016;91:
264-72.
17. Cruz-Jentoft AJ, Landi F, Schneider SM, Zúñiga C, Arai H, Boirie Y, Chen LK, Fielding RA, Martin FC, Michel JP, Sieber C, Stout JR, Studenski SA, Vellas B, Woo J, Zamboni M, Cederholm T. Prevalence of and interventions for sarcopenia in ageing adults: a systematic review. Report of the International Sarcopenia Initiative (EWGSOP and IWGS). Age Ageing 2014;43:748-59.
18. Houston DK, Nicklas BJ, Ding J, Harris TB, Tylavsky FA, Newman AB, Lee JS, Sahyoun NR, Visser M, Kritchevsky SB; Health ABC Study.
Dietary protein intake is associated with lean mass change in older, community-dwelling adults: the Health, Aging, and Body Composition (Health ABC) Study. Am J Clin Nutr 2008;87:150-5.
19. Marzani B, Balage M, Vénien A, Astruc T, Papet I, Dardevet D, Mosoni L. Antioxidant supplementation restores defective leucine stimulation of protein synthesis in skeletal muscle from old rats. J Nutr 2008;138:2205-11.
20. Lim S, Kim JH, Yoon JW, Kang SM, Choi SH, Park YJ, Kim KW, Lim JY, Park KS, Jang HC. Sarcopenic obesity: prevalence and association with metabolic syndrome in the Korean Longitudinal Study on Health and Aging (KLoSHA). Diabetes Care 2010;33:1652-4.
21. Korean Society for the Study of Obesity. Clinical Practice Guidelines for Obesity. Seoul: Korean Society for the Study of Obesity; 2012.
22. Craig CL, Marshall AL, Sjöström M, Bauman AE, Booth ML, Ainsworth BE, Pratt M, Ekelund U, Yngve A, Sallis JF, Oja P. International physical activity questionnaire: 12-country reliability and validity.
Med Sci Sports Exerc 2003;35:1381-95.
23. Szulc P, Duboeuf F, Marchand F, Delmas PD. Hormonal and lifestyle determinants of appendicular skeletal muscle mass in men: the MINOS study. Am J Clin Nutr 2004;80:496-503.
24. Shephard RJ, Park H, Park S, Aoyagi Y. Objectively measured physical activity and progressive loss of lean tissue in older Japanese adults: longitudinal data from the Nakanojo study. J Am Geriatr Soc 2013;61:1887-93.
25. Hong S, Choi WH. Clinical and physiopathological mechanism of sarcopenia. Korean J Med 2012;83:444-54.
26. Roubenoff R, Parise H, Payette HA, Abad LW, D,Agostino R, Jacques PF, Wilson PW, Dinarello CA, Harris TB. Cytokines, insulin-like growth factor 1, sarcopenia, and mortality in very old community-dwelling men and women: the Framingham Heart Study. Am J Med 2003;
115:429-35.
27. Ozaki H, Loenneke JP, Thiebaud RS, Stager JM, Abe T. Possibility of leg muscle hypertrophy by ambulation in older adults: a brief review. Clin Interv Aging 2013;8:369-75.
28. Kubo K, Ishida Y, Suzuki S, Komuro T, Shirasawa H, Ishiguro N, Shukutani Y, Tsunoda N, Kanehisa H, Fukunaga T. Effects of 6 months of walking training on lower limb muscle and tendon in elderly. Scand J Med Sci Sports 2008;18:31-9.
29. Hwang B, Lim JY, Lee J, Choi NK, Ahn YO, Park BJ. Prevalence rate and associated factors of sarcopenic obesity in Korean elderly population. J Korean Med Sci 2012;27:748-55.
30. Jang BY, Bu SY. Total energy intake according to the level of skeletal muscle mass in Korean adults aged 30 years and older: an analysis of the Korean National Health and Nutrition Examination Surveys (KNHANES) 2008-2011. Nutr Res Pract 2018;12:222-32.
31. Scott D, Blizzard L, Fell J, Giles G, Jones G. Associations between dietary nutrient intake and muscle mass and strength in community-dwelling older adults: the Tasmanian Older Adult Cohort Study. J Am Geriatr Soc 2010;58:2129-34.
32. Park SH, Lee KS, Park HY. Dietary carbohydrate intake is associated with cardiovascular disease risk in Korean: analysis of the third Korea National Health and Nutrition Examination Survey (KNHANES III). Int J Cardiol 2010;139:234-40.
33. Choi HJ, Kang DH, Kim GE, Cheong HS, Kim SH. A study on nutritional status of the long-lived elderly people in Kyungnam. J Korean Soc Food Sci Nutr 2002;31:877-84.
34. Kim JS, Wilson JM, Lee SR. Dietary implications on mechanisms of sarcopenia: roles of protein, amino acids and antioxidants. J Nutr Biochem 2010;21:1-13.
35. Sahni S, Mangano KM, Hannan MT, Kiel DP, McLean RR. Higher Protein intake is associated with higher lean mass and quadriceps muscle strength in adult men and women. J Nutr 2015;145:1569-75.
36. Burd NA, Gorissen SH, van Loon LJ. Anabolic resistance of muscle protein synthesis with aging. Exerc Sport Sci Rev 2013;41:169-73.
37. Ashoori M, Saedisomeolia A. Riboflavin (vitamin B2) and oxidative stress: a review. Br J Nutr 2014;111:1985-91.
38. Semba RD, Blaum C, Guralnik JM, Moncrief DT, Ricks MO, Fried LP.
Carotenoid and vitamin E status are associated with indicators of sarcopenia among older women living in the community. Aging Clin Exp Res 2003;15:482-7.
39. Semba RD, Lauretani F, Ferrucci L. Carotenoids as protection against sarcopenia in older adults. Arch Biochem Biophys 2007;458:141-5.
40. Ministry of Health and Welfare; The Korean Nutrition Society.
Dietary Reference Intakes for Korean. Seoul: The Korean Nutrition Society; 2010.
41. Kim TH, Hwang HJ, Kim SH. Relationship between serum ferritin levels and sarcopenia in Korean females aged 60 years and older using the fourth Korea National Health and Nutrition Examination Survey (KNHANES IV-2, 3), 2008-2009. PLoS One 2014;9:e90105.
42. Verlaan S, Aspray TJ, Bauer JM, Cederholm T, Hemsworth J, Hill TR, McPhee JS, Piasecki M, Seal C, Sieber CC, Ter Borg S, Wijers SL, Brandt K. Nutritional status, body composition, and quality of life in community-dwelling sarcopenic and non-sarcopenic older adults: a case-control study. Clin Nutr 2017;36:267-74.
43. van Dronkelaar C, van Velzen A, Abdelrazek M, van der Steen A, Weijs PJ, Tieland M. Minerals and sarcopenia; the role of calcium, iron, magnesium, phosphorus, potassium, selenium, sodium, and zinc on muscle mass, muscle strength, and physical performance in older adults: a systematic review. J Am Med Dir Assoc 2018;19:6-11.e3.
44. Aytekin N, Mileva KN, Cunliffe AD. Selected B vitamins and their possible link to the aetiology of age-related sarcopenia: relevance of UK dietary recommendations. Nutr Res Rev 2018;31:204-24.
45. Bathalon GP, Tucker KL, Hays NP, Vinken AG, Greenberg AS, McCrory MA, Roberts SB. Psychological measures of eating behavior and the accuracy of 3 common dietary assessment methods in healthy postmenopausal women. Am J Clin Nutr 2000;71:739-45.
46. Sawaya AL, Tucker K, Tsay R, Willett W, Saltzman E, Dallal GE, Roberts SB. Evaluation of four methods for determining energy intake in young and older women: comparison with doubly labeled water measurements of total energy expenditure. Am J Clin Nutr 1996;63:491-9.
47. Denison HJ, Cooper C, Sayer AA, Robinson SM. Prevention and optimal management of sarcopenia: a review of combined exercise and nutrition interventions to improve muscle outcomes in older people. Clin Interv Aging 2015;10:859-69.
48. Daly RM, O'Connell SL, Mundell NL, Grimes CA, Dunstan DW, Nowson CA. Protein-enriched diet, with the use of lean red meat, combined with progressive resistance training enhances lean tissue mass and muscle strength and reduces circulating IL-6 concentrations in elderly women: a cluster randomized controlled trial. Am J Clin Nutr 2014;99:899-910.
49. Kim H, Kim M, Kojima N, Fujino K, Hosoi E, Kobayashi H, Somekawa S, Niki Y, Yamashiro Y, Yoshida H. Exercise and nutritional supplementation on community-dwelling elderly Japanese women with sarcopenic obesity: a randomized controlled trial. J Am Med Dir Assoc 2016;17:1011-9.