Evaluation of the relationship between upper incisor exposure and cephalometric variables in Korean young adults
Objective: The purpose of this study was to classify Korean young adults into 3 groups on the basis of upper incisor exposure rates (UIERs) and to compare the skeletal, dental, and soft tissue variables. Methods: Samples were obtained from 127 students at the College of Dentistry, Wonkwang University in South Korea. Facial photographs of frontal posed smiles and lateral cephalograms of the subjects were taken. The subjects were divided into 3 groups on the basis of UIERs and 20 measurements were compared among the 3 groups. The correlations between the variables were determined. Results: Male and female subjects showed significant differences in the group distribution. Male subjects showed higher frequencies of low smiles, and female subjects showed higher frequencies of high smiles. The vertical height of the anterior alveolar process of the maxilla directly correlated with the UIER. However, the UIER showed no significant correlation with the vertical height of the anterior basal bone or the inclination of the upper incisor axis. In female subjects, the upper central incisor clinical crown length showed an inverse correlation with the UIER. However, this variable showed no significant correlation with the UIER in male subjects.
Conclusions: The UIER was directly correlated with the levator muscle activity of the upper lip and inversely correlated with the upper lip thickness, yet there was no correlation between the UIER and upper lip length at rest.
[Korean J Orthod 2013;43(5):225-234]
Key words: Cephalometrics, Photography Sung-Hoon Han
aEon-Hwa Lee
bJin-Hyoung Cho
bJong-Moon Chae
cSang-Cheol Kim
cNa-Young Chang
aKyung-Hwa Kang
aa
Department of Orthodontics, College of Dentistry, Wonkwang University, Iksan, Korea
b
Department of Orthodontics, Wonkwang University Sanbon Dental Hospital, College of Dentistry, Wonkwang University, Gunpo, Korea
c
Department of Orthodontics, Wonkwang University Daejeon Dental Hospital, College of Dentistry, Wonkwang University, Daejeon, Korea
Received August 13, 2012; Revised March 19, 2013; Accepted March 19, 2013.
Corresponding author: Kyung-Hwa Kang.
Associate Professor and Chair, Department of Orthodontics, School of Dentistry, Wonkwang University, 460 Iksan-daero, Iksan 570-749, Korea
Tel +82-63-859-2961 e-mail [email protected]
*This study was supported by Wonkwang University in 2012.
© 2013 The Korean Association of Orthodontists.
The authors report no commercial, proprietary, or financial interest in the products or companies described in this article.
This is an Open Access article distributed under the terms of the Creative Commons Attribution Non-Commercial License (http://creativecommons.org/licenses/by-nc/3.0) which permits unrestricted non-commercial use, distribution, and reproduction in any medium, provided the original work is properly cited.
pISSN 2234-7518 • eISSN 2005-372X
http://dx.doi.org/10.4041/kjod.2013.43.5.225
INTRODUCTION
A smile is a facial expression formed by flexing the mus cles near both ends of the mouth and is used to express enjoyment, appreciation, and concurrence.
1A smile can provide a basis for social interactions and can also influence a person’s mating success, kinship opportunities, personality evaluations, performance, and employment prospects.
2,3Because of the influence of the smile on the perceived attractiveness of an individual, a large number of patients seek the help of orthodontists to address esthetic concerns with their smiles.
There are 2 forms of smiles: the unposed smile and posed smile.
4,5An unposed smile is an involuntary response induced by joy or mirth. This type of smile is dynamic in the sense that it bursts forth and is not sustained.
6Moreover, an unposed smile is natural from the viewpoint of expressing an authentic human emo- tion.
1,4-9A posed smile, in contrast, is a voluntary expression that does not need to be elicited by or accompanied with an emotion. A facial photograph is an effective tool to analyze facial attractiveness.
8,10When a person is asked to pose for a photograph, the desired smile is voluntary, unstrained and static, yet natural.
4,7Thus, the posed smile is routinely used to assess facial and smile esthetic characteristics because of its reproducibility.
6Hulsey,
7Ackerman et al.
6,8and Rigsbee et al.
4agree that the posed smile has good reproducibility.
Most studies that used photographs of posed smiles employed objective or subjective evaluation sys tems.
These systems mainly evaluated the following smile characteristics: smile arc,
3,6-8,10,11buccal corridor,
5-8,11interlabial gap,
12-14intercommissure width,
6-8smile index (width/height),
6,8,13smile symmetry,
7,11upper incisor ex- posure, and upper lip position.
4,12,14Some of these stu- dies classified smiles based on upper incisor exposure and upper lip position during smiling into the following three categories: “low smile” (in which less than 75% of the clinical crown height of the maxillary anterior teeth is revealed), “average smile” (in which 75 - 100% of the maxillary anterior crown height and the interproximal gingival are revealed), and “high smile” (in which a band of contiguous maxillary gingival is exposed).
1,4,11Tjan et al.
1and Dong et al.
11reported that the average smile is the most common among adults while Tjan et al.
1and Rigsbee et al.
4studied the gender-related differences in upper incisor exposure at smiling and reported that female subjects showed high smiles more frequently than male subjects. Furthermore, Vig and Brundo
15reported that the upper incisor exposure tends to decrease with age, however, this study was con ducted without the patients smiling. There were few studies found which examine the skeletal, dental, and soft-tissue variables
that metrically describe the vertical relativity between the lips, upper jaw, and teeth while smiling. Peck et al.
12noted that the high smile is related to vertical maxillary excess, the muscular ability to raise the upper lip, greater overjet, greater overbite, and grea ter interlabial gap at rest. However, there was little research found regarding the degree of and the variables associated with maxillary incisor exposure while smiling, especially in Korean subjects.
Thus, the objectives of this study were to evaluate the relationship between various measurements and upper incisor exposure while smiling through examination of frontal facial photographs and lateral cephalograms of posed smiles. More specifically, the goals of this study were as follows: (1) to compare the gender-rela- ted frequency distributions of the three smile types - high smile, average smile, and low smile - which were classified on the basis of the upper incisor exposure rates (UIERs) in Korean young adults; (2) to evaluate the differences in the skeletal, dental, and soft tissue measurements among the three groups; and (3) to investigate the correlation between various factors and the UIERs while smiling.
MATERIALS AND METHODS
Sample selection
Samples were obtained from 127 students (64 male and 63 female students) at the College of Dentistry, Wonkwang University, in South Korea. The average age of the subjects in this study was 25.23 ± 2.01 years (males, 25.02 ± 2.87 years; females, 24.96 ± 2.25 years).
The institutional review board at the Dental Hospital of Wonkwang University approved this study (WKDIRB 201103-01).
Data collection
To achieve a natural posed smile, a smiling practice
session was held, and one examiner used a digital caliper
to obtain the actual measurements. At rest position, the
subjects were instructed to hold their upper and lower
teeth slightly apart while their lips were touching lightly
To reduce examiner errors, the measurements were
obtained three times and the average of the three values
was recorded. In addition, frontal posed smile pho tographs
and lateral cephalograms of the subjects were taken
for the measurement procedures. The frontal posed
smile photographs were taken using a 35-mm camera
(D80; Nikon, Tokyo, Japan) with a 90-mm lens and a
tripod. The subjects sat on chairs, ensuring that their
Frankfurt horizontal planes were parallel to the floor,
which allowed us to obtain standardized frontal posed
smile photographs of each subject. The camera lens was
centered on the midsagittal plane of the subject, and
the distance between the labial surface of the upper incisors and the film was set at 160 cm. To reduce er- rors, the photographs were taken when the same lip appearance was repeated at least three times. Next, la- teral cephalograms were obtained while the subjects held their teeth in centric occlusion using a ProMax with Dimax3 machine (Planmeca, Helsinki, Finland).
Measurements
The clinically measured values in this study were the central incisor exposure length (while smiling), the cen- tral incisor clinical crown length, the upper lip length at rest, and the upper lip length during smiling (Table 1).
Measurements from the facial photographs were re- corded in the form of the modified smile index (MSI)
Table 1. Cephalometric landmarks and measurements Landmarks
Sella (S): The center of sella turcica
Nasion (N): The most anterior point of the frontonasal suture
Anterior nasal spine (ANS): The tip of the anterior nasal spine of the palatal bone in the hard palate Posterior nasal spine (PNS): The tip of the posterior nasal spine of the palatal bone in the hard palate A point (A): The most posterior point on the anterior contour of the upper alveolar process
Soft tissue A point (A'): The point of greatest concavity in the midline of the upper lip Incision superius (Is): The tip of the crown of the upper incisor
Upper molar edge (U6): The distal cusp tip of the upper first molar N': The point of greatest concavity in the midline of the radix Zy': The lateral most point on the zygomatic arch of the face Sto': The lower most point on the vermilion of the upper lip Gn': The lower point on the lower border of the chin Measurements
Vertical-A: The distance between Nasion and the point made by the vertical line from A point to N perpendicular line A point-N perpend: Linear distance from A to N-perpendicular line
PP-Is: Linear distance from Is to palatal plane PP-A: Linear distance from A point to palatal plane PP-U6: Linear distance from U6 to palatal plane SNA: Angle between SN plane and NA plane SN-OP: Angle between SN plane and Occlusal plane SN-PP: Angle between SN plane and Palatal plane
Exposure length of central incisor at smiling: The distance between the lowest point of the incisal line of the right upper incisor and the lowest point of the upper lip line on the right side at smiling
Clinical crown length of central incisor: The distance between the lowest point of the incisal line of the right upper incisor and the highest point of the gingival line on the right side
NA-Is: Linear distance from Is to NA plane
SN-U1: Angle between SN plane and the long axis of maxillary incisor NA-U1: Angle between NA plane and the long axis of maxillary incisor
Upper lip length at rest: The distance between the lowest point of upper lip line and subnasale point on soft tissue at rest Upper lip length at smiling: The distance between the lowest point of upper lip line and subnasale point on soft tissue at
smiling
Upper lip length ratio: Upper lip length at smiling / Upper lip length at rest
Modified smile index (MSI): Interlabial gap at midline / Intercommissural distance X 100 Facial index: N'-Gn' / Zy'-Zy'
Upper facial index: N'-Sto' / Zy'-Zy'
Upper lip thickness: Linear distance from A to A'
(Figure 1). The MSI, as suggested by Krishnan et al.,
13is a percentage of the inverse value of the smile index.
From the facial photograph measurements, we also calculated the facial index, as suggested by Farkas et al.
16and Proffit et al.
9The facial index is a ratio of the facial width to the facial height and these measurements are shown in Figure 2.
The cephalometric linear and angular measurements from this study are shown in Figures 3 and 4 and Table 1.
The landmarks were traced on the lateral cephalograms, and one investigator performed the measurements using the V-Ceph program (version 6.0; Osstem Implant, Seoul, Korea).
Sample classification
The UIER was calculated as the percentage of the ex- posed upper central incisor length and the exposed Figure 1. Modified smile index = (intervermillion distance at midline / intercommissural distance) ×100.
Figure 2. Facial index: N’–Gn’/ Zy’–Zy’; Upper facial index:
N’–Sto’/ Zy’–Zy’.
See Table 1 for the definitions of all the landmarks and measurements.
Figure 3. Cephalometric linear measurements.
1, Vertical-A; 2, PP-Is; 3, PP-A; 4, PP-U6; 5, A-N perpend;
6, NA-Is; 7, upper lip thickness.
See Table 1 for the definitions of all the landmarks and measurements.
Figure 4. Cephalometric angular measurements.
1, SNA; 2, SN-OP; 3, SN-PP; 4, SN-U1; 5, NA-U1. Dashed and dotted lines indicate parallel planes to the palatal and occlusal planes, respectively.
See Table 1 for the definitions of all the landmarks and
measurements.
gingival length upon smiling to the upper right central incisor clinical crown length.
1,4,11The standards for dividing the subjects into the respective three groups using UIER values were as follows:
Group 1: subjects with UIER values less than 75%
Group 2: subjects with UIER values between 75% and 100%
Group 3: subjects with UIER values greater than 100%
Statistical analyses
In order to determine intra-examiner errors, 15 samples were randomly selected and remeasured by the same examiner. The casual error was calculated according to Dahlberg’s formula.
17The casual error ranged from 0.35 to 1.36, and no variable showed statistically significant systemic errors.
To compare group distribution differences by gender, the c
2test was used. Independent t-tests were used to compare the measurements between male and female subjects, and these results were analyzed for significance using analysis of variance (ANOVA) and Duncan mul- tiple range tests to compare the measurements bet- ween groups. Spearman correlation coefficients were calculated to evaluate the associations between the vari- ables and UIER values. Results were considered statically significant at p < 0.05. These results were analyzed for significance using the PASW Statistics computer program (version 18.0; IBM Co., Armonk, NY, USA).
RESULTS
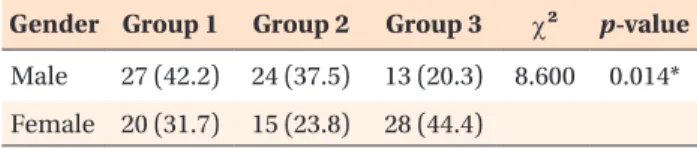
Frequency distribution of the three groups by gender There were significant differences in the group distri- butions between male and female subjects (p < 0.05).
Most of the male subjects were classified into group 1 (42.2%), with only 13% falling into group 3. In contrast, most of the female subjects met the criteria for group 3 (44.4%) while only 15% were classified into group 2 (Table 2).
Comparison of measurements between male and female subjects
Skeletal variables
The males had greater vertical-A and PP-U6 values
than the females, with statistically significant dif- ferences (p < 0.05). The female group had statistically significantly larger SN-OP values than the male group (p < 0.05), with the SN-PP values also demonstrating a similar pattern with a statistically significant difference (p
< 0.05) (Table 3).
Dental variables
The males had greater central incisor clinical crown lengths, SN-U1 and NA-U1, than the females, and the differences between the two groups were statistically significant (p < 0.05) (Table 3).
Soft tissue variables
The male group had greater upper lip lengths at rest, upper lip lengths at smiling, facial indices, and upper lip thicknesses than the female group, and these differences were statistically significant (p < 0.05) (Table 3).
Comparison of the measurements among the three groups
Skeletal variables
In both the male and female subjects, the PP-Is values showed statistically significant differences among the three groups (p < 0.05), with the values for groups 2 and 3 being greater than those of group 1 (Table 4).
Dental variables
In both the male and female subjects, the central incisor exposure heights during smiling were signi fi- cantly different among the three groups (p < 0.05), and increased in the order of group 1, group 2, followed by group 3. In the female subjects, the central incisor clinical crown lengths significantly differed among the three groups (p < 0.05), with the values for groups 1 and 2 being greater than those of group 3 (Table 4).
Soft tissue variables
In both the male and female subjects, the upper lip length ratio showed statistically significant differences among the three groups (p < 0.05), and the values for group 1 were greater than those for groups 2 and 3. The MSI showed statistically significant differences among the three groups (p < 0.05) as well, with the values for groups 2 and 3 being greater than those of group 1.
Furthermore, the upper lip thickness values also showed statistically significant differences among the three groups (p < 0.05), where the values for group 1 were greater than those of groups 2 and 3 (Table 4).
Correlation analysis
In both the male and female subjects, the PP-Is and MSI showed a positive correlation with the UIER (p <
Table 2. Frequency distribution of the three groups by gender
Gender Group 1 Group 2 Group 3 c² p-value Male 27 (42.2) 24 (37.5) 13 (20.3) 8.600 0.014*
Female 20 (31.7) 15 (23.8) 28 (44.4) Values are presented as number (%).
*p < 0.05.
0.05). On the other hand, the upper lip length ratio and upper lip thickness both showed a negative correlation with the UIER (p < 0.05). In female subjects, the central incisor clinical crown lengths showed a statistically signi ficant negative correlation with the UIER (p < 0.05) (Table 5).
DISCUSSION
Facial photographs are effective in providing a valid me thod to analyze facial attractiveness.
8,10However, it is difficult to repeat the same exact posed smile du ring a single photography session, much less over a longer period of time. When several consecutive smile pho- tographs are taken at an orthodontic visit, a clinician will often note variations in the smiles. Therefore, digital videography, which can complement the disadvantages of facial photography, is an option for recording po-
sed smiles for diagnostic purposes and developing treatment plans for orthodontic and orthognathic sur- gical treatment.
18Schabel et al.
10insisted that clinical photography and digital videography do not show any significant differences in the analysis of smiles; however, because obtaining data using clinical photography is more convenient, it is more useful than digital video- graphy for dental examinations. Thus, this study used clinical photography to record facial images of smiling subjects.
According to the study by Dong et al.,
11which exa- mined 240 Korean subjects in their 20s, 56% of subjects had average smiles, while fewer subjects had high smiles (29%) and low smiles (15%). In our study with 127 Korean subjects in their 20s, the subjects were classified into three groups using the same methods as those em- ployed in advanced research (classifying the subjects into three groups by the UIERs upon smiling), and found that Table 3. Comparison of the measurements between male and female subjects
Variable Male Female p-value
Skeletal variable
Vertical-A (mm) 69.58 ± 3.84 66.39 ± 3.52 ≤0.001*
A point-N perpend (mm) 2.79 ± 2.28 2.74 ± 2.07 NS
PP-Is (mm) 33.20 ± 3.57 32.79 ± 3.30 NS
PP-A (mm) 7.37 ± 1.59 6.82 ± 1.71 NS
PP-U6 (mm) 27.89 ± 2.75 25.76 ± 2.48 ≤0.001*
SNA (
o) 80.69 ± 3.94 80.36 ± 2.98 NS
SN-OP (
o) 17.04 ± 3.81 20.78 ± 4.38 ≤0.001*
SN-PP (
o) 9.96 ± 3.30 11.12 ± 3.06 0.042*
Dental variable
Height of central incisor during smiling (mm) 8.53 ± 3.03 9.18 ± 3.52 NS
Clinical crown length of central incisor (mm) 10.35 ± 0.98 9.74 ± 0.94 ≤0.001*
NA-Is (mm) 8.01 ± 2.57 7.35 ± 2.71 NS
SN-U1 (
o) 109.61 ± 7.35 106.21 ± 7.21 0.010*
NA-U1 (
o) 28.92 ± 6.45 25.85 ± 7.15 0.012*
Soft tissue variable
Upper lip length at rest (mm) 26.87 ± 2.79 25.09 ± 1.99 ≤0.001*
Upper lip length at smiling (mm) 22.12 ± 2.88 20.89 ± 3.13 0.023*
Upper lip length ratio 0.82 ± 0.06 0.83 ± 0.09 NS
MSI 19.64 ± 5.43 18.73 ± 4.61 NS
Facial index 0.96 ± 0.06 0.94 ± 0.06 0.026*
Upper facial index 0.60 ± 0.04 0.59 ± 0.04 NS
Upper lip thickness (mm) 16.91 ± 2.20 14.42 ± 1.71 ≤0.001*
Values are presented as mean ± standard deviation.
NS, Not significant.
*Male and female were significantly different at the level of p = 0.05.
See Table 1 for the definitions of all the landmarks and measurements.
low smiles were the most frequent (37%), followed by high smiles (32.3%) and average smiles (30.7%). These results revealed that the distribution of the three groups was similar and that there was a difference between the results of this study and the advanced study, as the percentage of low smiles was highest in our study.
These differences may be attributed to the differences in the type of smiles measured in the two studies. This study used posed smiles to record and measure the smile types, while the previously mentioned studies classified the subjects into the three groups on the basis of the UIERs while the subjects posed with full smiles; in other
words, the unposed smile was the standard.
Peck et al.
12,14analyzed the upper lip-tooth-jaw rela- tivity in the vertical dimension quantitatively and studied the correlations among the exposure rates of the upper incisor and gingiva upon smiling with other variables.
According to their study, which recorded full smiles, a significant gender dimorphism was found in the ver- tical lip-tooth-jaw relationship. When classifying the subjects into high smiles and low smiles, as well as by the exposure rate of the upper incisor and gingiva upon smiling, the high smiles showed higher frequencies in female subjects than in males, and male subjects showed Table 4. Comparison of the measurements among the three groups
Variable Male Female
Group 1 Group 2 Group 3 p-value Group 1 Group 2 Group 3 p-value Skeletal variable
Vertical-A (mm) 69.12 ± 3.53 70.11 ± 4.24 69.55 ± 3.88 NS 65.49 ± 3.72 66.70 ± 3.17 66.88 ± 3.55 NS PP-Is (mm) 31.77* ± 3.96 34.00
†± 3.17 34.67
†± 2.38 0.018
§30.99* ± 3.18 33.18
†± 2.85 34.47
†± 3.08 0.004
§PP-A (mm) 7.05 ± 1.56 7.46 ± 1.62 7.85 ± 1.55 NS 6.63 ± 1.94 7.09 ± 1.45 6.81 ± 1.70 NS PP-U6 (mm) 27.17 ± 2.62 28.23 ± 2.86 28.75 ± 2.69 NS 24.88 ± 2.35 26.39 ± 1.87 26.05 ± 2.74 NS A point-N perpend (mm) 2.45 ± 2.47 2.93 ± 1.99 3.25 ± 2.45 NS 2.86 ± 2.59 2.91 ± 1.95 2.55 ± 1.75 NS SNA (
o) 81.00 ± 3.96 80.58 ± 4.13 80.23 ± 3.81 NS 79.79 ± 3.21 79.59 ± 2.13 81.19 ± 3.09 NS SN-OP (
o) 15.82 ± 3.91 17.76 ± 3.81 18.03 ± 3.10 NS 19.76 ± 3.54 20.64 ± 5.22 22.39 ± 4.34 NS SN-PP (
o) 9.68 ± 3.44 10.41 ± 3.39 9.70 ± 2.97 NS 11.31 ± 3.75 11.38 ± 3.79 10.84 ± 2.00 NS Dental variable
Height of central incisor
during smiling (mm) 5.89* ± 2.03 9.40
†± 0.96 12.39
ౠ2.06 0.000
§5.18* ± 2.21 8.66
†± 0.98 12.32
‡± 1.50 ≤0.001
§Clinical crown length of
central incisor (mm) 10.38 ± 1.06 10.40 ± 0.74 10.21 ± 1.24 NS 10.22
†± 0.99 10.02
†± 0.70 9.42* ± 0.90 0.012
§NA-Is (mm) 7.88 ± 2.88 7.93 ± 2.65 8.43 ± 1.73 NS 7.74 ± 2.57 7.08 ± 2.98 7.22 ± 2.73 NS SN-U1 (
o) 110.58 ± 8.35 108.41 ± 7.25 109.79 ± 5.20 NS 108.56 ± 5.07 102.93 ± 8.58 106.30 ± 7.28 NS NA-U1 (
o) 29.58 ± 7.28 27.83 ± 6.45 29.57 ± 4.52 NS 28.77 ± 6.16 23.34 ± 9.01 25.11 ± 6.18 NS Soft tissue variable
Upper lip length at
rest (mm) 26.22 ± 2.79 27.12 ± 2.83 27.76 ± 2.61 NS 24.87 ± 2.22 25.24 ± 2.16 25.01 ± 1.61 NS Upper lip length at
smiling (mm) 22.51 ± 2.93 21.59 ± 3.06 22.28 ± 2.46 NS 21.95 ± 4.07 21.97 ± 2.54 20.68 ± 2.25 NS Upper lip length ratio 0.86
†± 0.10 0.79* ± 0.05 0.80* ± 0.04 0.000
§0.83
†± 0.13 0.81* ± 0.06 0.80* ± 0.06 0.023
§MSI 16.72* ± 5.72 21.53
†± 4.68 22.20
†± 2.92 0.001
§14.98* ± 2.87 18.17
†± 2.64 21.72
†± 4.41 ≤0.001
§Facial index 0.95 ± 0.06 0.97 ± 0.05 0.97 ± 0.05 NS 0.94 ± 0.06 0.95 ± 0.06 0.93 ± 0.05 NS Upper facial index 0.60 ± 0.04 0.61 ± 0.04 0.59 ± 0.04 NS 0.60 ± 0.04 0.59 ± 0.04 0.58 ± 0.04 NS Upper lip thickness (mm) 17.46
†± 2.22 16.59* ± 1.98 16.43* ± 2.63 0.030
§15.01
†± 1.91 14.11* ± 1.63 13.81* ± 1.43 0.034
§Values are presented as mean ± standard deviation.
NS, Not significant.
§