pISSN 1976-1457 eISSN 2005-6168
Quercetin ameliorates hyperglycemia and dyslipidemia and improves antioxidant status in type 2 diabetic db/db mice
Soo-Mi Jeong, Min-Jung Kang, Ha-Neul Choi, Ji-Hye Kim, and Jung-In Kim
§Department of Smart Foods and Drugs, School of Food and Life Science, Inje University, 607 Obang-dong, Gimhae, Gyungnam 621-749, Korea
Abstract
This study investigated the hypoglycemic, hypolipidemic, and antioxidant effects of dietary quercetin in an animal model of type 2 diabetes mellitus.
Four-week-old C57BL/KsJ-db/db mice (n = 18) were offered an AIN-93G diet or a diet containing quercetin at 0.04% (low quercetin, LQE) or 0.08% of the diet (high quercetin, HQE) for 6 weeks after 1 week of adaptation. Plasma glucose, insulin, adiponectin, and lipid profiles, and lipid peroxidation of the liver were determined. Plasma glucose levels were significantly lower in the LQE group than in the control group, and those in the HQE group were even further reduced compared with the LQE group. The homeostasis model assessment for insulin resistance (HOMA-IR) showed lower values for LQE and HQE than for the control group without significant influence on insulin levels. High quercetin increased plasma adiponectin compared with the control group. Plasma triglycerides in the LQE and HQE groups were lower than those in the control group. Supplementation with high quercetin decreased plasma total cholesterol and increased HDL-cholesterol compared with the control group. Consumption of low and high quercetin reduced thiobarbituric acid reactive substances (TBARS) levels and elevated activities of superoxide dismutase (SOD), catalase (CAT), and glutathione peroxidase (GSH-Px) in the liver. Thus, quercetin could be effective in improving hyperglycemia, dyslipidemia, and antioxidant status in type 2 diabetes.
Key Words: Quercetin, hyperglycemia, dyslipidemia, antioxidant, db/db mouse
Introduction
3)Type 2 diabetes mellitus, which accounts for more than 90%
of diabetes cases, is a major world health problem [1]. Type 2 diabetes is characterized by insulin resistance and relative insufficiency of insulin secretion with hyperglycemia [2].
Diabetes mellitus also leads to blood lipid disorders, including hypertriglyceridemia and low HDL-cholesterol [3] and increased oxidative stress [4,5]. Uncontrolled diabetes can cause diabetic complications, which increase medical costs and decrease quality of life. Cardiovascular diseases (CVDs) are among the most prevalent diabetic complications and leading causes of premature mortality among patients with type 2 diabetes [6]. Control of hyperglycemia and dyslipidemia is essential in reducing the risk for cardiovascular complications [7].
In addition, evidence has accumulated that oxidative stress in diabetes contributes to the development of complications, inclu- ding macro- and microvascular complications, and improvement of antioxidant status can be beneficial to protection against diabetic complications [5,8]. Therefore, agents with hypoglycemic, lipid-lowering, and antioxidant activity could be very promising
in the management of diabetes and prevention of cardiovascular complications.
Quercetin is a bioflavonoid widely distributed in foods and has well-characterized antioxidant properties in vitro and in vivo [9-12]. Studies have demonstrated the hypolipidemic activity of quercetin in mice fed a high-fat diet [13] and in rats with streptozotocin (STZ)-induced diabetes [14,15]. Quercetin inhibited α -glucosidase activity in vitro and in vivo [16-18]. Furthermore, quercetin offered at 0.1% of the diet [19,20] and orally administered at 50 mg/kg body weight [11] reduced fasting hyperglycemia in STZ-treated rats, an animal model of type 1 diabetes. Previously, we demonstrated that chronic consumption of quercetin at 0.08% of the diet was effective in controlling blood glucose levels in db/db mice, an animal model of type 2 diabetes [18]. However, the effects of quercetin on dyslipidemia and oxidative stress in an animal model of type 2 diabetes are not yet fully understood. Also of interest is whether lower doses of quercetin (< 0.08%) could be beneficial in controlling blood glucose and lipid profile and decreasing oxidative stress in these animals. Thus, this study investigated the effects of different doses of quercetin (0.04% and 0.08%) on hyperglycemia,
This research was supported by Basic Science Research Program through the National Research Foundation of Korea (NRF) funded by the Ministry of Education, Science and Technology (2009-0068845).
§Corresponding Author: Jung-In Kim, Tel. 82-55-320-3236, Fax. 82-55-321-0691, Email. [email protected] Received: January 26, 2012, Revised: March 9, 2012, Accepted: March 16, 2012
ⓒ2012 The Korean Nutrition Society and the Korean Society of Community Nutrition
This is an Open Access article distributed under the terms of the Creative Commons Attribution Non-Commercial License (http://creativecommons.org/licenses/by-nc/3.0/) which permits unrestricted non-commercial use, distribution, and reproduction in any medium, provided the original work is properly cited.
dyslipidemia, and antioxidant status in db/db mice to evaluate the value of quercetin as a possible agent for managing type 2 diabetes mellitus.
Materials and Methods
Reagents
Assay kits for glucose, triglycerides, total cholesterol, and HDL-cholesterol were purchased from Asan Co. (Seoul, Korea).
An insulin assay kit from Linco Co. (St. Charles, MO, USA) and an enzyme-linked immunosorbent assay (ELISA) kit for adiponectin from BioVendor Research and Diagnostic Products (Modrice, Czech Republic) were used. Casein,
L-Cystine, a mineral mixture, and a vitamin mixture were acquired from ICN Pharmaceuticals Inc. (Costa Mesa, CA, USA), and tert-butyl hydroquinone was obtained from Fluka Co. (Milwaukee, WI, USA). Sucrose and soybean oil from Cheiljedang Co. (Seoul, Korea) and cornstarch from Daesang Co. (Seoul, Korea) were also used. The quercetin, alphacel, choline bitartrate, and all other chemical reagents used in this study were purchased from Sigma Chemical Co. (St. Louis, MO, USA).
Animals and experimental protocol
Four-week-old male C57BL/KsJ-db/db mice (n = 18) were obtained from the Korean Research Institute of Bioscience and Biotechnology, Ochang, Korea. All animals had free access to commercial chow during 1 week of adaptation and then were randomly divided into three groups. The mice were offered AIN-93G or a diet containing quercetin at 0.04% (wt/wt, low quercetin, LQE) and 0.08% of the diet (high quercetin, HQE) at the sacrifice of cornstarch ad libitum for 6 weeks. The composition of the AIN-93G diet was 39.8% cornstarch, 20%
casein, 13.2% dextrinized cornstarch, 10% sucrose, 7% soybean oil, 5% Alphacel, 3.5% mineral mixture, 1% vitamin mixture, 0.3%
L-Cystine, 0.25% choline bitartrate, and 0.0014% tert-butyl hydroquinone [21]. Body weight and food intake of the animals were measured three times a week. The mice were housed individually in plastic cages and under conditions of controlled temperature (23-27℃), humidity (50-60%), and lighting cycle (0600-1800 hr light and 1800-0600 hr dark). All animal experiments were done according to the guidelines of the Animal Resource Center at Inje University, Korea.
Biochemical analyses of plasma and liver tissue
At the end of the experimental period, the mice were sacrificed by heart puncture after an overnight fast, and blood and liver samples were immediately collected. Blood samples were centrifuged at 1,500g for 15 min to acquire plasma. Plasma and liver samples were frozen at -70℃ for further analysis. Plasma
glucose, triglycerides, total cholesterol, and HDL-cholesterol levels were measured enzymatically using commercial kits (Asan Co., Seoul, Korea), and insulin levels were determined using a radioimmunoassay kit (Linco Co., St. Charles, MO, USA). The homeostasis model assessment for insulin resistance (HOMA-IR) was calculated by dividing the product of insulin (μU/mL) and glucose (mmol/L) by 22.5 [22]. Plasma adiponectin levels were measured using a commercial ELISA assay kit (BioVendor Research and Diagnostic Products, Modrice, Czech Republic).
To determine hepatic lipid peroxide levels, liver tissue was mixed with 5 times the volume of 10 mM sodium phosphate buffer (pH 7.4) and homogenized using a glass Teflon homogenizer. Thiobarbituric acid reactive substances (TBARS) of the homogenate were measured employing the method of Ohkawa et al. [23]. To measure the activities of antioxidant enzymes, liver tissue was mixed with 10 times the volume of 50 mM phosphate buffer (pH 7.4) and homogenized. After the mixture was centrifuged at 600g at 4℃ for 10 minutes, the catalase (CAT) and glutathione peroxidase (GSH-Px) activities of the supernatant were measured by the Aebi method [24] and the method developed by Paglia and Valentine [25], respectively.
One unit of CAT activity was defined as the amount of the enzyme required to remove 1 μM substrate per minute. One unit of GSH-Px activity was defined as the amount of the enzyme that converted 1 μM NADPH substrate to NADP
+per minute.
The supernatant was further centrifuged at 1,100g for 20 minutes to collect the remaining supernatant, which was used for measurement of superoxide dismutase (SOD) activity by the method developed by Marklund and Marklund [26]. One unit of SOD activity was defined as the amount of enzyme that reduces the rate of autoxidation of pyrogallol by 50%. The protein content was measured by the Bradford method with bovine serum albumin as the standard [27]. The enzyme activities were expressed as specific activity (U/mg protein). All assays were conducted in triplicate.
Statistical analysis
All values were expressed as the mean ± standard deviation (SD). Statistical differences among the experimental groups were assessed by one-way analysis of variance. Tukey’s test was used as a follow-up test and significance was defined at P < 0.05.
Results
Effect of quercetin on hyperglycemia and dyslipidemia
Body weight, weight gain, food intake, and feed efficiency ratio
(FER) did not significantly differ among the control, LQE, and
HQE groups (Table 1). Consumption of low (408.1 ± 46.1
mg/dL) and high quercetin (332.8 ± 37.6 mg/dL) significantly
decreased plasma glucose levels by 15% and 31%, respectively,
(A) (B)
(C) (D)
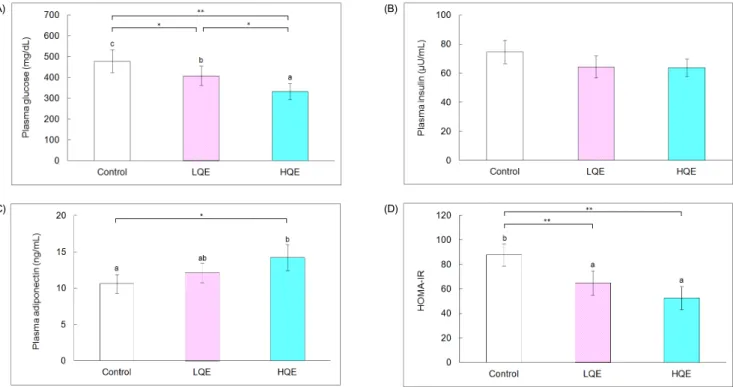
Fig. 1. Plasma glucose, insulin and adiponectin and HOMA-IR of db/db mice. A, Plasma glucose; B, Plasma insulin; C, Plasma adiponectin; and D, HOMA-IR. The control group was fed AIN-93G diet, whereas the low and high quercetin (LQE and HQE) groups were fed a diet containing 0.04% and 0.08% quercetin for 6 weeks. Values are mean ± SD (n = 6). Each bar with different letters is significantly different (*P< 0.05, **P< 0.01). ns = not significant
Control LQE HQE
Initial body weight (g) 23.8 ± 2.2ns2) 24.0 ± 2.0 23.5 ± 1.3 Final body weight (g) 43.7 ± 2.9ns 42.1 ± 2.0 40.3 ± 2.4 Weight gain (g/d) 0.474 ± 0.102ns 0.431 ± 0.074 0.400 ± 0.74
Food intake (g/d) 4.5 ± 0.4ns 4.3 ± 0.3 4.2 ± 0.4
FER1) (%) 10.8 ± 2.6ns 10.0 ± 1.6 9.3 ± 1.5
The control group was fed AIN-93G diet, whereas the low and high quercetin (LQE and HQE) groups were fed a diet containing 0.04% and 0.08% quercetin (wt/wt) ad libitum for 6 weeks. Values represent mean ± SD (n = 6).
1)Feed efficiency ratio (%) = (Body weight gain [g/day]/food intake [g/day]) × 100
2)Not significant
Table 1. Body weight, food intake, and feed efficiency ratio of db/db mice
compared with the control group (478.5 ± 54.4 mg/dL, P < 0.05 and P < 0.01, respectively, Fig. 1). Plasma glucose levels of the HQE group were further decreased compared with the LQE group (P < 0.05). Insulin levels of the control (74.7 ± 8.1 μU/mL), LQE (64.4 ± 7.7 μU/mL), and HQE (63.7 ± 6.1 μU/mL) groups were not significantly different; however, low (64.8 ± 9.7) and high quercetin (53.6 ± 9.4) reduced HOMA-IR values by 26% and 40%, respectively, compared with the control group (87.7 ± 9.1, P < 0.01). There was no significant difference between the HOMA-IR values for the LQE and HQE groups. High quercetin (14.2 ± 1.8 ng/mL) increased plasma adiponectin by 34%
compared with the control group (10.6 ± 1.3 ng/mL, P < 0.05).
Plasma adiponectin levels of the LQE group (12.1 ± 1.3 ng/mL) were not significantly different from those of the control and HQE groups.
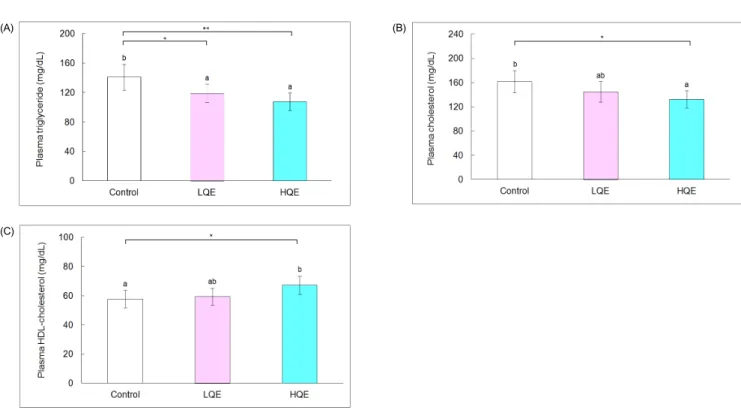
Plasma triglyceride levels of the LQE (118.8 ± 12.6 mg/dL)
and HQE groups (107.7 ± 46.1 mg/dL) were lower by 16% and 24%, respectively, than those of the control group (141.0 ± 12.0 mg/dL, P < 0.05 and P < 0.01, respectively, Fig. 2). High quercetin decreased total cholesterol (132.5 ± 14.3 mg/dL) and increased HDL-cholesterol (67.2 ± 6.2 mg/dL) by 18% and 15%, respectively, compared with the control group (161.8 ± 18.2 mg/dL and 57.8 ± 5.9 mg/dL, respectively, P < 0.05). Plasma total cholesterol (144.7 ± 17.2 mg/dL) and HDL-cholesterol of the LQE group (59.5 ± 5.8 mg/dL) were not significantly different from those of the control and HQE groups.
Effect on lipid peroxides and antioxidant enzyme activity The effects of quercetin on concentrations of lipid peroxides and activities of antioxidant enzymes in the liver are shown in Fig. 3. Hepatic TBARS levels of the LQE (2.25 ± 0.35 nmol MDA/mg protein) and HQE groups (1.74 ± 0.24 nmol MDA/mg protein) were lower by 22% and 40%, respectively, than those of the control group (2.90 ± 0.46 nmol MDA/mg protein, P <
0.05 and P < 0.01, respectively). Activities of SOD and CAT in the liver of the LQE (34.5 ± 3.9 and 14.7 ± 2.0 U/mg protein, respectively, P < 0.05) and HQE groups (37.9 ± 3.8 and 15.7 ±
1.6 U/mg protein, respectively) were elevated compared with
the control group (27.6 ± 3.0 and 11.9 ± 1.5 U/mg protein,
respectively, P < 0.01). Consumption of low (17.8 ± 1.8 U/mg
protein) and high (18.1 ± 2.0 U/mg protein) quercetin levels
increased hepatic GSH-Px activity compared with the control
group (14.6 ± 1.7 U/mg protein; P < 0.05).
(A) (B)
(C)
Fig. 2. Plasma lipid profile of db/db mice. A, Plasma triglycerides; B, Plasma total cholesterol; and C, Plasma HDL-cholesterol. The control group was fed AIN-93G diet, whereas the low and high quercetin (LQE and HQE) groups were fed a diet containing 0.04% and 0.08% quercetin for 6 weeks. Values are mean ± SD (n = 6). Each bar with different letters is significantly different (*P< 0.05, **P< 0.01).
(A) (B)
(C) (D)
Fig. 3. Biomarkers associated with oxidative stress in the liver. A, TBARS; B, SOD activity; C, CAT activity; and D, GSH-Px activity. The control group was fed AIN-93G diet, whereas the low and high quercetin (LQE and HQE) groups were fed a diet containing 0.04% and 0.08% quercetin for 6 weeks. Values are mean ± SD (n = 6). Each bar with different letters is significantly different (*P< 0.05, **P< 0.01).
Discussion
Quercetin is a major common flavonoid that is widely distributed in plants which could have anti-diabetic effects;
however, most studies have used animal models of type 1 diabetes [11,12,14,15,19,20]. In this study, the anti-diabetic effects of quercetin offered in the diet at different levels (LQE and HQE) were evaluated in leptin receptor-deficient db/db mice, which display metabolic disturbances associated with type 2 diabetes, including obesity, hyperglycemia, hyperinsulinemia, and dyslipidemia. Consumption of quercetin at 0.04% and 0.08%
of the diet did not show significant influence on body weight, food intake, and FER of the db/db mice. The average intakes of quercetin in the LQE and HQE groups were calculated as 52 and 105 mg/kg/d, respectively, based on food intake and average body weight.
Quercetin has shown α-glucosidase inhibitory activity in vitro [16,17], and acute consumption of quercetin was found to be effective in controlling postprandial blood glucose in STZ- induced diabetic rats [18]. Chronic consumption of QE (0.1%
of diet) decreased blood glucose in STZ-treated rats [19,20].
Long-term consumption of quercetin at 0.08% of the diet also exerted a hypoglycemic effect in db/db mice [18]. In this study, quercetin offered at 0.04% was enough to control fasting glucose, and the hyperglycemic effect of quercetin was dose dependent.
Since α-glucosidase is the major enzyme in the digestion of dietary starch, α-glucosidase inhibitors, such as acarbose, are used as an oral hypoglycemic agent for type 2 diabetes mellitus [28]. Both low and high levels of quercetin were effective in decreasing HOMA-IR. HOMA-IR is a surrogate index for insulin resistance [29]. High quercetin elevated plasma adiponectin in these animals. This result is similar to previous findings which demonstrated that quercetin increases adiponectin levels in animals with insulin resistance, such as western diet-fed mice [13]. Adiponectin is a hormone produced from adipose tissue, which reduces insulin resistance [30]. The hypoglycemic effect of quercetin could be due to α-glucosidase inhibition and partly due to elevation in adiponectin. Since to control blood glucose as close to normal as possible is the primary goal of treatment of diabetes [31], quercetin could be useful in management of type 2 diabetes.
Quercetin also had a beneficial effect on the plasma lipid profile in db/db mice. Low and high quercetin improved hypertriglyceridemia, whereas high quercetin lowered plasma cholesterol and elevated HDL-cholesterol. Kobori et al. [13]
reported that quercetin decreased expression of peroxisome proliferator-activated receptor-α (PPAR-α) and sterol regulatory element-binding protein-1c (SREBP-1c) in the liver of mice fed a western diet, resulting in decreased synthesis of triglycerides.
Quercetin was reported to reduce de novo fatty acid and triglycerides synthesis and acetyl-CoA carboxylase (ACC) activity in rat hepatocytes [32]. These were suggested as the possible mechanisms contributing to the hypotriglyceridemic
effect of quercetin. Therefore, quercetin could improve dyslipid- emia by regulating the expression of PPARα, SREBP-1c, and ACC. Further study to investigate the expression of these proteins in db/db mice is needed to verify the mechanisms for the hypo- triglyceridemic and hypocholesterolemic effects of quercetin in these animals. It was reported that chronic consumption of acarbose decreased blood triglyceride and cholesterol levels in diabetic rats [33]. In this study quercetin with α-glucosidase inhibition activity improved dyslipidemia in db/db mice.
CVD has been reported to be significantly associated with increased triglycerides and decreased HDL-cholesterol concentra- tions in diabetic patients [34]. Lowering cholesterol reduces the risk for CVD in individuals both with and without diabetes mellitus [35]. Thus, quercetin may contribute to prevention or improvement of cardiovascular complications via modification of the blood lipid profile in diabetics.
In diabetics, overproduction of reactive oxygen species (ROS) and free radicals occurs, and the antioxidant potential is decreased, inducing oxidative stress [4]. Oxidative stress can aggravate diabetic complications by augmented lipoprotein oxidation [5,36], activation of proinflammatory signals, and inactivation of anti-atherogenic enzymes, prostacyclin synthase and endothelial nitric oxide synthase (eNOS) [37]. In this study, low and high levels of quercetin effectively reduced TBARS of the liver, suggesting that quercetin behaves as a strong antioxidant in this animal model. Quercetin was reported to be a potent antioxidant by directly scavenging ROS and free radicals [10,38]. In addition, quercetin also activates the function of antioxidant enzymes [39]. Antioxidant enzyme systems, such as SOD, CAT, and GSH-Px, react with reactive species and protect the cells against oxidative damage [40,41]. In the present study, quercetin offered at 0.04% and 0.08% of the diet increased the activities of hepatic SOD, CAT, and GSH-Px in db/db mice. These results are in line with the previous findings that quercetin resulted in decreases in plasma and hepatic TBARS and increases in the activities of hepatic SOD and CAT in STZ-treated rats [11,12]. SOD catalyzes the reaction decomposing superoxide radicals (O2
•-) to H
2O
2. The H
2O
2can be then converted to water by CAT in the peroxisomes or involved in oxidization of GSH to GSSG by GSH-Px in the cytosol [40,41]. Thus, quercetin could reduce oxidative damage, thereby effectively alleviating diabetic complications in this animal model.
In conclusion, dietary quercetin offered at 0.04% and 0.08%
of the diet improved hyperglycemia, hypertriglyceridemia, and
antioxidant status; whereas quercetin offered at 0.08% alleviated
hypercholesterolemia and elevated HDL-cholesterol in db/db
mice. Thus, quercetin may be useful in the management of
diabetes mellitus and prevention of diabetic complications.
References
1. Cheng D. Prevalence, predisposition and prevention of type II diabetes. Nutr Metab (Lond) 2005;2:29.
2. King H, Aubert RE, Herman WH. Global burden of diabetes, 1995-2025: prevalence, numerical estimates, and projections.
Diabetes Care 1998;21:1414-31.
3. O'Keefe JH Jr, Miles JM, Harris WH, Moe RM, McCallister BD.
Improving the adverse cardiovascular prognosis of type 2 diabetes.
Mayo Clin Proc 1999;74:171-80.
4. Maritim AC, Sanders RA, Watkins JB 3rd. Diabetes, oxidative stress, and antioxidants: a review. J Biochem Mol Toxicol 2003;
17:24-38.
5. Rahimi R, Nikfar S, Larijani B, Abdollahi M. A review on the role of antioxidants in the management of diabetes and its complications. Biomed Pharmacother 2005;59:365-73.
6. Garg A, Grundy SM. Management of dyslipidemia in NIDDM.
Diabetes Care 1990;13:153-69.
7. American Diabetes Association. Management of dyslipidemia in adults with diabetes. Diabetes Care 2003;26 Suppl 1:583-6.
8. Giacco F, Brownlee M. Oxidative stress and diabetic complications.
Circ Res 2010;107:1058-70.
9. Rao YK, Geethangili M, Fang SH, Tzeng YM. Antioxidant and cytotoxic activities of naturally occurring phenolic and related compounds: a comparative study. Food Chem Toxicol 2007;45:
1770-6.
10. Boots AW, Haenen GR, Bast A. Health effects of quercetin: from antioxidant to nutraceutical. Eur J Pharmacol 2008;585:325-37.
11. Mahesh T, Menon VP. Quercetin allievates oxidative stress in streptozotocin-induced diabetic rats. Phytother Res 2004;18:
123-7.
12. Dias AS, Porawski M, Alonso M, Marroni N, Collado PS, González-Gallego J. Quercetin decreases oxidative stress, NF- kappaB activation, and iNOS overexpression in liver of streptozo- tocin-induced diabetic rats. J Nutr 2005;135:2299-304.
13. Kobori M, Masumoto S, Akimoto Y, Oike H. Chronic dietary intake of quercetin alleviates hepatic fat accumulation associated with consumption of a Western-style diet in C57/BL6J mice. Mol Nutr Food Res 2011;55:530-40.
14. Vessal M, Hemmati M, Vasei M. Antidiabetic effects of quercetin in streptozocin-induced diabetic rats. Comp Biochem Physiol C Toxicol Pharmacol 2003;135C:357-64.
15. Torres-Piedra M, Ortiz-Andrade R, Villalobos-Molina R, Singh N, Medina-Franco JL, Webster SP, Binnie M, Navarrete-Vázquez G, Estrada-Soto S. A comparative study of flavonoid analogues on streptozotocin-nicotinamide induced diabetic rats: quercetin as a potential antidiabetic agent acting via 11beta-hydroxysteroid dehydrogenase type 1 inhibition. Eur J Med Chem 2010;45:2606- 12.
16. Ishikawa A, Yamashita H, Hiemori M, Inagaki E, Kimoto M, Okamoto M, Tsuji H, Memon AN, Mohammadio A, Natori Y.
Characterization of inhibitors of postprandial hyperglycemia from the leaves of Nerium indicum. J Nutr Sci Vitaminol (Tokyo) 2007;53:166-73.
17. Jo SH, Ka EH, Lee HS, Apostolidis E, Jang HD, Kwon YI.
Comparison of antioxidant potential and rat intestinal α-glucosi- dases inhibitory activities of quercetin, rutin, and isoquercetin. Int J Applied Res Nat Prod 2009;2:52-60.
18. Kim JH, Kang MJ, Choi HN, Jeong SM, Lee YM, Kim JI.
Quercetin attenuates fasting and postprandial hyperglycemia in
animal models of diabetes mellitus. Nutr Res Pract 2011;5:
107-11.
19. Ramachandra R, Shetty AK, Salimath PV. Quercetin alleviates activities of intestinal and renal disaccharidases in streptozotocin- induced diabetic rats. Mol Nutr Food Res 2005;49:355-60.
20. Shetty AK, Rashmi R, Rajan MGR, Sambaiah K, Salimath PV.
Antidiabetic influence of quercetin in streptozotocin-induced diabetic rats. Nutr Res 2004;24:373-81.
21. Reeves PG, Nielsen FH, Fahey GC Jr. AIN-93 purified diets for laboratory rodents: final report of the American Institute of Nutrition ad hoc writing committee on the reformulation of the AIN-76A rodent diet. J Nutr 1993;123:1939-51.
22. Haffner SM, Miettinen H, Stern MP. The homeostasis model in the San Antonio Heart Study. Diabetes Care 1997;20:1087-92.
23. Ohkawa H, Ohishi N, Yagi K. Assay for lipid peroxides in animal tissues by thiobarbituric acid reaction. Anal Biochem 1979;95:351-8.
24. Aebi H. Catalase. In: Bergmeyer HU, editor. Methods of Enzymatic Analysis. New York: Academic Press; 1974. p.673-83.
25. Paglia DE, Valentine WN. Studies on the quantitative and qualitative characterization of erythrocyte glutathione peroxidase.
J Lab Clin Med 1967;70:158-69.
26. Marklund S, Marklund G. Involvement of the superoxide anion radical in the autoxidation of pyrogallol and a convenient assay for superoxide dismutase. Eur J Biochem 1974;47:469-74.
27. Bradford MM. A rapid and sensitive method for the quantitation of microgram quantities of protein utilizing the principle of protein-dye binding. Anal Biochem 1976;72:248-54.
28. Standl E, Baumgartl HJ, Füchtenbusch M, Stemplinger J. Effect of acarbose on additional insulin therapy in type 2 diabetic patients with late failure of sulphonylurea therapy. Diabetes Obes Metab 1999;1:215-20.
29. Muniyappa R, Lee S, Chen H, Quon MJ. Current approaches for assessing insulin sensitivity and resistance in vivo: advantages, limitations, and appropriate usage. Am J Physiol Endocrinol Metab 2008;294:E15-26.
30. Sheng T, Yang K. Adiponectin and its association with insulin resistance and type 2 diabetes. J Genet Genomics 2008;35:321-6.
31. The Diabetes Control and Complications Trial Research Group.
The effect of intensive treatment of diabetes on the development and progression of long-term complications in insulin-dependent diabetes mellitus. N Engl J Med 1993;329:977-86.
32. Gnoni GV, Paglialonga G, Siculella L. Quercetin inhibits fatty acid and triacylglycerol synthesis in rat-liver cells. Eur J Clin Invest 2009;39:761-8.
33. Azuma K, Toyofuku Y, Iesaki T, Otsuka A, Tanaka A, Mita T, Hirose T, Tanaka Y, Daida H, Kawamori R, Watada H. Acarbose, an alpha-glucosidase inhibitor, improves endothelial dysfunction in Goto-Kakizaki rats exhibiting repetitive blood glucose fluctua- tion. Biochem Biophys Res Commun 2006;345:688-93.
34. Haffner SM. Management of dyslipidemia in adults with diabetes. Diabetes Care 1998;21:160-78.
35. Stamler J, Vaccaro O, Neaton JD, Wentworth D. Diabetes, other risk factors, and 12-yr cardiovascular mortality for men screened in the Multiple Risk Factor Intervention Trial. Diabetes Care 1993;16:434-44.
36. Witztum JL, Steinberg D. The oxidative modification hypothesis of atherosclerosis: does it hold for humans? Trends Cardiovasc Med 2001;11:93-102.
37. Du X, Edelstein D, Obici S, Higham N, Zou MH, Brownlee M.
Insulin resistance reduces arterial prostacyclin synthase and eNOS activities by increasing endothelial fatty acid oxidation. J Clin Invest 2006;116:1071-80.
38. Hanasaki Y, Ogawa S, Fukui S. The correlation between active oxygens scavenging and antioxidative effects of flavonoids. Free Radic Biol Med 1994;16:845-50.
39. Galati G, O'Brien PJ. Potential toxicity of flavonoids and other
dietary phenolics: significance for their chemopreventive and anticancer properties. Free Radic Biol Med 2004;37:287-303.
40. Harman D. The aging process: major risk factor for disease and death. Proc Natl Acad Sci U S A 1991;88:5360-3.
41. Dröge W. Free radicals in the physiological control of cell function. Physiol Rev 2002;82:47-95.