2014. 11. 제 53권, 제 4호, 463-478. November. 2014, Vol. 53, No. 4, 463-478.
463
Sociocultural Factors Influencing Gender Differences in Mathematics Attitude and Achievement for Korean Students in TIMSS 2011
★
Yoo, Yang-Seok(Kookmin University)
Ⅰ. Introduction
The Korean students have been consistently performing at the highest levels in mathematics achievement in the world. In the TIMSS 2011 mathematics assessment for the eighth grade students, the Korean students were rated number one in the world (Mullis, Martin, Foy & Alka, 2012). In the prior years, the Korean students were rated number two in 1999, 2003, and 2007 and number three in 1995 (Mullis, et al., 2012; Mullis, Martin & Foy, 2008;
Mullis, Martin, Gonzalez & Chrostowski, 2004; Mullis, Martin, Gonzalez, Gregory & Garden, 2000). Although the Korean students have been performing at the highest levels of mathematics achievement, the Korean girls' average achievement scores have been persistently lower than the boys' average scores from Korea’s first TIMSS assessment in 1995 to the most recent assessment in 2011 (Mullis, et al., 2000; Mullis, et al., 2004; Mullis, et al., 2008; Mullis, et al., 2012).
The figure 1 represents the Korean eighth grade boys' and girls' average mathematics achievement scores from TIMSS 1995 to TIMSS 2011.
For two assessments, TIMSS 1995 and TIMSS 2011, the gender differences were statistically
* Received July 23, 2014; revised September 22, 2014;
accepted November 12, 2014
* ZDM Classification: A73
* MSC2000 Classification : 97C60
* Key Words : gender differences, TIMSS mathematics achievement, sociocultural factors, mathematics attitude, mathematics curriculum
* This study is a part of 2013 doctoral thesis.
significant. In the TIMSS 2011 mathematics assessments, there were no gender difference in 22 of the 42 countries, a difference favoring girls in 13 countries and a difference favoring boys in seven countries which included Korea (Mullis, et al., 2012).
With Mathematics being a foundation subject, the gender differences in mathematics achievement is a concern and educators seek to close the gender gap in mathematics education (Kim, 2008; Korea Institute for Curriculum and Education, 2013). Numerous studies have attributed gender differences in mathematics achievement to sociocultural factors such as parental expectations and involvement in education (Choi, 2013;
Halpern, Benbow, Geary, Gur, Hyde & Gernsbacher, 2007; Geist & King, 2008; Lee, 2006;
O’Connoer-Petruso & Miranda, 2004), teacher efficacy and influence (House, 2004; Park, 2006; Shin, 2012; Go, 2004), school environment and affinity (Blum &
Libbey, 2004; Whang, 2006) as well as mathematics attitude (Else-Quest, Hyde & Lynn, 2010; Go, 2004;
Kim, 2003; Leung, Graf & Lopez-Real, 2006; Mullis, et al., 2012).
The purpose of this study is to develop and apply a conceptual model to examine how sociocultural factors such as parents, teachers and schools influence gender differences in students' mathematics attitude and mathematics achievement for Korean students using the TIMSS 2011 results. Although there have been various studies based on TIMSS data, there are limited studies based on the most recent TIMSS 2011 results (KICE, 2013). Some of the prior studies include: Kim and Kim (2009) which analyzed the level
[Fig. 1] Gender Differences in Mathematics Achievement in Korea: 1995 – 2011
Note: * represents achievement significantly higher than other gender (Mullis, et al., 2012)
of difficulty across TIMSS 1999, 2003, 2007; Sohn and Go (2012) which analyzed PISA and TIMSS questions and developed recommendations for teaching and study practices; Joo, Lee and Yoo (2012) which investigated the structural relationship between Korean middle school students` self-confidence, positive attitude, instructional activities and achievement in mathematics; Kim et al., (2012) which examined the influence of educational environment to mathematics achievement. Some of these studies utilized models to examine relationship among various social and psychological variables and mathematics achievement.
This study's model is unique in its attempt to understand the effects of sociocultural factors on students' mathematics attitude and their combined effects on mathematics achievement. The development and application of the model to uniquely examine the strengths of the factors influencing gender differences in mathematics achievement can help educators to identify and minimize gender-based influences that can impede girls’ mathematics achievements and reduce gender gap in mathematics achievement. The findings of the study can serve as an input to the national initiative to reduce gender gap in mathematics achievement (Korean Institute of Curriculum and
Evaluation, 2008 & 2013). Given there are limited studies of Asian countries (Else-Quest, et al., 2010;
Lee & Lee, 2011; Shin, 2012) this study can provide additional insight on gender differences in mathematics achievement.
Ⅱ. Theoretical Background
The following sections discuss studies that have attributed gender differences in mathematics achievement to sociocultural factors such as parental expectations and involvement in education, teacher efficacy and influence, school environment and affinity as well as students' mathematics attitude.
1. Parent, Teacher and School Factors
Recent studies on gender differences in mathematics achievement have attributed the gender differences not to physiological differences but to sociocultural factors. The countries of higher gender parity tend to show higher girls' mathematics achievement levels (Choi, 2013). The Korean middle school girls indicated that social and cultural factors influence their career choices in science and technology (Lee, Choi, Lee, Ma & Lee, 2005). For example, the girls agreed more with 'difficulty in employment for girls in science and engineering majors,' and 'avoidance of science and engineering majors due to male dominating environment.' Guiso, Monte, Sapienza and Zingales (2008), using 2003 PISA data testing of fifteen year olds from forty countries, found that gender inequality as measured by the Global Gender Gap Index (GGI) which captures the magnitude and scope of gender disparities in a country significantly correlated with the magnitude of the mean mathematics gender gap. According to the 2011 GGI, Korea, was identified as one of the lower gender-parity nations in the world (Hausmann, Tyson
& Zahidi, 2011). The low gender equity level of
Korean society may influence gender stereotyped views of mathematics and science. Related to the awareness of women scientists, 97.3% girls did not know of any Korean women scientists and engineers.
However, 32.6% of girls knew two to four male scientists For example, girls knew Albert Einstein, Thomas Edison, Isaac Newton, Stephen Hawking (Lee, et al., 2005).
O'Connoer-Petruso and Miranda (2004), based on the analysis of gender inequities in Korea, Singapore, and Taiwan mathematics achievement, found that parental expectations for their children's future careers mirrored gender typing in all three countries. Boys were encouraged to pursue technical careers while girls were directed towards fields in literature. As such boys take more advanced courses in higher mathematics than girls. Lee (2006) found that the Korean parents preferred girls to pursue colleges for domestic affairs or teaching colleges. Whang (2006) identified that Korean girls showed higher parental influence on achievement levels than the boys. Geist and King (2008) also found that differences in parental expectation between boys and girls could influence the children's attitude towards mathematics and the choice of profession. Given that parents stereotyped beliefs influence children's attitude towards mathematics, intervention programs were recommended not just for students but for parents to address gender stereotyped beliefs and provide equal support for both their daughters and sons (Lee, Lee, & Paik, 2010).
Shin (2012), based on the PISA 2003 results, found that Korean boys showed higher positive attitude towards teachers than the girls. Park (2006) found that teacher efficacy has positive influence on student achievement levels. Go (2004) indicated that teacher efficacy has effect on students' attitude towards mathematics and students' attitude has positive effect on mathematics achievement. House (2004) indicated that students who know that their teachers care about
them and have clear and reasonable expectation can get better scores. Supportive teachers play a significant role in student's engagement in school.
School climate and culture are important factors for students' achievement (Blum & Libbey, 2004). Chung (2002), based on a study involving Korean fourth grade and eighth grade students, identified that peer relationship has an influence on student achievement levels. Additionally, Whang (2006) identified that peer relationship has more significant influence on educational achievement for Korean girls than boys.
2. Mathematics Attitude of Students
Mullis, et al. (2012) found a strong positive relationship between students' mathematics attitude (like learning mathematics; value learning mathematics; confident with mathematics) and mathematics achievement levels. The boys have more positive attitude towards mathematics than girls do.
Leung, et al. (2006) identified that superior performance of the East Asian students is not accompanied by the anticipated positive student attitude toward mathematics. Korean students, compared to those of other countries, reported lower affinity to mathematics and lower appreciation of the value of mathematics. In particular, Korean girls reported lower levels than boys (Lee, 2013). The trend has been consistent over the years. Kim (2003) found that girls showed more negative attitude towards mathematics than do boys. Although boys and girls had similar attitude toward mathematics at the beginning of the seventh grade, the girls showed a significant negative attitude towards mathematics than did the boys at the end of the academic year.
The students' positive attitude had positive effect on mathematics achievement levels (Go, 2004).
The analysis of TIMSS 2003 mathematics achievement data, identified that gender differences in mathematics achievement were significantly correlated
[Fig. 2] Conceptual Model: Influence of Factors on Mathematics Achievement
Attributes Data Source
Parental involvement in education TIMSS 2011 Student Questionnaire Teacher efficacy TIMSS 2011 Student Questionnaire School affinity TIMSS 2011 Student Questionnaire Like learning mathematics TIMSS 2011 Student Questionnaire Value learning mathematics TIMSS 2011 Student Questionnaire Confident with mathematics TIMSS 2011 Student Questionnaire Mathematics achievement scores TIMSS 2011 Achievement Results
with gender differences in students' valuing of mathematics (Else-Quest, et al., 2010). If girls do not perceive value in mathematics education they will put less effort, and as a consequence their performances will be expected to be low (Bleeker & Jacobs, 2004).
Else-Quest, et al. (2010) using the TIMSS 2003 data identified also noted that gender differences in mathematics achievement were significantly correlated with gender differences in self-confidence in mathematics. For societies where boys are expected to pursue more technical careers and take more advanced mathematics courses, boys have more opportunities to develop confidence in mathematics and in return can establish a perpetual view that boys perform better in mathematics than girls (O'Connoer-Petruso and Miranda, 2004). KICE (2013) observed that Korean students' confidence had higher levels of influence on mathematics achievement than other countries' students.
3. Conceptual Model
The conceptual model incorporates the sociocultural factors that have been identified as having influence on gender differences in mathematics achievement, specifically parental involvement in education, teacher efficacy, and school affinity and examines their effect
on mathematics attitude and mathematics achievement.
The figure 2 represents the conceptual model.
Ⅲ. Methods
The following sections discuss data sources ad data analysis conducted for this study.
1. Data Source & Instrumentation
The TIMSS 2011 student questionnaire and achievement data were obtained from the TIMSS 2011 International Database (2013). The data sources for the study is shown on Table 1.
[Table 1] Data Sources for the Study
The TIMSS student questionnaire was structured in 4-point Likert Scale: (1) agree a lot; (2) agree a little; (3) disagree a little; and (4) disagree a lot. For this study the scale was transposed so that a higher number represents stronger agreement and a higher frequency. The transposed scale was: (1) disagree a lot; (2) disagree a little; (3) agree a little; and (4) agree a lot. For the questions involving frequency, the transposed scale was: (1) never or almost never; (2) once or twice a month; (3) once or twice a week; and (4) every day or almost every day. The TIMSS achievement results were reported on a scale from 0 to 1,000, with the TIMSS scale average set at 500 and standard deviation set at 100.
2. Participants and Sample Size of the Study The total numbers of students included in the
Gender No. of Students %
Boys 2,503 48.5%
Girls 2,662 51.5%
Total 5,165 100%
Mean SD Mean SD Mean SD t Sig.
613 1.5 616 1.9 610 1.7 -2.2 0.028*
Total Boys Girls t-Test
analysis were 5,165. The break-down of the students who participated in TIMSS 2011 are summarized in Table 2.
[Table 2] Sample Size for the Study
3. Data Analysis Procedure
For the development of conceptual model, an exploratory factor analysis was conducted to identify underlying factors across thirty two student questionnaire items. The factors of Eigenvalues greater than one were selected as significant factors.
Cronbach's alpha reliability coefficients were computed to determine internal consistency of these factors. For determination of significant differences in boys' and girls' mean responses to each of these factors, t-Test was conducted for p < .05. Then, a path analysis was conducted to compute the path coefficients. The path coefficients represent the strengths of effect. The Variance Inflation Factors (VIF) were computed to assess the multicollinearity of the model. Then, Comparative Fit Index (CFI) was computed to estimate the fit of the model. The conceptual models were reduced to achieve the CFI higher than 0.9 which is considered a reasonably good fit (Hong, 2000, Kim, 2008). For the analysis of statistically significant difference in mathematics achievement between boys and girls, t-Test was conducted for p < .05. The analysis were conducted with SPSS V.21 and SPSS-AMOS V.22.
Ⅳ. Results and Discussion
1. Gender Differences in Achievement Levels The mean achievement scores for the total students
were 613. The boys had the higher mean score (616) than that of girls (610). The differences were statistically significant (p < .05). The mean scores and standard deviations as well as the results of t-Test are provided in Table 3.
[Table 3] Descriptive Statistics and t-Test results for Mathematics Achievement
Note: * significant at p < .05 (two tailed)
2. Gender Differences in Sociocultural Factors and Mathematics Attitude
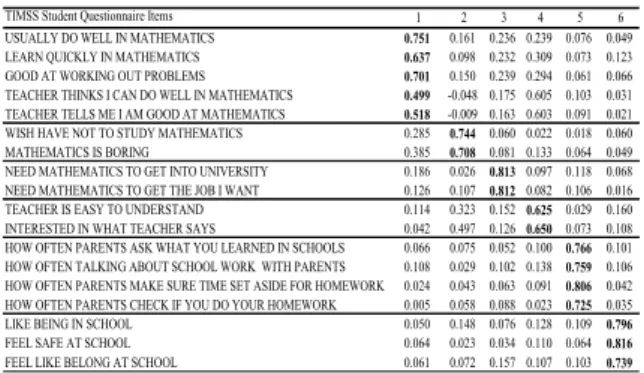
From the TIMSS 2011 student questionnaire, thirty two questions related to sociocultural factors such as parental involvement in education, teacher efficacy an school affinity as well as students' mathematics attitude were identified (Appendix). An exploratory factor analysis was conducted to identify the existence of underlying structure among the thirty two questions for boys and girls. The data were subjected to principal component factor analysis with Varimax Rotation with Kaiser normalization. Based on the Eigenvalues of greater than one, which is the accepted criteria for a significant factor, six factors were selected for the model. Tables 4 and 5 provide factor structures for the rotated principal component solution matrix with factors loadings. For boys and girls there were six factors with Eigenvalues greater than one (Tables 4 and 5 set in bold font). The six factors accounted for 61.9% and 60.9% of the variances for boys and girls, respectively. The six factors are (1) confident with mathematics; (2) like learning mathematics; (3) value learning mathematics; (4) teacher efficacy; (5) parental involvement in education;
and (6) school affinity.
Gender Parental Involveent in Education
Teacher Efficacy
School Affinity
Like Learning Mathematics
Value Learning Mathematics
Confident with Mathematics
Boys 0.869 0.920 0.871 0.928 0.947 0.913
Girls 0.867 0.914 0.857 0.919 0.949 0.907
TIMSS Student Questionnaire Items 1 2 3 4 5 6
USUALLY DO WELL IN MATHEMATICS 0.751 0.161 0.236 0.239 0.076 0.049
LEARN QUICKLY IN MATHEMATICS 0.637 0.098 0.232 0.309 0.073 0.123
GOOD AT WORKING OUT PROBLEMS 0.701 0.150 0.239 0.294 0.061 0.066
TEACHER THINKS I CAN DO WELL IN MATHEMATICS 0.499 -0.048 0.175 0.605 0.103 0.031 TEACHER TELLS ME I AM GOOD AT MATHEMATICS 0.518 -0.009 0.163 0.603 0.091 0.021 WISH HAVE NOT TO STUDY MATHEMATICS 0.285 0.744 0.060 0.022 0.018 0.060
MATHEMATICS IS BORING 0.385 0.708 0.081 0.133 0.064 0.049
NEED MATHEMATICS TO GET INTO UNIVERSITY 0.186 0.026 0.813 0.097 0.118 0.068 NEED MATHEMATICS TO GET THE JOB I WANT 0.126 0.107 0.812 0.082 0.106 0.016 TEACHER IS EASY TO UNDERSTAND 0.114 0.323 0.152 0.625 0.029 0.160 INTERESTED IN WHAT TEACHER SAYS 0.042 0.497 0.126 0.650 0.073 0.108 HOW OFTEN PARENTS ASK WHAT YOU LEARNED IN SCHOOLS 0.066 0.075 0.052 0.100 0.766 0.101 HOW OFTEN TALKING ABOUT SCHOOL WORK WITH PARENTS 0.108 0.029 0.102 0.138 0.759 0.106 HOW OFTEN PARENTS MAKE SURE TIME SET ASIDE FOR HOMEWORK 0.024 0.043 0.063 0.091 0.806 0.042 HOW OFTEN PARENTS CHECK IF YOU DO YOUR HOMEWORK 0.005 0.058 0.088 0.023 0.725 0.035
LIKE BEING IN SCHOOL 0.050 0.148 0.076 0.128 0.109 0.796
FEEL SAFE AT SCHOOL 0.064 0.023 0.034 0.110 0.064 0.816
FEEL LIKE BELONG AT SCHOOL 0.061 0.072 0.157 0.107 0.103 0.739
TIMSS Student Questionnaire Items 1 2 3 4 5 6
USUALLY DO WELL IN MATHEMATICS 0.524 0.641 0.165 0.101 0.098 0.073
LEARN QUICKLY IN MATHEMATICS 0.476 0.512 0.165 0.070 0.110 0.073
GOOD AT WORKING OUT PROBLEMS 0.538 0.531 0.144 0.150 0.121 0.093
TEACHER THINKS I CAN DO WELL IN MATHEMATICS 0.694 0.235 0.141 0.271 0.108 0.027 TEACHER TELLS ME I AM GOOD AT MATHEMATICS 0.654 0.324 0.095 0.314 0.126 0.023 WISH HAVE NOT TO STUDY MATHEMATICS -0.156 0.663 0.167 0.305 0.033 0.031
MATHEMATICS IS BORING 0.000 0.676 0.185 0.365 0.068 0.100
NEED MATHEMATICS TO GET INTO UNIVERSITY 0.185 0.116 0.814 0.063 0.064 0.111 NEED MATHEMATICS TO GET THE JOB I WANT 0.118 0.141 0.817 0.049 0.071 0.103
TEACHER IS EASY TO UNDERSTAND 0.216 0.188 0.127 0.652 0.003 0.106
INTERESTED IN WHAT TEACHER SAYS 0.066 0.263 0.110 0.787 0.028 0.147 HOW OFTEN PARENTS ASK WHAT YOU LEARNED IN SCHOOLS 0.122 0.034 0.089 0.104 0.750 0.086 HOW OFTEN TALKING ABOUT SCHOOL WORK WITH PARENTS 0.197 0.033 0.120 0.097 0.727 0.121 HOW OFTEN PARENTS MAKE SURE TIME SET ASIDE FOR HOMEWORK 0.027 0.057 0.079 0.034 0.807 0.046 HOW OFTEN PARENTS CHECK IF YOU DO YOUR HOMEWORK -0.027 0.084 0.048 0.023 0.743 0.052
LIKE BEING IN SCHOOL 0.003 0.121 0.073 0.131 0.160 0.770
FEEL SAFE AT SCHOOL 0.004 0.079 0.059 0.159 0.083 0.797
FEEL LIKE BELONG AT SCHOOL 0.119 0.035 0.125 0.095 0.049 0.734
[Table 4] Exploratory Factor Analysis for Boys
[Table 5] Exploratory Factor Analysis for Girls
To determine internal consistency of questionnaire items for each factor, Cronbach's alpha reliability coefficient was computed for each factor. Table 6 shows the results of the item-to-total correlations reliability coefficients. The Cronbach's alpha of .8 is a reasonable goal (George & Mallery, 2003). The Cronbach's alpha reliability coefficients for the six factors ranged from 0.857 to 0.941, all representing high internal consistency.
[Table 6] Cronbach's Alpha Reliability Coefficients for Factors
1) Parent, Teacher and School Factors
The 'parent factor' represents the degree of parental involvement in education. The related student questionnaire items are 'how often parents ask about learning in school,' 'how often parents making sure time is set aside for homework,' 'how often parents check for homework,' and 'how often students talk to parents about school.' The scale for the parental involvement was: (1) never or almost never; (2) once or twice a month; (3) once or twice a week; and (4) every day or almost every day.
Table 7 shows that parental involvement in education was higher for boys than the girls (mean responses of 2.32 and 2.24, respectively). The difference between boys and girls was statistically significant. This indicates that the parents of boys were more involved in the education than the parents of girls.
The 'teacher factor' represents teacher efficacy.
The related student questionnaire items are 'teacher is easy to understand,' and 'interested in what teacher says.' Related to the 'teacher efficacy' the boys showed a slightly higher level than the girls (mean responses of 2.40 and 2.36, respectively as shown in Table 7). The study result is consistent with that of Shin (2012) that boys have higher appreciation for teachers than girls. However, this study found that the difference between the boys and girls in 'teacher efficacy' was not statistically significant (Table 7).
The 'school factor' represents school affinity. The related student questionnaire items are 'like being in school,' 'feeling safe at school,' and 'belong at school.' Related to school environment, girls showed a higher level of school affinity than the boys (mean responses of 2.87 and 2.79, respectively as shown in Table 7). The difference was statistically significant.
The result is different for Korean high school students where Kye, Lee, Kim, Park, & Yoo (2001) observed that Korean high school boys had higher
Factors Mean SD Mean SD Difference t Sig.
Like Learning Mathematics 2.41 0.85 2.31 0.77 0.10 -4.33 0.001**
Value Learning Mathematics 3.09 0.79 3.01 0.79 0.09 -4.02 0.001**
Confident w/ Mathematics 2.28 0.63 2.15 0.60 0.13 -7.42 0.001**
Boys Girls
Factors Mean SD Mean SD Difference t Sig.
Parental Involvement in Education 2.32 0.79 2.24 0.79 0.09 -3.99 0.001**
Teacher Efficacy 2.40 0.75 2.36 0.73 0.04 -1.77 0.077 School Affinity 2.79 0.63 2.87 0.55 -0.08 5.10 0.001**
Boys Girls
levels of satisfaction with schools than girls. The different results for this study could mean that middle-school girls, as they advance to high schools, like less about the schools due to the pressures of the college entrance examinations given at this stage.
[Table 7] Gender Differences in Parents, Teachers and School Factors
Note: ** significant at p < .01 (two tailed)
2) Mathematics Attitude
There were statistically significant differences in 'like learning mathematics' between boys and girls.
The boys had a higher mean response to 'like learning mathematics' than the girls (mean responses of 2.41 and 2.31, respectively as shown in Table 8).
The result is consistent with the findings of previous studies showing that boys have more positive attitude towards mathematics and achieve higher in mathematics assessments than girls (Kim, 2003, Lee, 2013; Mullis, et al., 2012; Shin, 2012).
There were statistically significant differences in 'value learning mathematics.' The boys showed a higher appreciation for 'value learning mathematics' than the girls (mean responses of 3.09 and 3.01, respectively as shown in Table 8). The result is consistent with several studies (Else-Quest, et al., 2010; Lee, 2013; Leung, et al., 2006; Shin, 2012) that revealed that boys have higher recognition of the value of mathematics, and achieve higher in mathematics assessments than girls.
There were statistically significant differences in 'confident with mathematics.' The boys and girls had mean responses of 2.28 and 2.15, respectively (Table 8). This result is consistent with those of various studies (Else-Quest, et al., 2010; Lee, 2013; Leung, et
al., 2006; Shin, 2012) which revealed that boys have higher confidence in mathematics than girls, and that boys achieve higher in mathematics.
[Table 8] Gender Differences in Mathematics Attitude
Note: ** significant at p < .01 (two tailed)
3. Conceptual Model
To determine the effect of sociocultural factors on mathematics attitude and mathematics achievement, a path analysis was conducted. For the assessment of multicollinearity of the model, the variance inflation factors (VIF) were computed. The VIFs for individual components were all between 1.0 and 1.6 within the acceptable level. The conceptual model for boys and girls are provided in figures 3 and 4, respectively.
[Fig. 3] Conceptual Model: Boys
Note: *** significant at p < .0001(two tailed)
The CFI (Comparative Fit Index) for the models (figures 3 and 4) were 0.79 and 0.77 for boys and girls, respectively. The CFI ranges from 0 to 1 and CFI higher than 0.9 is considered a good fit (Hong, 2000, Kim, 2008). The reduced models with higher CFI were obtained through elimination of non-significant
[Fig. 4] Conceptual Model: Girls
Note: *** significant at p < .0001(two tailed)
[Fig. 6] Reduced Conceptual Model - Girls Note: *** significant at p < .0001(two tailed) paths. The reduced models (figures 5 and 6) show a
reasonably good fit with CFI of 0.90 and 0.91 for boys and girls, respectively. With the elimination of non-significant paths, the reduced models reflect slightly changes to the path coefficients. The path coefficients are provided in Tables 9 and 10.
[Fig. 5] Reduced Conceptual Model - Boys Note: *** significant at p < .0001(two tailed)
1) Parent, Teacher and School Factors
Parental Involvement in Education - The reduced conceptual models (figures 5 and 6) showed that, for boys and girls, 'parental involvement in education' had positive effect on mathematics achievement through influencing students' 'value learning mathematics' and 'confident with mathematics.' The
'parental involvement in education' did not have a significant effect on students' 'like learning mathematics' nor did it have a significant effect on mathematics achievement. The models revealed that 'parental involvement in education' could not make students like mathematics nor could it directly affect the students' mathematics achievement. The model (figure 6) showed that, for girls, 'parental involvement in education' had stronger effect on girls' 'value learning mathematics,' and 'confident with mathematics (path coefficients of 0.18 and 0.22, respectively) than boys (path coefficients of 0.17 and 0.15, respectively). The result is consistent with the study of Whang (2006) that observed a higher level of parental influence on mathematics achievement for girls than boys.
Teacher Efficacy - the reduced conceptual models (figures 5 and 6) showed 'teacher efficacy' had a positive effect on boys' and girls' 'value learning mathematics' (path coefficient of 0.27 for boys, and 0.25 for girls) and 'confident with mathematics' (path coefficient of 0.46 for boys, and 0.42 for girls). The 'teacher efficacy' had higher effect on students' mathematics attitude than 'parental involvement in education.' The result is consistent with the studies conducted by Park (2006), and Shin (2012) which
Standardized
Estimate S.E. C.R. P
Value Learning Math
<--- Parental Invol. In Education
0.168 0.019 8.87 ***
Confident with Math <---
Parental Invol. In Education
0.152 0.014 8.656 ***
Value Learning Math
<--- Teacher
Efficacy 0.272 0.02 14.341 ***
Confident
with Math <--- Teacher
Efficacy 0.459 0.015 26.166 ***
Math Achievement <---
Value Learning Math
0.214 1.722 13.61 ***
Math
Achievement <--- Confident
with Math 0.561 2.168 35.701 ***
Note: S.E: Standard Error, C.R.: Critical Ratio, ***
represents p < .0001
Standardized
Estimate S.E. C.R. P
Value Learning Math
<--- Teacher
Efficacy 0.275 0.02 13.814 ***
Value Learning Math
<--- Parental Invol. In Education
0.183 0.018 9.975 ***
Confident with Math <---
Parental Invol. In Education
0.161 0.013 12.651 ***
Confident
with Math <--- Teacher
Efficacy 0.338 0.014 24.529 ***
Math Achievement <---
Value Learning Math
18.472 1.609 11.482 ***
Math
Achievement <--- Confident
with Math 80.404 2.154 37.33 ***
[Table 10] Path Coefficients for Girls showed positive influence of teachers on students'
mathematics achievement. The models also revealed a relatively lower level of effect of teacher efficacy on 'value learning mathematics' compared to 'confident with mathematics.' The high pressure of the educational environment may not be conducive for teachers to engage students with enrichment activities and broaden student appreciation of mathematics.
School Affinity - The conceptual models (figures 3 and 4) revealed that 'school affinity' although positive, had relatively weak effect (path coefficients or 0.1 or
< 0.1) on mathematics attitude for boys and girls.
The weak but positive effect is consistent with the study of Blum and Libbey (2004) which reported positive influence of school's climate and culture to mathematics achievement.
[Table 9] Path Coefficients for Boys
2) Mathematics Attitude of Students
Like Learning Mathematics - the conceptual models (figures 3 and 4) revealed that 'like learning mathematics' had very weak effect on boys' and girls' mathematics achievements (path coefficient of 0.01 and -0.01 respectively). The Korean students appeared to have achieved high results in mathematics with perseverance and determination and without
Note: S.E: Standard Error, C.R.: Critical Ratio,
*** represents p < .0001
much regards to affinity to mathematics.
Consequently, there is a very low effect from 'like learning mathematics' to mathematics achievement in Korea. The result is consistent with the analysis of TIMSS 2011 International Results in Mathematics which showed that Korean students were rated the second lowest in liking mathematics among the 42 participating countries (Choe, 2003; KICE, 2013; Mullis, et al., 2012).
Value Learning Mathematics - the reduced conceptual models (figures 5 and 6) revealed positive effect of 'value learning mathematics' to mathematics achievement for boys and girls. The models revealed that 'value learning mathematics' had a higher effect on boys' mathematics achievement than on girls' mathematics achievement (path coefficient of 0.21 for boys vs. 0.18 for girls). This result can be explained by a greater number of boys pursuing science and technology careers and mathematics achievement is an important pre-requisite for admission into top level colleges. Studies conducted by Lee (2013); Leung, et al. (2006); and Shin (2012) also showed positive influence of value of mathematics to mathematics achievement, especially for boys.
Factors Boys Girls Parental Involvement in Education 0.121 0.156
Teacher Efficacy 0.316 0.285
Value Learning Mathematics 0.214 0.176 Confident with Mathematics 0.561 0.572 Math Achievement Confident with Mathematics - the conceptual models (figures 5 and 6) revealed that 'confident with mathematics' had the most significant effect on mathematics achievement for boys and girls (path coefficients of 0.56 for boys and 0.57 for girls). The girls showed a slightly higher level of effect from 'confident with mathematics' on mathematics achievement than the boys. The result implies that an increase in girls' confidence levels can have a greater effect on mathematics achievement levels than that of boys. Initiatives to improve girls' mathematics achievement levels must explore ways to strengthen girls' confidence in mathematics.
The total effects on mathematics achievement from each factor are provided in Table 11. Of the three sociocultural factors, the 'teacher efficacy' had the most significant effect on mathematics achievement and then 'parental involvement in education.' Of the mathematics attitude, 'confident with mathematics' had the most significant effect on mathematics achievement and then 'value learning mathematics.' The 'school affinity' and 'like learning mathematics' had very weak effect on mathematics achievement. As such, these factors were excluded in the reduced models.
[Table 11] Total Effects on Mathematics Achievement
Ⅴ. Conclusions and Implication
Although the Korean students have been performing at the highest levels of mathematics achievement, the Korean girls' average achievement
levels have been persistently lower than boys from Korea's first TIMSS assessment in 1995 to the most recent assessment in 2011 (Mullis, et al., 2000; Mullis, et al., 2004; Mullis, et al., 2008; Mullis, et al., 2012).
Numerous studies have attributed gender differences in mathematics achievement to sociocultural factors of parents, teachers and schools as well as students' mathematics attitude (Choi, 2013; Else-Quest, et al., 2010; Go, 2004; Kim, 2003; Leung, et al., 2006; Mullis, et al., 2012).
This study developed and applied a conceptual model to examine the influence of 'parental involvement in education,' 'teacher efficacy,' and 'school affinity' on students' mathematics attitude and mathematics achievement for Korean eighth grade students using the TIMSS2011 results.
This study found that the parents of boys were more involved in education than the parents of girls.
And the difference was statistically significant. The finding could be a representation of gender stereotyped views towards mathematics and science.
O'Connoer-Petruso and Miranda (2004) and Lee (2006) observed that boys in Asian countries were encouraged by parents to pursue technical careers while girls were directed towards fields in literature.
And the parents of boys may be more involved in the education.
The conceptual model showed that 'parental involvement in education' had an indirect effect on mathematics achievement through influencing students' 'value learning mathematics,' and 'confident with mathematics.' The lower level of 'parental involvement in education' for girls compared to the boys appeared to have contributed negatively to girls' valuing mathematics and confidence levels and in turn negatively to mathematics achievement
The study found that there were no significant gender differences in teacher efficacy. The teachers provided gender equitable influence to students. The
model showed that 'teacher efficacy' had an indirect effect on mathematics achievement through influencing 'value learning mathematics,' and 'confident with mathematics' for boys and girls. The 'teacher efficacy' had more significant effect on mathematics achievement for boys than girls.
The model revealed that 'like learning mathematics' had no significant effect on mathematics achievement for boys and girls. The Korean students appeared to work hard to achieve high results in mathematics with less regard to their interest in mathematics. The model revealed that 'value learning mathematics' had higher effect on mathematics achievement for boys than girls. With more boys pursuing science and technology, mathematics showed higher importance for the boys. The model also showed that 'confidence in mathematics' had a greater effect on mathematics achievement for girls than boys. Increasing girls' confidence in mathematics can have greater improvement in mathematics achievement levels.
Based on the study findings that 'parental involvement in education' has higher influence on mathematics achievement for girls, the actions to reduce gender gap in mathematics must extend beyond the scope of educational curriculums and address the larger sociocultural view of mathematics and science. The OECD (2014) indicated that longer term effort to reduce gender difference in mathematics requires the concerted effort of parents, teachers and society as a whole to change the stereotyped notions of what boys and girls excel at, what they enjoy doing, and what they believe they can achieve. SEDL (2010) indicated that girls' exposure to positive role models has been found to have a positive impact on young women’s math performance and can help dispel negative stereotypes.
Positive messages of 'women in science and technology' could contribute to changing sociocultural perspectives related to women in science and
technology. A broad national campaign of 'women in science and technology' on media (TV, magazines, newspapers, internet) should be considered especially given girls' limited awareness of women scientists in Korea. The schools also need to consider lectures and class discussions on role models in science and technology with consideration for women scientists.
Given the strong effect of 'teacher efficacy' on girls' confidence in mathematics, and in turn their mathematics achievement levels, teachers will need to provide more positive feedback and encouragement to girls, and increase girls' engagement to mathematics lessons by reviewing teaching materials and exercises for relevance to girls.
In continuation of this study, a validation and application of this conceptual model with other mathematics achievements data such as PISA as well as with other countries data are recommended.
Additional studies of the model can raise awareness of the influence of sociocultural factors and the importance of 'parental involvement in education' on gender differences in mathematics achievement.
References
Bleeker, M. M., & Jacobs, J. E. (2004). Achievement in mathematics and science: Do mothers' beliefs matter 12 years later?
Journal of Educational Psychology 96
, 97-109.Choe, Y. H. (2003). The First Curriculum of Mathematics in Korea for the New Millennium.
Journal of the Korean Society of Mathematical Education 7
(2), 73-90.Choi S. I. (2013). Changes in Korean Students' Mathematics Achievement Reflected in TIMSS 2011 and 'Educational Improvement Measures' Discussions. C
haracteristics of Achievement Trends
in Korea's Students from TIMSS 2011, ORM
2013-17 (92-95).
Seoul, Korea: KICE.The First Curriculum of Mathematics in Korea for the New Millennium.
Journal of the Korean Society of Mathematical Education 7
(2), 73-90.Chung, E. J. (2002).
The Relationship between Social Capital and Secondary School Students' Achievement Levels.
(Master Dissertation, Woosuk University).Else-Quest, N., Hyde, J. S., & Linn, M. C. (2010).
Cross National Patterns of Gender Differences in Mathematics: A Meta-Analysis,
Psychological Bulletin 136
(1), 103-127.George, D., & Mallery, P. (2003).
SPSS for Windows step by step: A simple guide and reference 11.0 update (4th ed.).
Boston: Allyn & Bacon, 231.Geist, E. A., & King, M. (2008). Different, not better:
Gender differences in mathematics learning and achievement.
Journal of Instructional Psychology 35
(1), 43-52.Go, H. S. (2004).
(The) relationship among the amount of preceding learning, the academic achievements, and the attitude toward learning in middle-school student's mathematics
(Master Dissertation, Changwon University Graduate School of Education).Guiso, L., Monte, F., Sapienza, P., & Zingales, L.
(2008). Culture, gender, and mathematics.
Science 320,
1164-1165.Halpern, D. F., Benbow, C. P., Geary, D. C., Gur, R., Hyde, J. S., & Gernsbacher, M. A. (2007). The science of sex differences in science and mathematics.
Psychological Science in the Public Interest, 8,
1-51.Hausmann, R., Tyson, L., & Zahidi, S. (2011).
The Global Gender Gap Report 2011.
Cologny/Geneva, Switzerland: World Economic Forum.Hong, S. H. (2000), Selection Criteria and Evidence of Fit for Structural Equation Model.
The Korean Journal of Clinical Psychology 19,
161-177.House, D. J. (2004). Motivational Qualities of
instructional strategies and computer use for mathematics teaching in Japan and the United States.
Internal Journal of Instructional Media 32,
1.Joo, Y. J., Lee, J. H., & Yoo, N. Y. (2012). Difference Analysis of Gender among self-confidence, positive attitude, instructional activities, and achievement in mathematics for middle school student.
Journal of Middle School Education 60
(4), 963-986.Kim, J. C. (2003). A Study on Gender Differences in Attitude Changes toward Mathematics Learning.
Asian Journal of Education 4
(3), 191-223.Kim, K. H. (2008).
Characteristics of Achievement Trend in Korea's Middle and High School Students from International Achievement Assessment (TIMSS/PISA)
. RRE2008-3-1, Seoul, Korea: KICE.Kim, S. H., & Kim, K. H. (2009). Analysis of TIMSS 2007 Released Items Common with TIMSS 1999, 2003 on the View of Curriculum.
The Journal of Educational Research in Mathematics 19
(1), 99-122.Kim, S. J., Park, J. H., Kim, H. K., J, E. N., Lee, M.
J., Kim, J. Y., Ahn, Y. K., & Suh, J. H. (2012).
Findings for TIMSS for Korea : TIMSS 2011 international results.
RRE 2012-4-1. Seoul, Korea:KICE.
Korea Institute for Curriculum and Evaluation (KICE).
(2013).
Characteristics of Achievement Trends in Korea's Students from TIMSS 2011,
ORM 2013-17.Seoul, Korea: KICE.
Kye, S. J., Lee, J. W., Kim, M. C., Park, M. S., &
Yoo, E. Y. (2001). A Study on the Adolescents' School Life and Their Level of Satisfaction.
The Korea Home Economics Association Journal 39
(2), 1-12.Lee, E. S. (2006).
An Exploratory Study on the
Constellations and Mechanisms of Gender
Discrimination in the Korean Scientific Community
(Master Dissertation, Kookmin University, 2006).Lee, E. J., & Lee, K. H. (2011). A Study on the Factors Influencing Gender Differences Changes of Korean students in PISA Mathematics Assessment.
Journal of Educational Research in Mathematics 21
(4), 313-326.Lee, H. J. (2013, December 3). Korean Students Achieved Higher, but Interest Level Lower. Newsis.
Retrieved on February 15, 2014 at http://www.
newsis.com/ar_detail/view.html?ar_id=NISX2013 1203_0012561876&cID=10201&pID=10200.
Lee, H. S., Choi, K. H, Lee, J. K., Ma, K. H., & Lee, K. S. (2005). Study on the Secondary School Students' Perception on Scientist and Woman Scientist as Career and Its Role Model.
Journal of the Korean Association for Research in Science Education 25
(2), 184-196.Lee, K. H., Lee, E. J., & Paik, S. H. (2010).
Discovering the Potential of Gifted Females in Mathematics, International Perspectives on Gender and Mathematics Education
. In Forgasz, H.J., Becker J. R., & Lee, K. H. (Eds.).Leung, F. K. S., Graf, K-D., & Lopez-Real, F. J.
(2006).
Mathematics Education in Different Cultural Traditions - A Comparative Study of East Asia and the West
. The 13th ICMI Study (New ICMI Study Series), New York: Springer, 22-26.Mullis, I. V. S., Martin, M. O., & Foy, P. (2008).
TIMSS 2007 International Results in Mathematics.
Chestnut Hill, MA: International Association for the Evaluation of Educational Achievement. V. S., &
Chrostowski, S. J. (Eds.).
Mullis, I. V. S., Martin, M. O., Foy, P., & Alka A.
(2012).
TIMSS 2011 International Results in Mathematics
. Chestnut Hill, MA: International Association for the Evaluation of Educational Achievement.Mullis, I. V. S., Martin, M. O., Gonzalez, E. J., &
Chrostowski, S. J. (2004).
TIMSS 2003 International Mathematics Report.
Chestnut Hill,MA: TIMSS & PIRLS International Study Center, Lynch School of Education, Boston College.
Mullis, I. V. S., Martin, M. O., Gonzalez, E. J., Gregory, K. D., & Garden, R. A. (2000).
TIMSS 1999 International Mathematics Report.
Chestnut Hill, MA: TIMSS & PIRLS International Study Center, Lynch School of Education, Boston College.Organization of Economic Co-Operation and Development (OECD). (2014). PISA 2012 Results in Focus - What 15-year-olds know and what they can do with what they know. Retrieved from http://www.oecd.org/pisa/keyfindings/pisa-2012-resul ts-overview.pdf
O'Connor-Petruso, S.A. & K. Miranda. (2004). Gender Inequities Among the Top Scoring Nations- Singapore, Republic of Korea and Chinese Taipei-in Mathematics Achievement From the TIMSS-R Study.
Proceedings of the IRC-2004 TIMSS 2,
31-46. Paper presented at the International Research Conference: Cyprus.Park, M. R. (2006).
Analysis of differences in middle school students' attitudes towards mathematics and their mathematical achievement according to the mathematics teachers' efficacy
(Masters Dissertation, Pukyoung National University Graduate School of Education).Southwest Educational Development Laboratory (SEDL). (2010, Spring/Summer). Research Update Encouraging Girls in Math and Science.
SEDL Letter, Volume XXII, Number 1
, 12:13.Shen, C., & Tam, H. P. (2008). The paradoxical relationship between student achievement and self-view: A cross-national analysis based on three waves of TIMSS data.
Educational Research and Evaluation 14,
87-100.Shin, Y. W. (2012).
A Study on the Factors Causing
the Gender Difference in Mathematics Achievement
- Based on the PISA 2003 Results,
(Master Dissertation, Kyung Hee University).Sohn, B. E., & Go, H. K. (2012). Suggestions on the instructional activities relevant to the area of Probability and Statistics based on the result of TIMSS and PISA Items,
Journal of the Korean School Mathematics 15
(1), 109-135.TIMSS 2011 International Database. (2013). Retrieved on June 15, 2013 at http://timssandpirls.bc.edu/
timss2011/international-database.html.
Whang, M. H. (2006). The Effects of the Social Relationships on the Academic Achievement of Korean Students.
Asian Journal of Education 7
(3), 187-203.No.
TIMSS Variable
Name
TIMSS Student Questionnaire Items
1 BSBG11A HOW OFTEN PARENTS ASK ABOUT WHAT YOU LEARNED IN SCHOOL 2 BSBG11B HOW OFTEN TALKING ABOUT SCHOOLWORK WITH PARENTS
3 BSBG11C HOW OFTEN PARENTS MAKE SURE TIME IS SET ASIDE FOR HOMEWORK 4 BSBG11D HOW OFTEN PARENTS CHECK IF YOU DO YOUR HOMEWORK
5 BSBM15A HOW MUCH DO YOU KNOW WHAT TEACHER EXPECTS YOU TO DO 6 BSBM15B THINK OF THINGS NOT RELATED TO LESSON
7 BSBM15C TEACHER IS EASY TO UNDERSTAND 8 BSBM15D INTERESTED IN WHAT TEACHER SAYS 9 BSBM15E TEACHER GIVES INTERESTING THINGS TO DO 10 BSBG12A LIKE BEING IN SCHOOL
11 BSBG12B FEEL SAFE AT SCHOOL
12 BSBG12C FEEL LIKE BELONG AT SCHOOL 13 BSBM14A ENJOY LEARNING MATHEMATICS
14 BSBM14B WISH HAVE NOT TO STUDY MATHEMATICS 15 BSBM14C MATHEMATICS IS BORING
16 BSBM14D LEARN INTERESTING THINGS 17 BSBM14E LIKE MATHEMATICS
18 BSBM14F IMPORTANT TO DO WELL IN MATHEMATICS 19 BSBM16J MATHEMATICS WILL HELP ME
20 BSBM16K NEED MATHEMATICS TO LEARN OTHER THINGS 21 BSBM16L NEED MATHEMATICS TO GET INTO <UNIVERSITY>
22 BSBM16M NEED MATHEMATICS TO GET THE JOB I WANT 23 BSBM16N LIKE JOB INVOLVING MATHEMATICS
24 BSBM16A USUALLY DO WELL IN MATHEMATICS 25 BSBM16B MATHEMATICS IS MORE DIFFICULT 26 BSBM16C MATHEMATICS NOT MY STRENGTH 27 BSBM16D LEARN QUICKLY IN MATHEMATICS
28 BSBM16E MATHEMATICS MAKES ME CONFUSED AND NERVOUS 29 BSBM16F GOOD AT WORKING OUT PROBLEMS
30 BSBM16G TEACHER THINKS I CAN DO WELL IN MATHEMATICS 31 BSBM16H TEACHER TELLS ME I AM GOOD AT MATHEMATICS 32 BSBM16I MATHEMATICS IS HARDER FOR ME
Appendix: TIMSS 2011 Student Questionnaire Items
사회문화적 요인들이 수학학습태도와 수학성취도의 성별차이에 미치는 영향: TIMSS 2011를 중심으로
유양석
★Kookmin University E-mail : [email protected]
우리나라 중학교 2학년 학생들은 TIMSS와 같은 국제적인 평가에서 높은 수학 성취도를 보이고 있다. 성별 성 취도를 분석하면 TIMSS 1995부터 TIMSS 2011까지 남학생이 여학생보다 지속적으로 높은 평균점수를 받고 있다.
TIMSS 1995와 TIMSS 2011의 성별 점수 차이는 유의한 것으로 나타났다. TIMSS 2011에 참가한 42개국 중 성차 가 없거나 여학생이 더 높은 성취도를 보인 국가는 35개국이며 남학생이 더 높은 성취도를 보인 국가는 우리나라 를 포함하여 7개국이다. 수학 성취도의 성차는 사회문화적 요인과 수학학습태도와 연관이 있다는 여러 연구 결과 가 있다. 본 연구는 TIMSS 2011에 참가한 중2학년 5,165명 남녀학생들의 수학성취도 결과를 분석하여 사회문화적 요인이 수학학습태도와 수학성취도에 미치는 영향을 찾아보았다. 연구결과 남녀학생의 교사선호도는 유의한 성차 가 없었는데 학부모의 교육 참여도에 유의한 성차가 있었다. 여학생의 수학에 관한 가치와 수학에 관한 자신감은 남학생보다 유의하게 낮았다. 학부모의 교육 참여도는 여학생의 수학학습태도와 수학성취도에 더 높은 영향력을 미치는 것으로 나타났다. 학부모들의 교육 참여도를 높이고 여학생들의 수학에 관한 가치와 자신감을 높이기 위해 서는 여학생들의 롤 모델과 여성들의 과학 분야의 진출을 장려하는 사회적 요인의 조성이 함께 필요하다.
* ZDM 분류 : A73
* MSC 2000 분류 : 97C60
* Key Words : 성차, TIMSS 수학성취도, 사회·문화적요인, 수 학태도, 수학교육과정