Progress in Superconductivity and Cryogenics
Vol.15, No.2, (2013), pp.16~19 http://dx.doi.org/10.9714/psac.2013.15.2.016
```
1. INTRODUCTION
The discovery of iron based superconductors in 2008 has stimulated giant attention in the physics community [1-13]
and brought about the active investigation of the new superconducting materials for the better superconducting properties. Like the role of the CuO
2layer in the high temperature cuprate superconductors, the superconductivity in these superconductors is presumed to take place in the FeAs layer.
The pairing mechanism has been explained based on the multi-band structure created by a spin wave order, called extended s± model in which the sign changing order parameter between the different Fermi surfaces is considered [14]. However, the role of the electron-phonon effects or orbital fulcutation effects have been actively discussed [15, 16]. In this sense, there is no definite consensus yet as to the origin of the superconductivity in the Fe-based superconductors.
Random point defect (or Random potential effect) is found to play an important role in determination of physical properties of superconductors. Disorder pins the vortex lines and destroies the translational long-range ordering of the vortex flux lattice. In the presence of random pinning centers, the existence of the second-order phase transition from a vortex liquid to a vortex glass state has been predicted [17]. In the vortex glass (VG) phase, resistivity is expected to vanish at a small current level in contrast to the flux creep model, which shows a linearly varying resistivity at low current densities. The existence of the vortex glass phase has been proven in the cuprate superconductors [18], MgB
2[19] and YNi
2B
2C [20]. However, up to now, the vortex glass phase transition in a single crystal form in the iron based superconductors has not been investigated
Existence of a vortex-glass phase transition in an optimally doped BaFe 1.8 Co 0.2 As 2 single crystal
Ki-Young Choi* and Kee Hoon Kim
CeNSCMR, Department of Physics and Astronomy, Seoul National University, Seoul, Korea (Received 17 June 2013; revised or reviewed 29 June 2013; accepted 30 June 2013)
Abstract
The magneto-resistivity and electric field-current density (E-J) curves were investigated up to a magnetic field 9 T in the optimally doped BaFe1.8Co0.2As2 single crystal with a superconducting temperature (Tc)of 24.6 K. The E-J Scaling behaviors below and above vortex glass transition temperature (Tg) were found, confirming the existence of the vortex glass phase transition. The critical exponents for the diverging spatial and time correlations at Tg, were obtained as ν = 1.1 ± 0.1 and z = 4.5 ± 0.3, respectively.
The obtained critical exponents are in good agreement with the predicted values of ν ~ 1 – 2 and z > 4 within the 3D vortex glass theory.
Keywords : Magneto-resistivity, Vortex glass theory, Iron-based superconductor
* Corresponding author: [email protected]
except for the under-doped (Ba,K)Fe
2As
2[21] and SmFeAsO
0.85[22] superconductor.
Collective pinning theory proposed by the Larkin-Ovchinikov [23] shows that a long range order of the regular flux lattice line (FLL) is destroyed beyond a correlation volume as long as pinning centers are present.
In this absense of the FLL, there could be two kinds of the vortex phase; one is vortex liquid and the other is vortex glass phase. Then, the question arises whether there still exists a clear phase transition between the vortex glass and the vortex liquid phase with a transition temperature, T
g, or it is just a crossover between two phases. If it is a phase transition, T
gwill divide the two phases of zero and non-zero resistance in a low dissipation region.
Theoretically, possible existence of the vortex glass phase transition was extensively discussed by Fisher et al. [17].
Their assumption was based on the scaling argument in which two correlations exist, one is spatial correlation and the other is temporal correlation upon approaching T
g. The divergence of the spatical correlation length
~
νξ T T −
g −is defined with the critical exponent ν while correlation time is associated with the critical exponent z in such a way that τ ~ ξ
z. By using a dimensional analysis of the electric field and current, Fisher et al. proposed the scaling hyposis for the 3D superconductor as follows;
( )
( 1) 2
/
g z/
gE j T T −
ν −= F j T T
±−
ν(1)
, where z and ν are dynamic and static vortex glass exponents,
respectively. F
+and F
-are scaling functions above and below
the vortex glass transition temperature. Beside to this, near
at the VG transition temperature, this theory predict that the
resistivitance, R vanish with a power law scaling behavior
Ki-Young Choi and Kee Hoon Kim
( )
( 1)~
g zR T T −
ν −(2) From above scaling functions of Eq. (1) and Eq. (2), critical exponent ν and z can be determined.
In this study, we present the magneto-resistivity and E-J characteristics of the optimally doped BaFe
1.8Co
0.2As
2single crystal in the applied field H up to 9 T. The results show critical scaling behavior predicted by the theory of the vortex glass phase transition at the all field regions. Within experimental errors, the values of critical exponents and scaling functions show the universal behavior. We also present the vortex phase diagram and critical current density from the M-H loop of this single crystal.
2. EXPERIMENTS
The single crystals BaFe
2-xCo
xAs
2with various Co contents were grown by the high-temperature self flux method. The detailed procedure of crystal growth is described in Ref. [24]. Among these, optimally doped BaFe
1.8Co
0.2As
2single crystal was chosen to study the vortex glass phase transition. The dimension of the single crystal was 1.2 mm × 2.0 mm × 0.05 mm. The onset resistive transition temperature, was 24.6 K. The several crystals with a platelike shape were used in these measurements. The four probe configuration was used to measure the magneto-resistivity and E-J characteristics for magnetic field up to 9 T parallel to the c-axis. For the fine measurement of the E-J curves, the temperature interval were chosen to be 0.1 K.
3. RESULTS AND DISCUSSION
Fig.1 shows the resistivity of BaFe
1.8Co
0.2As
2single crystal in various magnetic fields up to 9 T. The transition temperature of 24.6 K for H = 0 was obtained from ρ(T
c) = 0.9 ρ
25K. The residual resistivity was 500 µOhm-cm and sharp ΔT
c= 0.8 K between 0.1 and 0.9 ρ
n(normal resistivity) in the ρ-T curve indicates that the quality of the single crystal is high. The residual resistivity ratio ρ(300 K)/ρ(25 K) was found to be 2 which is lower than 2.7 of the (Ba,K)Fe
2As
2 single crystal [21].Fig. 1. The resistivity of the BaFe
1.8Co
0.2As
2single crystal under applied magnetic field up to 9 T.
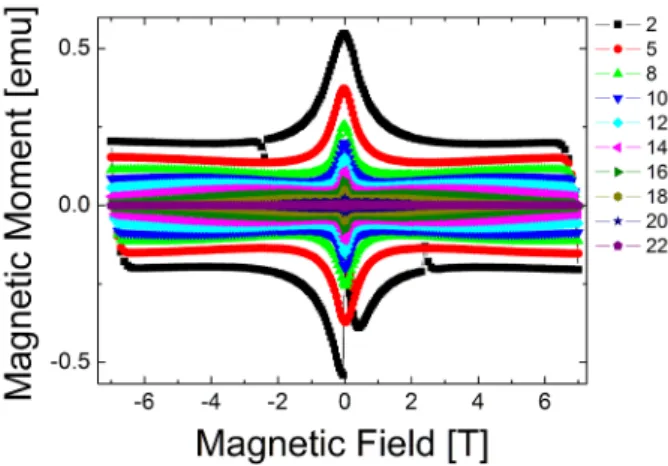
Fig. 2. The magnetic hysteresis curves of the BaFe
1.8Co
0.2As
2single crystal for magnetic field up to 7 T parallel to the c-axis in the temperature range from 2 K to 22 K.
Fig. 3. The critical current density (J
c) estimated from the M-H curves at various temperatures by using the Bean’s critical state model [26].
Fig. 2 shows the magnetic hysteresis curves for fields up to 7 T for temperatures above 2 K. Even for the highest field of 7 T, the magnetic field is not high enough to obtain the full hysteresis curves. The observed M-H loop is very symmetrical which indicates that bulk pinning is very strong and Bean-Livingston surface barrier for this superconductor is negligible [25]. From this high bulk pinning behavior, we expect to have the existence of the vortex glass phase transition.
Fig. 3 shows the critical current density (J
c) estimated from the M-H curves for various temperature by using the Bean’s critical state model [26] (J
c= 20 ΔM/ [w(1-w/l)]) in which ΔM, w and l are the height of the magnetization loop, the length and width of the sample, respectively. For the zero external field and T = 2 K, J
cwas 1.5 x 10
7A/cm
2. This value J
cis quite high and even higher than 4.7 x 10
6A/cm
2and 1 x 10
3A/cm
2of the single crystals form of (Ba,K)Fe
2As
2[27] and LiFeAs [28], respectively.
In the first quadrant of the M-H curve at 2 K, magnetization decreases with the increase of the external magnetic field, which is a typical behavior of a type II- superconductor. However, this behavior is changed for
17
Existence of a vortex-glass phase transition in an optimally doped BaFe1.8Co0.2As2 single crystal
Fig. 4. The electric field and current density E-J curves in the range T = 15.9 – 18.0 K with a 0.1 K step under H = 9 T.
temperature above 5 K and a peak developed at H
p. Magnetization increases below H
pbut decreases again above H
pas H increase. This peak effect was observed, e.g., in the case of BSCCO single crystals and is called as the fish tail effect, which is associated with the change of the vortex matter from 2D pancake to 3D line vortex [29].
However, this may not be the case in our BaFe
1.8Co
0.2As
2single crystals, because the large ξ
c, larger than the c-axis lattice constant, induces the 3D superconductivity and blocks the formation of the 2D pancake vortex. The origin of this peak in the BaFe
1.8Co
0.2As
2superconductor is still yet to be understood.
To check whether the vortex glass phase transition exists or not, we measured the V-I curves at various temperatures for the field range of 1-9 T and converted into the electric field-current density (E-J) curves after considering the sample dimension. The current was swept from zero to 5 × 10
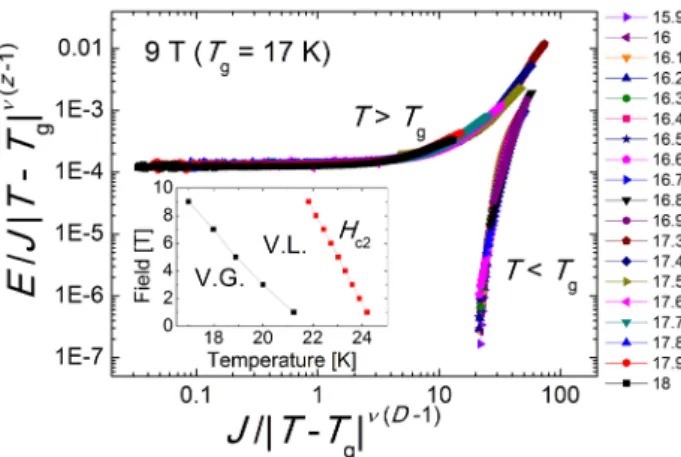
-2A during this measurement. In Fig. 4, we showed the E-J graph at H = 9 T. The best fit for the 3-D scaling behavior is shown in Fig. 5.
The measured E-J curves are rather similar to that of the YBCO single crystals [18] and MgB
2thin films [19]. It is clear that as temperature goes below the some particular value, the E-J curves show the positive curvature which indicate that resistivity does not go into zero at low current limit. However, for the temperature below this value, E-J shows the positive curvature and eventually goes to the zero resistivity region at a low current limit. The temperature which distingushes the positive and negative curvature is a vortex glass transiton temperature, T
g, if vortex glass phase transition exists. Assuming a second order vortex glass phase transition, the experimental E-J curves were scaled with a different scaling form as presented in (1) for T < T
gand T > T
g, respectively. These E-J scaling were used to determine the values of z, ν and T
g. For the best fit, these values were varied in a narrow range to optimize the universal scaling law for each set of magnetic field. For the 9 T case, the vortex galss transition were T
g= 17.0 ± 0.2 K, and critical exponents were ν = 1.1
± 0.1 and z = 4.5 ± 0.3, respectively. The obtained critical exponents are indeed in good agreement with the predicted values of ν ~ 1–2 and z > 4 within the 3D vortex glass theory [17].
Fig. 5. The best fit for the scaling. Inset shows the H
c2and T
gin H-T diagram.
The existence of the vortex glass transition was additionally examined by the predicted scaling law of R ~ (T-T
g)
ν(z-1)near T
gas shown in Fig. 6. As expected, R clearly vanished near T
g. The three parameters ( ν , z and T
g) are consistent with the values obtained already from the E-J scaling. The ν (z-1) from the resistivity were 3.3 ± 0.2, which is within the expected range of 3.8 ± 0.4 from the E-J scaling. For the rest of the magnetic field, we also analyzed the E-J and R-T scaling behavior and found that the vortex glass theory works quite well with the critical exponents ν = 1.1 ± 0.1 and z = 4.5 ± 0.5 being quite similar to those at 9 T.
And T
gs are 21.2, 20.0, 18.9 and 18.0 K for 1 T, 3 T, 5 T, and 7 T of the magnetic fields, respectively. The inset of the Fig. 5. shows the phase diagram revealing the VG to VL transition.
Those values were also within the range of the predicted values from the 3D vortex glass phase transition [17]. Since ξ
c(T) > ξ
c(0) near T
cand ξ
c(0) is larger than that for a c-axis lattice constant of 1.298 nm [30], and the distance 0.65 nm between two FeAs layers, it is quite natural to expect the 3D transition.
For the comparison with other superconductors, we note that the critical exponents z = 4.3 ± 1.5 and ν = 2 ± 1 were found in the YBCO single crystal [18]. The values were z =
Fig. 6. R as a function of temperature. This graph shows the vanishing of the ohmic resistivity near at T
g.
18
Ki-Young Choi and Kee Hoon Kim
4.3 ± 0.1 and ν =1.0 ± 0.1 for MgB
2thin films [19], z = 5.46
± 0.32 and ν = 1.23 ± 0.02 for YNi
2B
2C single crystals [20], z = 4.1 ± 0.2 and ν = 1.0 for the under-doped single crystals of (Ba,K)Fe
2As
2[21], and z = 3.4–4.8 and ν = 1–1.7 for SmFeAsO
0.85single crystals[22]. Our z and ν values seem to be a little smaller than those of YNi
2B
2C but are very similar to the values of the thin MgB
2film and of the under-doped (Ba, K)Fe
2As
2and SmFeAsO
0.85single crystals.
4. CONCLUSION
In conclusion, the magneto-resistivity and the E-J curves were measured under magnetic fields up to 9 T for the optimally doped BaFe
1.8Co
0.2As
2single crystal with T
c= 24.6 K . Scaling behavior of R-T and E-J below and above T
gconfirmed the existence of the vortex glass phase transition as predicted by the theory proposed by Fisher et al. [17]. The analysis at different magnetic fields up to 9 T showed almost the same values of critical exponents ν and z consistent with the 3D voltex glass phase transition. The critical current density J
c= 1.5 × 10
7A/cm
2at 2 K estimated from the M-H curves by using the Bean’s critical state model indicates that the pinning strength is quite strong even in the single crystalline form of this superconductor.
ACKNOWLEDGMENT
This work was financially supported by the Basic Science Research Program (Grant No. 2012-008233) funded by the Korean Federation of Science and Technology Societies and the National Creative Research Initiative (Grant No. 2010-0018300) through the National Research Foundation of Korea funded by the Ministry of Education, Science and Technology.
REFERENCES
[1] Y. Kamihara, T. Watanabe, M. Hirano, and H. Hosono, J. Am.
Chem. Soc., vol. 130, pp. 3296, 2008.
[2] X. H. Chen, T. Wu, G. Wu. R. H. Liu, H. Chen, and D. F. Fang, Nature, vol. 453, pp. 761, 2008.
[3] G. F. Chen, Z. Li, D. Wu, G. Li, W. Z. Hu, J. Dong, P. Zheng, J. L.
Luo, and N. L. Wang, Phys. Rev. Lett., vol. 100, pp. 247002, 2008.
[4] Z. A.. Ren, J. Yang, W. Lu, W. Yi, X. L. Shen, Z. C. Li, G. C. Che, X. L. Dong, L. L. Sun, F. Zhou, and Z. X. Zhao, Europhys. Lett., vol.
82, pp. 57002, 2008.
[5] Z. A. Ren, J. Yang, W. Lu, W. Yi, G. C. Che, X. L. Dong, L. L. Sun, and Z. X. Zhao, Mater. Res. Innov., vol. 12, pp. 105, 2008.
[6] J. Yang, Z. C. Li, W. Lu, W. Yi, X. L. Shen, Z. A. Ren, G. C. Che, X.
L. Dong, L. L. Sun, F. Zhou, and Z. X. Zhao, Supercond. Sci.
Technol., vol. 21, pp. 082001, 2008.
[7] J. A. Rodgers, G. Penny, A. Marcinkova, J. Bos, D. Sokolov, A.
Kusmartseva, A. Huxley, and J. Attfield, Phys. Rev. B, vol. 80, pp.
052508, 2009.
[8] Z.-A. Ren, W. Lu, J. Yang, W. Yi, X.-L. Shen, Z.-C Li, G.-C. Che, X.-L. Dong, L.-L. Sun, F. Zhou and Z.-X. Zhao, Chin. Phys. Lett., vol. 25, pp. 2215, 2008.
[9] P. Cheng, B. Shen, G. Mu, X. Zhu, F. Han, B. Zeng, and H. H. Wen, Europhys. Lett., vol. 85, pp. 67003, 2009.
[10] M. Rotter, M. Tegel, and D. Johrendt, Phys. Rev. Lett., vol. 101, pp.
107006, 2008.
[11] A. S. Sefat, R. Jin, M. A. McGuire, B. C. Sales, D. J. Singh, and D.
Mandrus, Phys. Rev. Lett., vol. 101, pp. 117004, 2008.
[12] K. Sasmal, B. Lv, B. Lorenz, A. M. Guloy, F. Chen, Y. Y. Xue, and C. W. Chu, Phys. Rev. Lett., vol. 101, pp. 107007, 2008.
[13] J. H. Tapp, Z. Tang, B. Lv, K. Sasmal, B. Lorenz, P. C. W. Chu, and A. M. Guloy, Phys. Rev. B, vol. 78, pp. 060505, 2008.
[14] I. I. Mazin, D. J. Singh, M. D. Johannes, and M. H. Du, Phys. Rev.
Lett., vol. 101, pp. 057003, 2008.
[15] R. H. Liu, T. Wu, G. Wu, H. Chen, X. F. Wang, Y. L. Xie, J. J. Ying, Y. J. Yan, Q. J. Li, B. C. Shi, W. S. Chu, Z. Y. Wu, and X. H. Chen, Nature, vol. 459, pp. 64, 2009.
[16] P. M. Shirage, K. Kihou, K. Miyazawa, C.-H. Lee, H..Kito, H.
Eisaki, T. Yanagisawa, Y. Tanaka, and A. Iyo, Phys. Rev. Lett., vol.
103, pp. 257003, 2009.
[17] D. S. Fisher, M. P. A.. Fisher, and D. A. Huse, Phys. Rev. B, vol. 43, pp. 130, 1991.
[18] P. L. Gammel, L. F. Schneemeyer, and D. J. Bishop, Phys. Rev. Lett., vol. 66, pp. 953, 1991.
[19] S. K. Gupta, S. Sen, A. Singh, D. K. Aswal, J. V. Yakhmi, E.-M.
Choi, H.-J. Kim, K. H. P. Kim, S. Choi, H.-S. Lee, W. N. Kang, and S.-I. Lee, Phys. Rev. B, vol. 66, pp. 104525, 2002.
[20] M.-O. Moon, S.-I. Lee, W. C. Lee, P. C. Canfield, B. K. Cho, and D.
C. Johnston, Phys. Rev. Lett., vol. 76, pp. 2790, 1996.
[21] H. J. Kim, Y. Liu, Y. S. Oh, S. Khim, I. Kim, G. R. Stewart, and K.
H. Kim, Phys. Rev. B, vol. 79, pp. 014514, 2009.
[22] H.-S. Lee, M. Bartkowiak, J. S. Kim, and H.-J. Lee, Phys. Rev. B, vol. 82, pp. 104523, 2010.
[23] A.I. Larkin and Yu.N. Ovchinikov, J. Low Temp. Phys., vol. 34, pp.
409, 1979.
[24] S. H. Kim, C. H. Choi, M.-H. Jung, J.-B. Yoon, Y.-H. Jo, X. F.
Wang, X. H. Chen, X. L. Wang, S.-I. Lee, and K.-Y. Choi, J. Appl.
Phys., vol. 108, pp. 063916, 2010.
[25] C. P. Bean and J. D. Livingston, Phys. Rev. Lett., vol. 12, pp. 14, 1964.
[26] C. P. Bean, Rev. Mod. Phys., vol. 36, pp. 31, 1964.
[27] H. Yang, H. Luo, Z. Wang, and H.-H. Wen, Appl. Phys. Lett., vol.
93, pp. 142506, 2008.
[28] Y. J. Song, J. S. Ghim, B. H. Min, Y. S. Kwon, M. H. Jung, and J.-S.
Rhyee, Appl. Phys. Lett., vol. 96, pp. 212508, 2010.
[29] Y. Yeshurun, N. Bontemps, L. Bulachkov, and A. Kapitulnik, Phys.
Rev. B, vol. 49, pp. 1548, 1994.
[30] Q. Huang, Y. Qiu, W. Bao, M. A. Green, J. W. Lynn, Y. C.
Gasparovic, T. Wu, G. Wu, and X. H. Chen, Phys. Rev. Lett., vol.
101, pp. 257003, 2008.