Journal ofthe Korean Chemical Society 2016, Vol.60, No. 5
Printed in theRepublicof Korea
http://dx.doi.Org/10.5012/jkcs.2016.60.5.317
Surface Modification of Silica Spheres for Copper Removal
Byoung-Ju KimL Eun-Hye Park * , and Kwang-Sun Kang%*
^Department of New and Renewable Energy, Gyeongbuk 38428, Korea. ^E-mail: kkang@kiu. ac. kr
^Dasomddeul, Gyeongbuk 38428, Korea.
(Received January 5, 2016; Accepted August 4, 2016)
ABSTRACT.
Efficient copper removal from water was achieved by using surface modified silica spheres with 3-mercapto- propyltrimethoxysilane (MPTMS) using base catalyst. The surface modification of silica spheres was performed by hydrolysis and condensation reactions of the MPTMS. The characteristic infrared absorption peaks at 2929, 1454, and 1343 cm
-1 represent the -CH
2stretching vibration, asymmetric deformation, and deformation, respectively. The absorption peaks at 2580 and 693 cm
-1 corresponding the -SH stretching vibration and the C-S stretching vibration indicate the incorporation of MPTMS to the surface of silica spheres. Field emission scanning electron microscope (FESEM) image of the surface modified silica sphere (SMSS) shows nano-particles of MPTMS on the surface of silica spheres. High concentration of copper solution (1000 ppm) was used to test the copper removal efficiency and uptake capacity. The FESEM image of SMSS treated with the copper solu
tion shows large number of copper lumps on the surface of SMSS. The copper concentration drastically decreased with increasing the amount of SMSS. The residual copper concentrations were analyzed using inductively coupled plasma mass spectrometer. The copper removal efficiency and uptake capacity with 1000 ppm of copper solution were 99.99 % and 125 mg/g, respectively.
Key words:
Silica spheres, Copper removal, Removal efficiency, Uptake capacity, MPTMS
INTRODUCTION
Heavy metals are stable and persistent environmental contaminants in water and soil. Although some heavy metals including Zn, Cu, Fe, and Mn are required for met
abolic activity in organisms, but more than required amounts of the elements become toxic. The other heavy metals along with Cd, Hg, Cr, and Pb exhibit extremely toxic even low level of concentration under certain conditions.
1There
fore, regular monitoring of these toxic elements in aquatic environment is required. Wastewaters containing copper are generated by mining activities and industries engaging in petroleum refining, metal plating, battery manufacturing, printing, paint production, pigment production, and pes
ticide production.
2Copper does not degrade in the environment and accumulates in plant and animal tissues resulting in serious health problems to humans. It is also identified as a causing element for Alzheimer’s disease. Many research efforts were focused on removal of copper ions from the soil and the water system. Large numbers of technologies including chemical precipitation,
3ion exchange,
4membrane filtration,
5flotation,
6electrochemical treatment,
7coagulation,
8flocculation,
9and adsorption
10have been practiced to ensure the environmental safety against Cu
2+in the industrial effluents. Each technology has its own advantages and draw
backs. For efficient Cu
2+removal from the wastewater,
bioadsorption is a recently devised technology and is under testing phase with various bioadrotbents for the removal of heavy metals. A number of natural and synthetic adsor
bents like moss,
11natural mineral sorbents,
12aspergillus niger,
13coconut bagasse,
14oil shale,
15and a barley by-prod
uct from the whisky distilling process.
16Most of the case, the removal efficiency is approximately in between 67 95% and drastically reduced with the increase of the cop
per concentration.
1,2,17In this paper, we report the process of the surface modification of silica spheres using 3-mer- captopropyltrimethoxysilane (MPTMS) with base catalysts and high removal efficiency of Cu
2+with high concentration of Cu
2+. Field emission scanning electron microscope (FESEM) images of bare silica spheres, surface modified spheres, and surface modified spheres treated with Cu
2+solution were also included in this report.
EXPERIMENTAL
A mixture of 2-propanol (100 ml) and ammonium hydrox
ide (100 ml) was used as a solvent and catalyst, respectively, and charged to a 250 ml round bottom flask. Tetraethoxy orthosilicate (TEOS, 4.0 g) was added to the mixture solu
tion with vigorous stirring for 6 h, and then MPTMS (1 g) was added to the solution. The solution was sampled after 0.5, 1.5, 4.5 and 26 h for FTIR measurement. After 26 h
-317-
318 Byoung-Ju Kim, Eun-HyePark, and Kwang-Sun Kang
stirring at room temperature, the resulting spheres were centrifuged to separate the spheres from the solution and washed with methanol three times. The spheres were dried in a drying oven for one day. Relatively high concentration of copper solution (1000 ppm) was prepared. The 5 vials contained with 10 ml of copper solution were prepared, and 10, 20, 40, 60, and 80 mg of surface modified spheres were added to the vials. The vials were sonicated for 10 min to disperse the spheres, were stirred for 5 min, and then were centrifuged to separate the solution and the spheres.
FTIR spectra of surface modified silica spheres were obtained using Nicolet iS5 FTIR spectrometer. Field emission scan
ning electron microscope (FESEM) images of bare silica spheres, surface modified spheres, and surface modified spheres after treatment of copper solution were obtained with JEOL ISM-7401F field emission scanning electron microscope. The residual copper concentrations were ana
lyzed with inductively coupled plasma mass spectrometry (ICP-MS, Varian 820MS).
RESULTS AND DISCUSSION
Peptide-polysaccharide-resembling structure with 2.2% of mercapto group was utilized for heavy-metal removal.
18Mercaptoacetyl chitosan was applied to remove Cu
2+and turbidity from the wastewater.
19Nano-sized spherical shape has largest surface area compared with the other shapes. It is interesting to attach functional groups to the surface of the nano-sized spheres to remove heavy-metals from waste
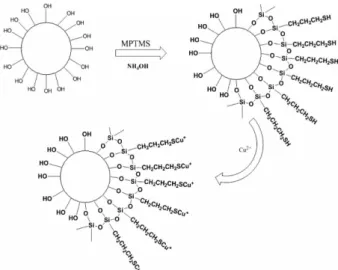
water, to filter organic materials and to use catalyst. Fig. 1 shows the graphical representation of surface modifica-
Figure 1. The graphical representation of surface modification of silica spheres and copper uptake process.
tion and copper removal process using surface modified silica spheres. The MPTMS molecules were attached to the surface of silica spheres using NH
4OH catalyst. The mer
capto-group of the MPTMS works as an active functional
Figure 2. (a) Chemical structure of MPTMS, (b) FTIR spectrum of MPTMS, (c) FTIR spectrum of pure silica spheres, and (d) FTIR spectra of surface modified silica spheres reacted for 0.5, 1.5, 4.5, and 26 h with MPTMS.
Journal oftheKorean ChemicalSociety
Surface Modificationof Silica Spheres forCopper Removal 319
group for copper removal.
An MPTMS has three methoxy groups, which are fac- ilely hydrolyzed with acid or base and one mercaptopropyl group, which acts as a main functional group. Approxi
mately 30 ml of reaction solution was taken from the batch solution after 0.5, 1.5, 4.58, and 26 h reaction and centrifuged to separate the modified silica spheres. The spheres were washed three times with methanol and dropped to a KBr plate to take FTIR spectrum. The chemical structure and FTIR spectrum of MPTMS are shown in Fig. 2(a) and 2 (b), respectively. FTIR spectrum of pure silica spheres is shown in Fig. 2(c). The MPTMS is directly added to the Stober synthetic solution and sampled after 0.5, 1.5, 4.5, and 26 h. The FTIR spectra of the surface modified silica spheres are shown in Fig. 2(d). For the 26 h sample spec
trum, characteristic new peaks at 2929, 1454, and 1343 cm
-1representing the -CH 2 stretching vibration, asymmetric deformation, and deformation, respectively are appeared.
Very small peak at 2580 cm
-1caused by -SH stretching vibra
tion is also appeared. The peak at 693 cm
-1represents the C-S stretching vibration. Small peaks at 1454 and 693 cm
-1are appeared for 4.5 h sample, which indicate that the some amount of MPTMS molecules are attached to silica spheres after 4.5 h reaction at room temperature.
Surface modification with certain materials can be directly proved with scanning electron microscope image. Figs. 3(a), 3(b), and 3(c) show the FESEM images of pure silica spheres, surface modified silica spheres with MPTMS, and surface modified silica spheres treated with copper solution, respec
tively. Bare silica spheres have very smooth surface as shown in Fig. 3(a). However, surface modified spheres show rough
Table 1. EDS result for pure silica spheres
Element Weight % Atomic %
O, K 49.59 63.33
Si, K 50.41 36.67
Total 100.00 100.00
Table 2. EDS result for surface modified silica spheres with MPTMS
Element Weight % Atomic %
O, K 37.57 51.92
Si, K 51.64 40.65
S, K 10.78 7.43
Total 100.00 100.00
Table 3. EDS result for surface modified silica spheres treated with Cu2+
Element Weight % Atomic %
O, K 51.98 67.50
Si, K 35.05 25.93
S, K 7.26 4.70
Cu, K 5.71 1.87
Total 100.00 100.00
surface pattern as shown in Fig. 3(b). Fig. 3(c) shows large number of Cu particles on the surface of the spheres, which implies that the copper ions are not only attached individually but also aggregated on the mercaptan groups.
The energy dispersive X-ray spectroscopy (EDS) result data for the pure silica spheres, surface modified spheres with MPTMS, and surface modified spheres treated with Cu
2+solution were in Table 1, 2, and 3, respectively. The surface modified spheres with MPTMS show approxi
mately 10.78 wt % as shown in Table 2. The amount of
(Edd)u 은
으
u a)
으」。
u n o
200 -fl-
1000 - 800 - 600 - 400 -
10 30 50 70
Amount of Silica Spheres (mg)
Figure 4. Residual copper concentration after treated with 10, 20, 40, 60, and 80 mg of surface modified silica spheres.
Figure 3. FESEM images of (a) bare silica spheres, (b) surface modified silica spheres with MPTMS, and (c) surface modified silica spheres after treatment with copper solution.
2016,Vol. 60,No. 5
320 Byoung-Ju Kim, Eun-HyePark, and Kwang-SunKang
copper was approximately 5.71 wt %.
Initially, high copper concentration (1000 ppm) was uti
lized due to the high ratio of copper uptake was expected.
Fig. 4 shows copper concentration after treating 10, 20, 40, 60, and 80 mg of surface modified silica sphere. The copper concentration reduced from 1000 mg/L to 0.075 mg/L after treatment of 80 mg of surface modified silica spheres, which indicated that the removal efficiency was 99.99% with high copper concentration. The copper uptake capacity is approximately 125 mg/g.
CONCLUSION
The surface of silica spheres was modified using MPTMS with base catalyst to remove copper ions from the wastewater.
The FTIR result shows large amount of MPTMS mole
cules are attached to the surface of silica spheres after 26 h reaction at room temperature. Although the surface of bare silica sphere was very smooth, the surface of modified silica spheres was rough. The copper ions are aggregated on the surface of the surface modified spheres. Copper uptake efficiency and capacity are 99.99% and 125 mg/g, respec
tively.
Acknowledgments. Publication cost of this article was
supported by the Korean Chemical Society.
REFERENCES
1. Dundar, M.; Nuhoglu, C.; Nuhoglu, Y. J. Hazard. Mater.
2008
, 151, 86.
2. Bilal, M.; Shah, J. A.; Ashfaq, T.; Gardazi, S. M. H.;
Tahir, A. A.; Pervez, A.; Haroon, H.; Mahmood, Q. J.
Hazard. Mater.
2013, 263, 322.
3. Kokes, H.; Morcali, M. H.; Acma, E. Eng. Sci. Tech.
2014, 17, 39.
4. Ntimbani, R. N.; Simate, G S.; Ndlovu, S. J. Environ. Chem.
Eng.
2015, 3, 1258.
5. Su, Y. N.; Lin, W. S.; Hou, C. H.; Den, W. J. Water Pro
cess Eng.
2014, 4, 149.
6. Roy, S.; Datta, A.; Rehani, S. Inter J. Mineral Processing
2015, 143, 43.
7. Ferraro, I.; Hullebusch, E. D.; Huguenot, D.; Fabbricino, M.; Esposito, G. J. Environ. Management
2015, 163, 62.
8. Rabiet, M.; Letouzet, M.; Hassanzadeh, S.; Simon, S. Che
mosphere
2014, 95, 639.
9. Yang, Z.; Jia, S.; Zhuo, N.; Yang, W; Wang, Y Chemosphere
2015, 141, 112.
10. Doh, J. H.; Kim, J. H.; Kim, H. J.; Ali, R. F.; Shin, K.;
Hong, Y. J. Chem. Eng. J.
2015, 277, 352.
11. Lee, C. K.; Low, K. S. Environ. Technol.
1989, 10, 395.
12. Sljivic, M.; Smiciklas, I.; Plecas, I.; Pejanovic, S. Environ.
Technol.
2011, 32, 933.
13. Price, M. S.; Classen, J. J.; Payne, G. A. Biores. Technol.
2001
, 77, 41.
14. Neto, V. O. S.; Oliveira, A. G; Teixeira, R. N. P.; Silva, M. A. A.; Feire, P. T. C.; Keukeleire, D. D.; Nascimento, R. F. BioResources
2011, 6, 3376.
15. Shawabkeh, R.; Al-Harahsheh, A.; Al-Otoom, A. Sep.
Purif. Technol.
2004, 40, 251.
16. Lu, S.; Gibb, S. W. Biores. Technol.
2008, 99, 1509.
17. Basci, N.; Kocadagistan, E.; Kocadagistan, B. Desalination
2004, 164, 135.
18. Sun, B.; Mi, Z. T.; An, G.; Zou, J. J. Industrial Eng.
Chem. Res.
2009, 48, 9823.
19. Chang, Q.; Zhang, M.; Wang, J. J. Hazard. Mater
2009, 169, 621.
Journalofthe Korean Chemical Society