Study on the Combustion Characteristics of Light-Load RI-CNG Engine
저부하 라디칼 착화 압축천연가스 엔진의 성능연구
Yu. Liu, Yong. Dong, J. K. Keom and S. S. Chung 류우․동용․염정국․정성식
(received 25 August 2010, revised 03 October 2010, accepted 07 October 2010)
주요용어:라디칼 착화(Radical Ignition), CNG(Compressed Natural Gas), 부실(Sub-chamber), 분사시기(Injection Timing), 공기과잉률(Excess Air ratio)
요 약:본 연구는 라디칼 착화(Radical Ignition이하 RI) 기술을 적용한 부실직분식 CNG(Compressed Natural Gas)엔진의 구동특성에 관한 것이다. 실험엔진은 단기통 디젤엔진을 개조하여 사용하였으며, 이는 부실식 디젤엔진처럼 연소실이 주실과 부실로 나누어져 있다. 부실에 분사된 CNG는 스파크플러그로 점화하며, 부 실로 부터의 연소가스가 주실 희박 혼합기를 시켜 구동하는 엔진이다. RI 기술은 연소속도를 향상시킬 수 있다. 본 연구는 주로 저부하 RI-CNG 엔진의 성능을 연구하였다. 연료분사기간은 9 ms, 공기과잉률은 1.0, 1.2, 1.4로 하였다. 연료분사시기는 엔진의 배기밸브가 닫히는 ATDC 20 °CA 부터 120 °CA 사이로, 20 °CA
간격으로 지각시켜 가며 실험하였다. 본 연구는 연료분사시기 및 공기과잉률이 연소최고압력(P
max
), 연소최고압력시기(θ
pmax
), 도시평균유효압력(IMEP), 사이클 변동계수(COVimep
), 연소속도에 미치는 양향 등을 구하 고 분석하였다.정성식(교신저자) : 동아대학교 기계공학부 E-mail : [email protected], Tel : 051-200-7654 동 용 : 동아대학교 기계공학부
염정국 : 동아대학교 기계공학부 류 우 : 동아대학교 기계공학부
1. 서 론
RI (Radical Ignition) combustion method was applied into a sub-chamber type CNG (Compressed Natural Gas) injection engine which is a modified DI diesel engine. The volume of the sub-chamber is 1~2% of the main-chamber. The sub-chamber has about 4 passage holes of about 1.8 mm in diameter. A spark-plug and a CNG injector were installed in the sub-chamber. The ignition occurs in the sub-chamber first and then the combustion gas containing a number of active radicals is forced out of sub-chamber through the holes into the main-chamber to ignite the unburned mixture. It is predicted that the RI combustion method can improve combustion
velocity
1~4)
.To investigate the combustion characteristics of the RI-CNG engine, a series of experiments have been carried out. In the previous report
5~7)
, combustion characteristics of RI-CNG engine was investigated under middle load. RI-CNG engine showed higher combustion stability at certain conditions. But relatively longer combustion duration was observed under the middle load condition and the NOX
emission was a little higher.There are some problems when using the CNG fuel which is used as the fuel for the RI-CNG engine. Its energy density is lower compared with liquid fuel such as gasoline and diesel, so longer injection duration is needed. The longer injection duration results in shorter mixing duration of the direct-injected CNG and the air. If the CNG is directly injected into the sub-chamber, the direct-injected CNG in the sub-chamber prevents the possibility entry of the fresh air from the
main-chamber, which also affects the CNG-air mixture formation in the sub-chamber. All of these have a significant effect on the engine combustion characteristics and performance.
The purpose of this paper is to study the combustion characteristics of the RI-CNG engine under a light load. The engine speed was set at 1000 rpm. Under a light load condition, less CNG fuel is needed to be injected into the sub-chamber. So the injection duration is shorter compared with a middle load condition. In the experiment, the injection duration was set at 9 ms and the injection timing was changed every 20 °CA from EVC (Exhaust Valve Close) to the limit injection timing. The limit injection timing means that the engine can operate steadily until the limit injection timing. The effects of injection timing and excess air ratio on the cylinder pressure, P
max
, θpmax
, COVimep
, frequency distribution of Pmax
and θpmax
, combustion duration were analyzed.2. Experimental setup
2.1 Experimental apparatus
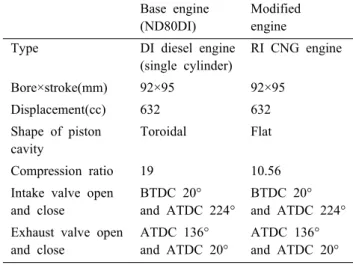
A DI (Direct Injection) diesel engine was modified into an experimental RI engine. The specifications of the DI engine and the modified RI engine are shown in table 1.
Fig. 1 shows the experimental apparatus which consists of the RI engine, an ECU (Electric Control Unit), data acquisition system, fuel supply system and exhaust analysis system. Two regulators were used between the high pressure CNG tank and CNG injector to obtain steady injection pressure. A CNG injector and a spark-plug were installed in the sub-chamber.
CNG is injected into the sub-chamber during the intake stroke and the pre-mixture is formed during the compression stroke. Then the pre-mixture in the sub-chamber is ignited by the spark-plug. All of engine speed, injection duration and injection timing can be controlled by the ECU.
Table 1 The experimental engine specification
Base engine
(ND80DI)
Modified engine Type DI diesel engine
(single cylinder)
RI CNG engine
Bore×stroke(mm) 92×95 92×95
Displacement(cc) 632 632
Shape of piston cavity
Toroidal Flat
Compression ratio 19 10.56 Intake valve open
and close
BTDC 20°
and ATDC 224°
BTDC 20°
and ATDC 224°
Exhaust valve open and close
ATDC 136°
and ATDC 20°
ATDC 136°
and ATDC 20°
1. ECU controller 2. Data acquisition PC 3. A/D converter 4. Encoder 5. Dynamometer 6. CNG tank 7. Regulator 8. CNG flow meter 9. Surge tank 10. Air filter 11. Air throttle 12. GDI injector 13. Sub-chamber 14. Test engine 15. Spark plug 16. Exhaust gas sampling
17. Exhaust gas analyzer 18. Cylinder pressure sensor 19. λ sensor 20. Amplifier 21. λ indicator
Fig. 1 Schematic diagram of experimental systemFig. 2 shows the relative location of the sub-chamber, the CNG injector and spark plug in cylinder head. The sub-chamber with a spark plug was set at the original injector place of the DI engine. The CNG injector was installed in the upper part of the sub-chamber. For this study, the CNG is injected into the sub-chamber directly. The direct injected CNG has the function of scavenging residual gas of the last cycle and supplying fuel for the new cycle. The sub-chamber has 4 passage holes of 1.8 mm in diameter. The volume of the sub-chamber is 2.45 cc.
Injector
Spark plug Sub-chamber
Fig. 2 Injector, sub-chamber and spark plug distribution in the RI-CNG engine
2.2 Experimental methods
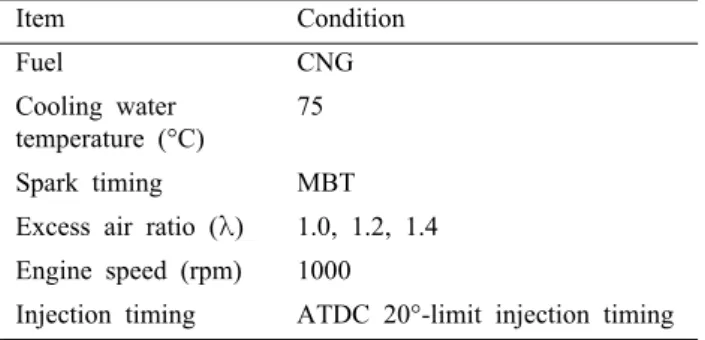
The injection duration was set at 9 ms. Air excessive ratio was set at λ= 1.0, λ= 1.2 and λ=
1.4, respectively. The table 2 shows the specific experimental conditions.
Table 2 Experimental conditions
Item Condition
Fuel CNG
Cooling water temperature (°C)
75
Spark timing MBT Excess air ratio (λ) 1.0, 1.2, 1.4 Engine speed (rpm) 1000
Injection timing ATDC 20°-limit injection timing
3. Experimental results and discussion
3.1 Effects of injection timing on cylinder pressure In the case of the RI-CNG engine, the curves of cylinder pressure versus crank angle are given in Fig. 3. Each pressure curve is the average value calculated from the data measured for 50 cycles. When λ is 1.0, Fig. 3 shows the changes of cylinder pressure with different injection timings. To meet the MBT (Maximum Brake Torque), the ignition timing was set at BTDC (Before Top Dead Center) 45 °CA (Crank Angle) for the injection timing from ATDC (After Top Dead Center) 20 to 100 °CA and the ignition timing was set at BTDC 38 °CA for the injection timing from ATDC 120 to 200 °CA. Different ignition timings lead to different combustion characteristics. When the ignition timing is set at BTDC 45 °CA, the P
max
is relatively higher andthe maximum pressure occurs a little farther away from the TDC. When the ignition timing is set at BTDC 38 °CA, the P
max
is relatively lower and the maximum pressure occurs close to the TDC(Top Dead Center). The smallest θpmax
occurs when the injection timing is set at ATDC 140 °CA. When injection timing is set at ATDC 200 °CA, the misfire happens.
-20 0 20 40 60 80 100
0 1 2 3 4 5
Excess air ratio: λ =1.0 Engine speed:1000rpm Ignition timing:
BTDC 45
oCA
( Injection timing from ATDC 20 -100
oCA) BTDC 38
oCA
( Injection timing from ATDC 100 -200
oCA)
C yli nder Pr essur e ( MPa )
Crank Angle( Deg. )
Injection timing:
ATDC 20
oCA ATDC 40
oCA ATDC 60
oCA ATDC 80
oCA ATDC 100
oCA ATDC 120
oCA ATDC 140
oCA ATDC 160
oCA ATDC 180
oCA ATDC 200
oCA
TDC
Fig. 3 Measured cylinder pressure versus injection timing as λ= 1.0
0 20 40 60 80 100 120 140 160 180 200 220 38
40 42 44 46 48 50
Ignition timing: BTDC45
oCA
θ
pmax, ATD C ( Deg. )
Injection Timing, ATDC( Deg.)
Ignition timing: BTDC38
oCA
0 20 40 60 80 100 120 140 160 180 200 220 2.5
3.0 3.5 4.0 4.5
Excess air ratio: λ=1.0 Engine speed: 1000rpm P
max(MP a)
Fig. 4 Maximum cylinder P
max
and θpmax
versus injection timing as λ= 1.0When λ is 1.2, with the same injection duration, more air should be inducted into the cylinder, so the open rate of throttle valve should be increased. Fig. 5 shows the effects of injection timing on the cylinder pressure. To meet the MBT, the ignition timing was set at BTDC 32
°CA for the injection timing from ATDC 20 to 100 °CA and the ignition timing is set at BTDC 28 °CA for the injection timing from ATDC 120 to 210 °CA. Shown in Fig. 6, it is found that the
P
max
values are almost the same for the injection timing between ATDC 20 and 180 °CA, but their θpmax
values are different, just when the injection timing is set from ATDC 120 to 180 °CA, the maximum pressure occurs close to TDC. From the experiment result, it shows that even at lean burn conditions. The engine can still obtain relatively high combustion velocity by adjusting injection timing. But with much delayed injection timing, an unsteady combustion or misfire will happen.-40 -20 0 20 40 60 80
0.0 0.5 1.0 1.5 2.0 2.5 3.0 3.5 4.0
C ylind er Pres su re ( MPa )
Crank Angle ( Deg . ) Injection timing
ATDC 20
oCA ATDC 40
oCA ATDC 60
oCA ATDC 80
oCA ATDC 100
oCA ATDC 120
oCA ATDC 140
oCA ATDC 160
oCA ATDC 180
oCA ATDC 200
oCA ATDC 210
oCA
Excess air ratio: λ=1.2 Engine speed:1000rpm Ignition timing:
BTDC 32
oCA
( Injection timing from ATDC 20 -120
oCA) BTDC 28
oCA
( Injection timing from ATDC 20 -120
oCA) TDC
Fig. 5 Measured cylinder pressure versus injection timing as λ= 1.2
0 20 40 60 80 100 120 140 160 180 200 220 32 34
36 38 40 42 44 46 48
Ignition timing: BTDC32
oCA
Ignition timing: BTDC28
oCA
θ pma x , AT DC ( D eg. )
Injection Timing, ATDC(Deg.)
0 20 40 60 80 100 120 140 160 180 200 220 2.0
2.5 3.0 3.5
P ma x ( MP a )
Excess air ratio: λ =1.2 Engine speed: 1000rpm
Fig. 6 Maximum cylinder P
max
and θpmax
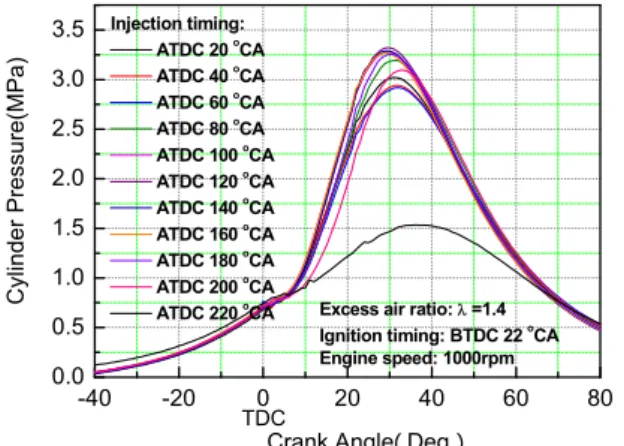
versus injection timing as λ= 1.2As λ is 1.4, it is shown that the maximum cylinder pressure is much affected by the injection timing, and the maximum cylinder pressure decreases rapidly when the injection timing is set at ATDC 220 °CA which means the misfire occurs. Generally, the engine can reach its
highest efficiency when maximum pressure occurs at ATDC 10~15 °CA, so a small θ
pmax
is good for engine efficiency. Fig. 7 shows the effects of injection timing on Pmax
and θpmax
. When the injection timing is ATDC 120 °CA, the engine has the highest maximum cylinder pressure Pmax
which leads to a rapid combustion and the θ
pmax
is the smallest which means the maximum pressure occurs close to TDC and the engine has relatively high efficiency.
-40 -20 0 20 40 60 80
0.0 0.5 1.0 1.5 2.0 2.5 3.0 3.5
Cylind er Pressure(MPa)
Crank Angle ( Deg. ) Injection timing:
ATDC 20
oCA ATDC 40
oCA ATDC 60
oCA ATDC 80
oCA ATDC 100
oCA ATDC 120
oCA ATDC 140
oCA ATDC 160
oCA ATDC 180
oCA ATDC 200
oCA
ATDC 220
oCA Excess air ratio: λ =1.4 Ignition timing: BTDC 22
oCA Engine speed: 1000rpm TDC
Fig. 7 Measured cylinder pressure versus injection timing as λ= 1.4
0 20 40 60 80 100 120 140 160 180 200 220 240 28
30 32 34 36
θ pm ax , AT D C (Deg.)
Injection Timing, ATDC( Deg.)
0 20 40 60 80 100 120 140 160 180 200 220 240 1.5
2.0 2.5 3.0 3.5
Ignition timing: BTDC22
oCA Excess air ratio: λ =1.4 Ignition timing: BTDC 22
oCA Engine speed: 1000rpm P ma x (M Pa)
Fig. 8 Maximum cylinder P
max
and θpmax
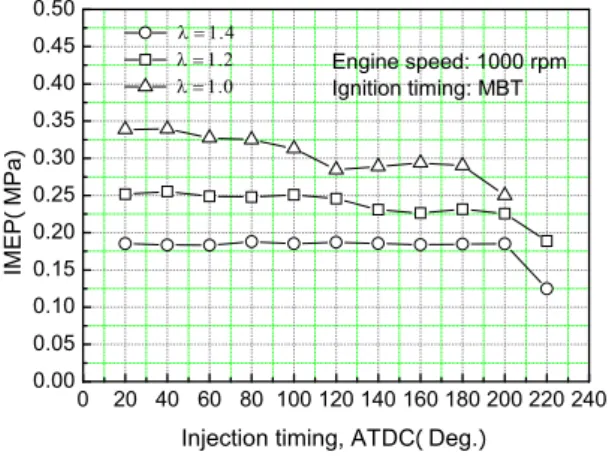
versus injection timing as λ= 1.43.2 Effects of injection timing on IMEP
Fig. 9 shows the effects of injection timing on IMEP (Indicated Mean Effective Pressure) with different excess air ratios. When λ is 1.4, the value of IMEP fluctuates slightly versus injection timing until the misfire occurs. For λ is 1.2, the
peak IMEP value occurs when the injection timing is set at ATDC 100 °CA and ATDC 120
°CA. Shown in the Fig. 6, the corresponding θ
pmax
is ATDC 30 °CA and ATDC 28 °CA. As λ is 1.0, the value of IMEP decreases with the delay of injection timing. The IMEP value decreases with the increase of excess air ratio.0 20 40 60 80 100 120 140 160 180 200 220 240 0.00
0.05 0.10 0.15 0.20 0.25 0.30 0.35 0.40 0.45 0.50
Engine speed: 1000 rpm Ignition timing: MBT
IMEP ( MPa )
Injection timing, ATDC ( Deg. ) λ = 1.4
λ = 1.2 λ = 1.0
Fig. 9 The effects of injection timing on IMEP with different excess air ratios
3.3 Effects of injection timing on engine operation stability
Fig. 10 shows the combustion stability of the engine under given experiment conditions. The COV (Coefficient of Variation) of IMEP indicates engine operation stability. This RI engine shows high operation stability with different λ values, especially at lean burn condition when λ is 1.4, it still can operate steadily. So the RI combustion method can improve engine operation stability.
0 20 40 60 80 100 120 140 160 180 200 220 240 0
10 20 30 40 50
Engine speed: 1000 rpm Ignition timing: MBT
λ = 1.4 λ = 1.2 λ = 1.0
COV im ep , %
Injection timing, ATDC ( Deg. )
Fig. 10 The effects of injection timing on COV
imep
with different excess air ratios
3.4 Frequency distribution of P
max
and θpmax
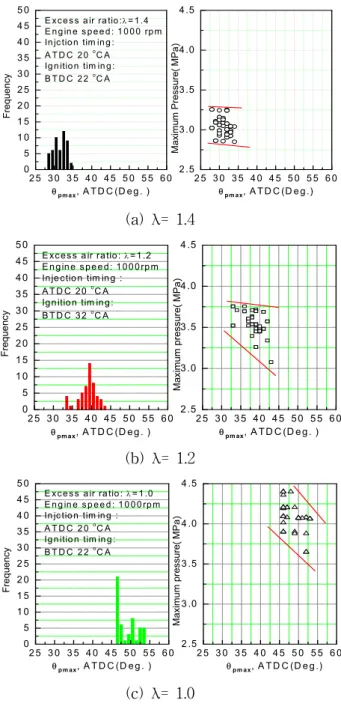
Fig. 11 shows the frequency distribution of Pmax and θpmax, for 50 cycles of the RI engine with different λ values. The injection timing was fixed at ATDC 20 °CA. Shown in Fig. 11, with the decrease of λ value, the distribution of θ
pmax
becomes wider and the distribution of θ
pmax
becomes farther away from the TDC. When the λ is 1.4, the distribution of θ
pmax
is from ATDC 28°CA to 35 °CA. When the λ is 1.2, the distribution of θ
pmax
is from ATDC 33 °CA to 43°CA. When the λ is 1.0, the distribution of θ
pmax
is from ATDC 46 °CA to 54 °CA. The distribution of P
max
also becomes wider and the value of Pmax
increase with the decrease of λ.When the λ is 1.4, the distribution of P
max
is from 2.8 MPa to 3.3 MPa. When the λ is 1.2, the distribution of θpmax
is from 3 MPa to 3.8 MPa.When λ is 1.0, the distribution of θ
pmax
is from 3.6 MPa to 4.4 MPa. By comparing the distribution of Pmax
and θpmax
of different excess air ratios with the fixed injection timing, the cycle-by-cycle variation of 1.4 excess air ratio is small which means the engine operation is much steadier than that of other λ conditions.When the injection timing is changed to ATDC 120 °CA, the frequency distribution of P
max
and θpmax
for 50 cycles of the RI engine is shown in Fig. 12. When the λ is 1.4, the distribution of θpmax
is from ATDC 28 °CA to 36 °CA and the distribution of Pmax
is from 3 MPa to 3.5 MPa.When the λ is 1.2, the distribution of θ
pmax
is from ATDC 33 °CA to 37 °CA and the distribution of Pmax
is from 3.4 MPa to 4 MPa.When the λ is 1.0, the distribution of θ
pmax
is from ATDC 39 °CA to 48 °CA and the distribution of Pmax
is from 3.4 MPa to 4.2 MPa.It is found that for both fixed injection timings, decrease in λ value makes the distribution of θ
pmax
to become wider and the θpmax
to become farther away from the TDC. It also makes the distribution of Pmax
to become wider and the value of Pmax
to increase.2 5 3 0 3 5 4 0 4 5 5 0 5 5 6 0 0
5 1 0 1 5 2 0 2 5 3 0 3 5 4 0 4 5 5 0
F req ue nc y
θ pm ax , A T D C (D e g . ) E xc e s s a ir ra tio :λ = 1 .4 E n g in e s p e e d : 1 0 0 0 rp m In jc tio n tim in g : A T D C 2 0
oC A Ig n itio n tim in g : B T D C 2 2
oC A
2 5 3 0 3 5 4 0 4 5 5 0 5 5 6 0 2 .5
3 .0 3 .5 4 .0 4 .5
Max im um Pr essu re ( MP a )
θ pm ax , A T D C (D e g .)
(a) λ= 1.4
2 5 3 0 3 5 4 0 4 5 5 0 5 5 6 0 0
5 1 0 1 5 2 0 2 5 3 0 3 5 4 0 4 5 5 0
F req ue nc y
θ pm ax , A T D C (D e g . ) E xc es s a ir ratio: λ = 1 .2 E n g in e s pe e d: 1 00 0 rp m Inje ctio n tim in g : A T D C 20
oC A Ign itio n tim in g:
B T D C 32
oC A
2 5 3 0 3 5 4 0 4 5 5 0 5 5 6 0 2 .5
3 .0 3 .5 4 .0 4 .5
Ma xi mu m p re ss ure (MP a )
θ pm ax , A T D C (D e g . )
(b) λ= 1.2
2 5 3 0 3 5 4 0 4 5 5 0 5 5 6 0 0
5 1 0 1 5 2 0 2 5 3 0 3 5 4 0 4 5 5 0
E x c e s s a ir ra tio : λ = 1 .0 E n g in e s p e e d : 1 0 0 0 rp m In jc tio n tim in g : A T D C 2 0
oC A Ig n itio n tim in g : B T D C 2 2
oC A
Fr eq uency
θ pm ax , A T D C (D e g . )
2 5 3 0 3 5 4 0 4 5 5 0 5 5 6 0 2 .5
3 .0 3 .5 4 .0 4 .5
Maximum pr essure ( MPa )
θ pm ax , A T D C (D e g .)
(c) λ= 1.0
Fig. 11 Distribution of P
max
and θpmax
, for 50 cycles of the RI engine under different λ valueswith fixed ATDC 20 °CA injection timing
2 5 3 0 3 5 4 0 4 5 5 0 5 5 6 0 0
5 1 0 1 5 2 0 2 5 3 0 3 5 4 0 4 5 5 0
Freq ue ncy
θ
p m a x, A T D C (D e g .) E x c e s s a ir ra tio : λ = 1 .4 E n g in e s p e e d : 1 0 0 0 rp m In jc tio n tim in g : A T D C 1 2 0
oC A Ig n itio n tim in g : B T D C 2 2
oC A
2 5 3 0 3 5 4 0 4 5 5 0 5 5 6 0 2 .5
3 .0 3 .5 4 .0 4 .5
Maximum Pres sure ( MP a )
θ
p m a x, A T D C (D e g . )
(a) λ= 1.4
25 30 35 40 45 50 55 60 0
5 10 15 20 25 30 35 40 45 50
Freq ue nc y
θ pmax , ATD C (D eg.) Excess air ratio: λ =1.2 Engine speed: 1000 rpm Injction tim ing:
AT D C 120
oCA Ignition tim ing:
BT D C 32
oC A
25 30 35 40 45 50 55 60 2.5
3.0 3.5 4.0 4.5
Ma xi mu m P re ss ure (MPa )
θ pmax , A TD C (D eg. )
(b) λ= 1.2
2 5 3 0 3 5 4 0 4 5 5 0 5 5 6 0 0
5 1 0 1 5 2 0 2 5 3 0 3 5 4 0 4 5
5 0 E x c e s s a ir ra tio : λ = 1 .0 E n g in e s p e e d : 1 0 0 0 rp m In jc tio n tim in g : A T D C 1 4 0
oC A Ig n itio n tim in g : B T D C 3 8
oC A
Fre que ncy
θ
pm ax, A T D C (D e g .)
2 5 3 0 3 5 4 0 4 5 5 0 5 5 6 0 2 .5
3 .0 3 .5 4 .0 4 .5
Ma xi mu m P ressu re(MPa )
θ
pm ax, A T D C (D e g .)
(c) λ= 1.0
Fig. 12 Distribution of P
max
and θpmax
, for 50 cycles of the RI engine under different λ valueswith fixed ATDC 140 °CA injection timing
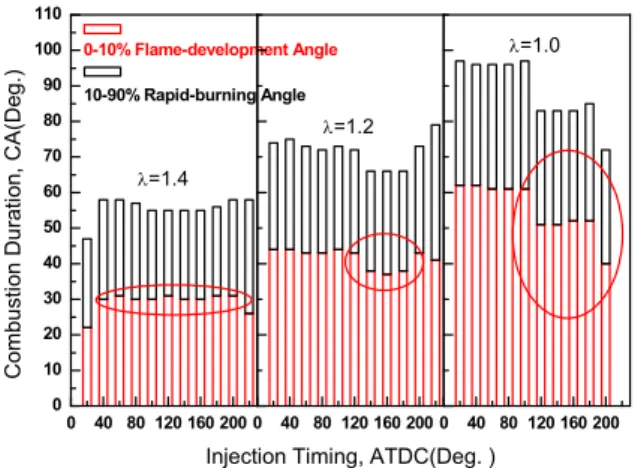
3.5 Combustion duration
Fig. 13 illustrates the detailed combustion histories. The combustion duration is consisted of the flame development angle and the rapid burning angle. Shown in Fig. 13, the flame development angle is relatively long for this light load combustion. It is about 30 °CA, 40 °CA and 60 °CA for 1.4, 1.2 and 1.0 excess air ratio, respectively.
For each λ, the flame development angle changes with the increase of injection timing. As λ is 1.4, the fluctuation of the flame development angle is small; as λ is 1.2, when the injection timing is set from ATDC 120 °CA to 180 °CA, the flame development angle is shorter. For λ=1.0, the flame development angle is shorter when the injection timing is set from ATDC 120 °CA to 200 °CA and the difference of the flame development angle is more obvious. For all combustions with different excess air ratios and injection timings, they have almost the same rapid burning angle.
0 40 80 120 160 200 0
10 20 30 40 50 60 70 80 90 100 110
Co mb us tio n D u ra tio n, CA(De g. )
10-90% Rapid-burning Angle 0-10% Flame-development Angle
λ =1.4
0 40 80 120 160 200 λ =1.2
Injection Timing, ATDC(Deg. )
0 40 80 120 160 200 λ =1.0
Fig. 13 Combustion duration versus injection timing with different excess air ratios
4. Conclusions
The RI method was applied in a modified DI diesel engine to achieve rapid bulk combustion, and the CNG fuel was directly injected into the sub-chamber to scavenge the residual gas that from the previous cycle. The effects of injection timing and excess air ratio on engine characteristics and performance were investigated under a light load condition. The following summarizes the results:
The maximum cylinder pressure is much affected by the injection timing. The maximum cylinder pressure decreases rapidly when the injection timing is set at ATDC 200 °CA which means the misfire occurs. It is found that for both fixed injection timings, decrease in λ value makes the distribution of θ
pmax
to become wider and the θpmax
to become farther away from the TDC. It also makes the distribution of Pmax
to become wider and the value of Pmax
to increase.This RI engine shows high operation stability with different λ values, especially at lean burn condition. When λ is 1.4, the value of IMEP fluctuates slightly with injection timing until the misfire occurs; by comparing the distribution of P
max
and θpmax
of different excess air ratios with the fixed injection timing, the cycle-by-cycle variation of 1.4 air excessive ratio is small; as λ is 1.4, the fluctuation of flame development angle is small. So RI combustion method can improve engine operation stability at lean burn combustioncondition.
Acknowledgement
This work was supported by the Dong-A University research fund.
Reference
1. M. J. Lee, J. Y. Kim, J. S. Park, J. K. Yeom and S. S. Chung, 2004, “A Study on the Rapid Bulk Combustion of Pre-mixture Using the Radical Seeding”, KSME International Journal, Vol. 18, pp. 1623~1629.
2. J. S. Park, J, K, Yeom, T. W. Lee, J. Y. Ha and S. S. Chung, 2006, “Study on Pre-mixture Combustion in a Sub-chamber Type CVC with Multiple Passage Holes”, International Journal of Automotive Technology, Vol. 7, pp. 17~23.
3. J. S. Park, J. K. Yeom, J. Y. Ha, S. P. Kim and S. S. Chung, 2006, “Study on The Radical Ignition Method Using Constant Volume Combustor”,WSEAS TRANSACTION ON HEAT AND MASS TRANSFER, Vol. 6, pp.
644~650.
4. J. S. Park, J. Y. Ha, J. K. Yeom, J. S. Lee, C.
J. Lee and S. S. Chung, 2007, “Radical Ignition Technique in a Constant Volume Chamber”, International Journal of Automotive Technology, Vol. 8, pp. 269~274.
5. J. S. Park, B. M. Kang, K. J. Kim, T. W. Lee, J. K. Yeom and S. S. Chung, 2005, “Study on Combustion Characteristics and Application of Radial Induced Ignition Method in an Actual Engine”, International Journal of Automotive Technology, Vol. 6, pp. 555~561.
6. S. S. Chung, J. Y. Ha, J. S. Park, K. J. Kim and J. K. Yeom, 2007, “Comparison of the Combustion Characteristics S.I. Engine and R.I.
Engine”, International Journal of Automotive Technology, Vol. 8, pp. 19~25.
7. S. S. Chung, J. K. Yeom and J. S. Park, 2008,
“Scavenging a Sub-chamber Type CNG Fueled Engine”, International Journal of Automotive Technology, Vol. 9, pp. 123~128.