Analysis of Phenolic Compounds in Sorghum, Foxtail Millet and Common Millet
Hyun-Seok Jeon*, Ill-Min Chung*, Kyung-Ho Ma**, Eun-Hye Kim*, Soo-Jung Yong*, and Joung-Kuk Ahn*†
*Department of Applied Life Science, College of Life and Environmental Science, Konkuk University, Seoul 143-701, Korea
**National Academy of Agricultural Science, Rural Development Administration, Suwon 441-707, Korea
361
†Corresponding author: (Phone) +82-2-450-3730 (E-mail) [email protected]
<Received 6 August, 2011; Revised 19 September, 2011; Accepted 21 November, 2011>
ABSTRACT The cereal grain crops have strong flexibility against adverse environment and they have various functional compounds. The objective of the present study was to screen phenolic compounds in sorghum [Sorghum bicolor (L.) Moench], foxtail millet (Setaria italica), common millet (Panicum miliaceum L.) by high performance liquid chromatography (HPLC) with photodiode array (PDA) detector. Sorghum contained the highest amount of phenolic compounds among three different crops (sorghum, foxtail millet, common millet).
Especially Moktaksusu showed the highest amount of phenolic compounds concentrations and biggest regional differences.
The comparison of average phenolic compounds in sorghums by regions showed order to Milyang (963.3 μg・g-1), Yeongyang (923.1 μg・g-1), Gijang (831.3 μg・g-1) and Bonghwa (735.6 μg・g-1). Among the sorghum cultivars, Moktaksusu (1407.9 μg・g-1) had the highest concentration of phenolic compounds.
The average phenolic compounds of foxtail millets showed similar amount among Milyang (319.0 μg・g-1), Gijang (288.1 μg・g-1) and Bonghwa (281.9 μg・g-1) areas. The phenolic compounds of Yeongyang (246.6 μg・g-1) slightly low and that showed similar concentrations among three different regions. The concentration of phenolic compounds in foxtail millets, Chungchajo (335.6 μg・g-1) showed the highest con- centrations. The average phenolic compounds of common millets showed the highest concentrations in Milyang (305.5 μg・g-1), Bonghwa (262.0 μg・g-1), Gijang (195.1 μg・g-1), Yeongyang (237.2 μg・g-1) in decreasing order. The concent- ration of phenolic compounds of common millets was the highest in the Norangchalgijang (337.0 μg・g-1), Hwanggumgijang (250.0 μg・g-1) was also relatively higher than others. The results of this study will provide basic information for breeding sorghums, foxtail millets and common millets with higher phenolic compound concentrations.
Keywords : HPLC, phenolic compounds, sorghum, foxtail millet, common millet
Cereals
such as sorghum [Sorghum bicolor (L.) Moench], foxtail millet (Setaria italica), common millet (Panicum miliaceum L.), and others were attention to people. The 21 century people’s life is very stabilized and also increased about health care. In this regard cereal’s value is really high.Many people always dream about maintenance of youth extension of life. To meet the needs of these human eager that research has been conducted in different direction. One such study is the access from the diet. Some of the specific substances can help about human health and maintained the youth that have revealed through various researches (Harbone and Williams, 2000). And other study helps lower risk of cardiovascular disease, ischemic stroke, type II diabetes, metabolic syndrome, and gastrointestinal cancers. Those substances are anthocyanidin, flavonoids, isoflavones and some kind of plant secondary metabolite. Of these materials, the phenolic compounds are representative of a plant secondary metabolites (Naczk and Shaahidi, 2004).
Cereals like foxtail millet and sorghum were consumed as whole grain. Such consumption pattern has helpful to prevent about some kind of disease (cardiovascular disease, ischemic stroke, type II diabetes, metabolic syndrome, and cancers) (Jones, 2006; Maggiolini et al., 2005). Epidemiological evidence shows that increased levels of fruit and vegetables in the diet reduce the risk of cancer and heart disease (Block et al., 1992; Nothling et al., 2007). Numerous studies show that the high correlations were observed between total phenols and antioxidant activity (Dykes and Rooney, 2007).
Recent studies showed that fruits and various vegetables were revealed antioxidant activities and very effective about oxidative damage diseases such as coronary heart disease, stroke and cancers (Jacob and Burri, 1996; Paganga et al., 1999; Huang and Ferraro, 1992; Powles and Ness, 1996;
Block et al., 1992). One area of work has been in trying to elucidate the role of antioxidants and free radical scavengers in reducing the severity of degenerative diseases. Free radicals have been implicated in playing a role in over 100 diseases, including cancer there is currently only proof that free radicals are involved in the pathogenesis of a few diseases (Kehrer, 1993; Stohs et al., 1995; Thomas, 1995). Specially, sorghums had strong radical scavenging activity and inhibitory activity aginst bacteria (Kil et al., 2009). The possible health benefits of specific phenolic compounds such as remain unproved as exists for all types of phenolic compounds (Rebecca, 2003).
All cereal grains containing the phenolic compounds, which are located in the pericarp, testa, aleurone layer, and endosperm (Hahn et al., 1983). Research indicates that phenolic com- pounds may reduce the risk of cardiovascular disease and cancer.
Since phenolics are virtually ubiquitous in plant material and may occur at very high levels, it seems likely that, given a sufficient bioavailability, these compounds will play a major role in determining the antioxidant potential of food stuffs.
As more work has been carried out, many more specific, targeted roles for phenolics have also been identified. Many flavonoids in particular are also able to modulate the activity of key human enzymes such as tyrosine kinases (Sharma et al., 1994). Phenolic compounds are a group of chemical substances found in plants, characterized by the presence of more than one unit or building block. They are generally divided into phenolic acids, flavonoids, condensed tannins, and lignans. Phenolic acids are divided into benzoic acid, cinnamic acids, and others. They were included in all cereal grains. Flavonoids are more than 5,000 and have been iden- tified in nature. Phenolic compounds are divided into hydroxy- benzoic acids and hydroxycinnamic acids. Hydroxybenzoic acids include gallic, protocatechuic, gentisic, p-hydroxybenzoic, vanillic, syringic, veratric, benzoic, and β-resorcylic acids (Hahn et al., 1983). Hydroxycinnamic acids include chlorogenic, caffeic, p-coumaric, ferulic, m-coumaric, o-coumaric and t-cinnamic acids. Flavonoids can divide into anthocyanins, flavanols, flavones, flavanones, and flavonols. Flavanols include myricetin and quercetin. Flavanones include rutin, hesperidin, naringenin, hesperetin and naringin. Anthocyanins include cyanidin, cyanidin-3-glucoside, delphinidin, malvidin, malvidin-
3-glucoside, pelargonidin, pelargonidin-3-glucoside, peonidin, peonidin-3-glucoside, and petunidin (Yao et al., 2004).
Anthocyanins are type of flavonoids that are water-soluble materials of colors like blues, purples, and reds in plant.
These compounds exist in the pericarp (Naczk and Shaahidi, 2004).
Some phenolic compounds have been associated with color, sensory qualities, and nutritional and antioxidant properties of foods (Maga, 1978). One impetus for analytical investigations has been the role these phenolics have in the organoleptic properties of foods (Peleg et al., 1991; Naim et al., 1992;
Tan, 2000). Variation of phenolic compounds according to seed colors was shown in previous study (Lee et al., 2010).
Phenolic compounds together with the physical plant structures.
The potential differential effects of elevated atmospheric carbon dioxide and temperature can affect to plant growth and chemistry (Veteli et al., 2002).
This study was carried out to investigate the different concentrations of phenolic compounds in Korean 5 sorghums, 5 foxtail millets and 5 common millets which were cultivated at the four different regions of Korea.
MATERIALS AND METHODS
Samples Preparation for Analysis
The samples used in this experiment were 5 sorghums [Sorghum bicolor (L.) Moench], 5 foxtail millets (Setaria italica) and 5 common millets (Panicum miliaceum L.). The sixty cereal grains were cultivated and harvested at four site:
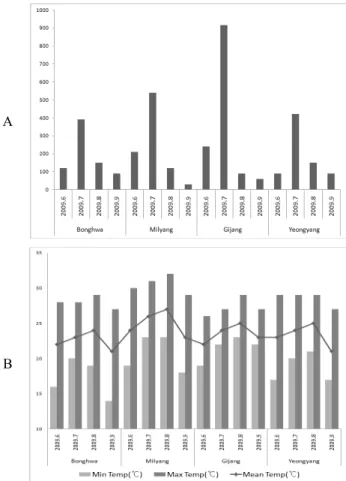
Bonghwa (Gyeongsangbuk-do, 15 cultivars), Yeongyang (Gyeongsangbuk-do, 15 cultivars), Milyang (Gyeongsangnam-do, 15 cultivars), and Gijang (Busan, 15 cultivars) in Korea. 4 cultivation regions have suitable climate conditions for growing of sorghum, foxtail millet and common millet (Fig. 1). Each of the cereal grains were separated by varieties and regions (Table 1) and stored at dry keeper (SANPLATEC Corp.) for the analysis of phenolic compounds.
Color Measurements of Samples
The color value of cereal grains was determined by using a Minolta Chromaticity Meter CR-310 (Konica Minolta, Osaka, Japan). The color testing method used was the CIE-Lab method where L stands for lightness, and a, b stand for
A
B
Fig. 1. Regional climate conditions during crop growth.
A; Precipitation, B; Temperature
Table 1. List of the samples and their chromaticity.
Crops Varieties
Growing region (in Korea)
Bonghwa Yeongyang Milyang Gijang
L a b L a b L a b L* a** b***
Sorghum
Moktaksusu 45.92 +13.24 +24.20 47.46 +12.2 +25.30 45.54 +12.42 +23.30 47.75 +13.40 +17.87 Tojongsusu 59.32 +5.8 +17.31 56.54 +6.53 +19.93 60.27 +4.42 +15.56 58.39 +5.99 +20.66 Hwanggumsusu 43.61 +13.1 +0.70 44.73 +12.67 +21.94 40.60 +14.24 +19.67 40.87 +13.60 +20.66 Hwanggumchalsusu 43.62 +13.48 +21.25 46.67 +12.50 +23.31 39.22 +13.77 +18.25 41.86 +13.37 +21.76 Whenchalsusu 61.48 +5.39 +24.54 59.50 +5.76 +24.29 59.40 +4.92 +22.09 57.47 +5.24 +20.89
Foxtail millet
Hwanggumjo 59.76 +6.26 +29.31 59.33 +5.79 +27.90 59.04 +6.31 +27.47 59.56 +5.94 +28.55 Jaeraejo 65.82 +5.20 +29.52 61.77 +5.45 +27.86 61.66 +6.08 +28.72 59.78 +4.53 +25.44 Chungchajo 57.26 +2.58 +23.04 58.32 +2.74 +24.61 56.49 +3.05 +23.72 56.64 +2.61 +21.70 Whachunchajo 62.57 +5.93 +29.46 58.75 +5.64 +28.79 62.94 +7.25 +31.95 62.14 +6.69 +31.28 Bulgeunjo 59.46 +2.65 +23.66 59.21 +3.25 +25.40 58.45 +3.71 +24.76 55.08 +3.83 +23.39
Common millet
Hwanggumgijang 26.89 +9.84 +9.66 45.02 +9.08 +33.25 29.35 +9.41 +10.52 29.75 +8.51 +10.77 Bulgeungijang 45.19 +19.27 +33.26 55.49 +12.71 +29.97 45.42 +19.27 +33.37 42.84 +19.07 +31.32 Norangchalgijang 64.58 +7.10 +23.94 65.90 +6.68 +24.14 68.74 +6.81 +25.14 67.11 +6.62 +23.94 Jaeraegijang (Pocheon) 54.72 +12.14 +30.64 44.16 +18.45 +32.46 58.05 +12.52 +32.50 58.01 +12.20 +30.83 Jaeraegijang 44.92 +19.41 +33.95 29.82 +9.44 +11.77 39.91 +10.41 +17.73 39.21 +10.59 +17.93
*L; lightness, **a; (+) red to (-) green, ***b; (+) yellow to (-) blue
chromaticity. The sign of a and b indicate color direction:
+a is the direction to red, -a is direction to green, +b is direction to yellow and -b is direction to blue (Table 1).
Sample Preparation for Phenolic Compounds Analysis Each cereal grains were freeze-dried below -40℃ under vacuum to prepare the sample that have been used for these experiments and then ground. The ground samples (2 g) were mixed with 2 mL of 0.1 N HCl and 10 mL of acetonitrile (ACN), stirred for 2 h at room temperature, and filtered through a No. 42 filter paper (Whatman, USA). The filtrate was concentrated to dryness under vacuum at temperature (25℃). The concentrated samples were redissolved in 10 mL of 80% aqueous methanol (HPLC grade J. T. Baker, USA). A aliquot samples were filtered through a 0.45 μm filter (TITAN syringe filter nylon membrane). The filtrate was used for the HPLC analysis.
HPLC Conditions for Phenolic Compounds Analysis The high performance liquid chromatography (HPLC) system was used in a SHIMADZU HPLC system equipped with the SPD-M10A Photo Diode Array detector (Japan), Midas autoinjector (Hamilton, Netherlands), and a 20 μl sample
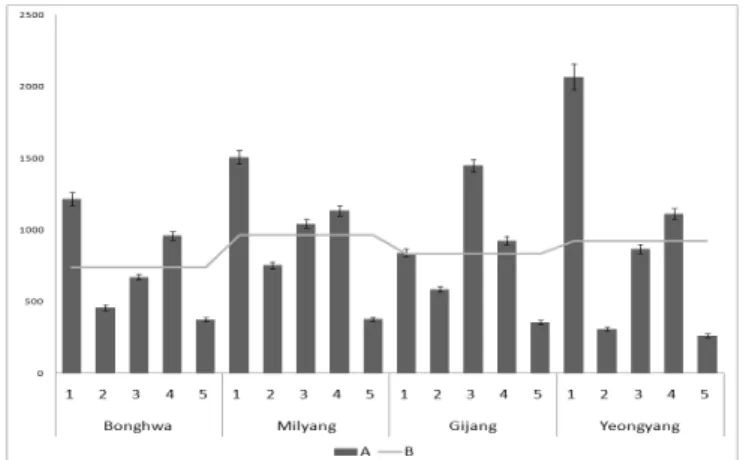
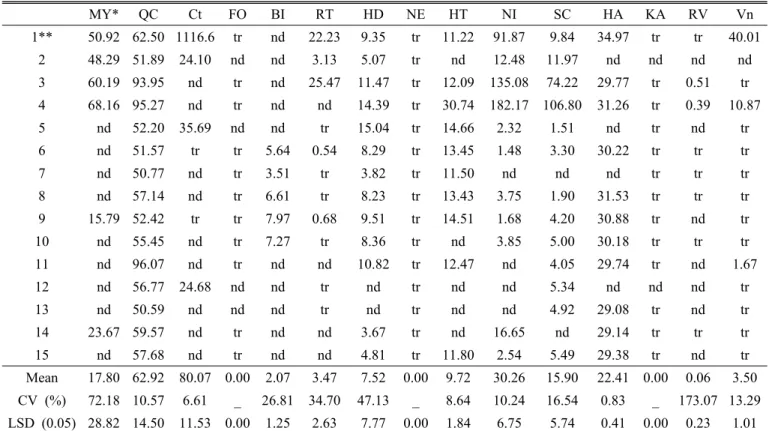
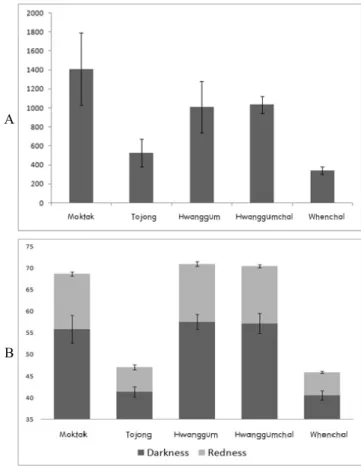
Fig. 2. Comparison of phenolic compound concentrations in sorghums in four cultivation regions. Each vertical bar indicates the standard error values.
A; Total phenolic compounds in each varieties, B; Average phenolic compounds of 5 sorghums total phenolic com- pounds, 1; Moktaksusu, 2; Tojongsusu, 3; Hwanggumsusu, 4; Hwanggumchalsusu, 5; Whenchalsusu
loop. Analysis was primarily achieved on a YMC-Pack ODS AM-303 (5 μm, 250 mm × 4.6 mm I.D.) column.
The absorbance of each sample solution was measured at 280 nm. The solvent gradient HPLC analysis was applied using the modified method of Kim et al. (2006). The mobile phase consisted of solvents A and B. The solvent A was 0.1% glacial acetic acid in distilled water and solvent B was 0.1% glacial acetic acid in acetonitrile and the flow rate was 1 mL・min-1. The injection volume was 20 μl, the linear gradient of HPLC solvent was followed; B was increased from 8% to 10% for 2 min, then from 10% to 30% for 25 min, from 30% to 90% for 23 min, from 90%
to 100% for 2 min, and kept at 100% of B for 5 min, before a return to the initiation state. The next sample was injected after 15 min.
Standard Materials and Generation of Calibration Curves
29 phenolic compounds were purchased from Sigma-Aldrich (USA) and Extrasynthese (France) and those were dissolved with dimethylsulfoxide (DMSO). The calibration curves for standards were made from the serial dilution of samples dissolved in dimethylsulfoxide (DMSO). The linear range and the equation of regression were obtained high linearity from 0.991 to 1.000 sequentially for each calibration at 10, 50, 100 μg・mL-1. All of the solvents were used as HPLC grade (J.T. Baker, USA). The 29 phenolic compounds were gallic acid, protocatechuic acid, vanillic acid, syringic acid, veratric acid, benzoic acid, β-resorcylic acid, chlorogenic acid, caffeic acid, p-coumaric acid, ferulic acid, m-coumaric acid, o-coumaric acid, t-cinnamic acid, myricetin, quercetin, (+)catechin, rutin, hesperidin, naringenin, hesperetin, naringin, formononetin, biochanin A, salicylic acid, homogentisic acid, kaempferol, resveratrol and vanillin.
Statistical Analysis
A statistical analysis was undertaken using the general linear model procedure (GLM) of the statistical analysis system (SAS, 9.1) program. Comparisons among regional and varieties were made at the 0.05 probability level using least significant difference (LSD). All experiments were repeated twice.
RESULTS AND DISCUSSION
Regional Comparison of Phenolic Compounds Sorghum contained the highest amount of phenolic com- pounds among three different species (sorghum, foxtail millet, common millet).
Figure 2 exhibited variation of phenolic compounds con- centrations in sorghum varieties. Among different regions, the phenolic compounds concentration showed higher amount in Yeongyang and Milyang regions of sorghums. The com- parison of average phenolic compounds in sorghums grown in different regions showed order to Milyang (963.3 μg・g-1), Yeongyang (923.1 μg・g-1), Gijang (831.3 μg・g-1) and Bonghwa (735.6 μg・g-1). Moktaksusu had the highest amount of phenolic compounds concentrations and showed the biggest regional differences. And, Yeongyang and Gijang regions were showed big differences of phenolic compounds concentrations. Specially, Gijang region had the highest minimum temperature and the lowest maximum temperature. Bonghwa (1215.6 μg・g-1) and Milyang (1507.8 μg・g-1) regions showed similar phenolic compounds concentrations. However, Yeongyang (2067.6 μg・g-1) and Gijang (840.7 μg・g-1) regions showed big differences.
In case of Hwanggumsusu, Gijang (1448.5 μg・g-1) region had the highest concentration and Bonghwa (670.5 μg・g-1) region revealed the lowest concentration of phenolic compounds.
Fig. 3. Comparison of phenolic compound concentrations in foxtail millets in four cultivation regions. Each vertical bar indicates the standard error values.
A; Total phenolic compounds in each varieties, B;
Average phenolic compounds of 5 foxtail millets total phenolic compounds, 6; Hwanggumjo, 7; Jaeraejo, 8;
Chungchajo, 9; Whachunchajo, 10; Yeongjujo
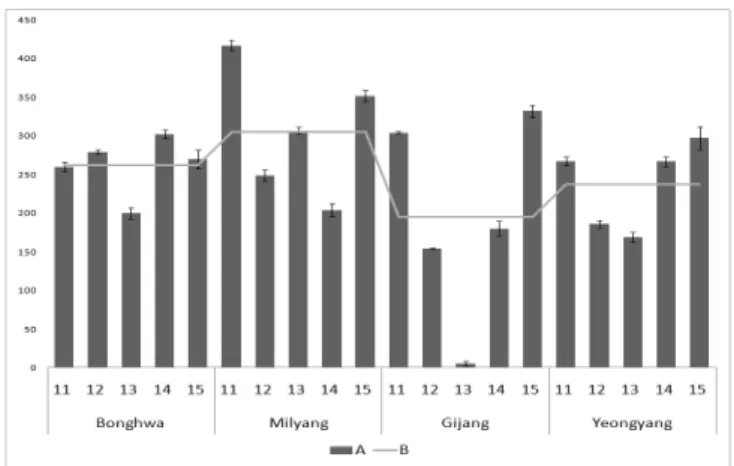
Fig. 4. Comparison of phenolic compound concentrations in common millets in four cultivation regions. Each vertical bar indicates the standard error values.
A; Total phenolic compounds in each varieties, B;
Average phenolic compounds of 5 common millets total phenolic compounds, 11; Hwanggumgijang, 12;
Bulgeungijang, 13; Norangchalgijang, 14; Jaraegijang (Pochun), 15; Jaeraegijang
In Tojingsusu, Milyang region had the highest concentration and Yeongyang region had the lowest concentrations of phenolic compounds. Hwanggumchalsusu and Whenchalsusu did not show a significant difference of phenolic compounds concentrations according to different regions. In this study, the concentrations of phenolic compounds revealed difference between Yeongyang and Gijang regions. These differences were caused by the concentration of (+)catechin. (+)Catechin had the highest concentrations in Yeongyang region and the lowest concentrations in Gijang area. However, as the production of phenolic compounds composed of complex reactions between the crops and growth conditions like average temperature, rainfall and other various factors and it is hard to select for high contained phenolic compounds varieties in cereal germplasm.
Figure 3 showed variation of phenolic compounds concent- ration in foxtail millet varieties. The foxtail millets average phenolic compounds showed similar amount in the Milyang (319.0 μg・g-1), Gijang (288.1 μg・g-1) and Bonghwa (281.9 μg・g-1) areas. The phenolic compounds of Yeongyang (246.6 μg・g-1) slightly low and that showed similar concentrations in another three regions. There was not a relationship of average phenolic compounds according to the regional difference with climate. However, it can be found the relationship with climate in Jaeraejo and Chungchajo. That two varieties showed
the highest contents of phenolic compounds in Bonghwa region.
In the comparison of climates, Bonghwa region showed 18.6 degrees of minimum temperature during seed ripening. That was 3 or more degrees lower than Milyang (21.7℃) and Gijang (21.9℃) region and also 1 or more degrees lower than Yeongyang (19.9℃) region (Fig. 1). It could be thought of phenolic compounds were associated with temperature during seed ripening.
The variation of phenolic compounds concentrations among common millet varieties was recognized (Fig. 4). The con- centration of phenolic compounds of common millet showed the range from 305.5 μg・g-1 (Milyang) to 237.2 μg・g-1 (Yeongyang). It was hard to find associate with regional phenolic compounds concentrations with temperature in common millet. However, it can be associated with precipitation in Norangchalgijang. Norangchalgijang in Gijang region had small amount of phenolic compounds concentrations, and that could be caused by rainfall. Gijang area showed the highest precipitation. Especially, more than 900 mm of rain fell in July (Fig. 1).
This results was supported by another previous study (Vetteli et al., 2002). On the other hand, some materials were not showed to significantly differences of some phenolic acids including quercetin and tannins. Another research reported that plant grown at low temperature, total concentrations of
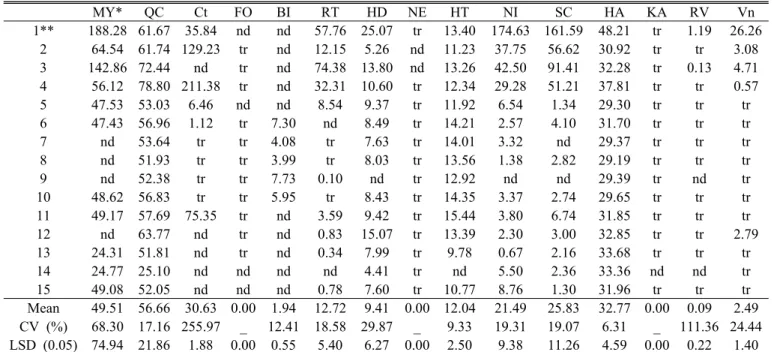
Table 2. The total phenolic compounds in Bonghwa-gun, Gyeongsangbuk-do.
GA* PA VA SA VE BA bR CA CF pC FA mC oC tC
1** nd 50.37 22.32 17.67 10.09 110.94 2.67 51.41 41.90 tr 22.24 13.77 tr 8.92 2 14.45 20.07 nd 0.92 tr 153.53 0.82 45.56 32.34 tr 15.82 tr tr 7.24 3 17.19 43.27 12.64 15.50 5.48 88.14 84.41 51.05 41.15 tr 19.63 3.18 tr 7.44 4 16.88 44.57 19.43 22.78 19.56 251.90 75.24 51.72 42.42 tr 22.37 2.50 tr 7.58 5 14.53 nd 18.20 tr tr 17.52 1.17 48.06 35.49 tr 16.41 nd tr 8.90 6 13.66 40.70 3.76 tr tr 14.53 tr 45.87 33.11 tr 15.81 nd tr 7.93 7 14.02 36.53 1.74 tr tr 20.08 tr 44.37 27.57 tr 14.60 nd nd 6.96 8 13.20 33.94 3.12 tr tr 14.82 tr 47.95 37.59 tr 14.84 tr tr 7.08 9 14.06 39.26 3.33 tr nd 7.18 tr 45.18 31.84 tr 14.92 nd tr 6.91 10 13.64 32.61 1.81 tr nd nd tr 22.17 35.35 tr 7.19 nd nd 6.96
11 nd nd 3.81 tr tr 21.28 tr 49.86 0.00 tr 7.14 nd tr 8.26
12 15.51 31.73 6.07 tr tr 6.96 3.35 46.14 27.47 tr 14.71 nd nd 7.41 13 13.29 35.36 3.06 tr tr 5.74 10.94 44.93 27.83 tr 14.44 nd nd nd 14 14.89 35.38 3.39 tr tr 7.77 2.17 44.95 27.53 tr 14.71 tr tr 7.28 15 12.81 32.26 5.43 tr tr 6.05 3.42 45.41 13.74 tr 14.15 nd tr 7.22 Mean 12.54 31.74 7.21 3.79 2.34 48.43 12.28 45.64 30.35 0.00 15.26 1.30 0.00 7.07 CV (%) 6.02 23.67 9.81 55.32 7.27 119.61 12.41 17.86 16.66 _ 24.40 29.94 _ 2.83 LSD (0.05) 1.61 16.15 1.51 4.47 0.36 123.47 3.42 17.38 10.78 0.00 7.94 0.83 0.00 0.43 GA*; Gallic acid, PA; Protocatechuic acid, VA; Vanillic acid, SA; Syringic acid, VE; Veratric acid, BA; Benzoic acid, bR; β-Resorcylic acid, CA; Chlorogenic acid, CF; Caffeic acid, pC; p-Coumaric acid, FA; Ferulic acid, mC; m-Coumaric acid, oC; o-Coumaric acid, tC; t-Cinnamic acid, nd; not detected, tr; trace, **1; Moktaksusu, 2; Tojongsusu, 3; Hwanggumsusu, 4; Hwanggumchalsusu, 5; Whenchalsusu, 6; Hwanggumjo, 7; Jaeraejo, 8; Chungchajo, 9; Whachunchajo, 10; Yeongjujo, 11;
Hwanggumgijang, 12; Bulgeungijang, 13; Norangchalgijang, 14; Jaeraegijang (Pocheon), 15; Jaeraegijang phenolic compounds during the early growth phase were lower
than that of plants grown at high temperature, but the con- centrations increased and was by 40% higher than in plants grown at high temperature (Rudikovskaya et al., 2008).
In this experiment, sorghum had significant differences of phenolic compounds concentrations by regional differences.
Especially, Moktaksusu showed bigger differences than other sorghum. That was due to the concentration of (+)catechin.
Yeongyang and Bonghwa region had much more (+)catechin than another two regions. Those Yeongyang and Bonghwa regions were had lower minimum temperature in July and August than Gijang and Milyang region. That concentration of (+)catechin in Moktaksusu was similar with Veteli.
However, chlorogenic acid was the lowest concentrations in Bonghwa region. Yeongyang region showed the highest contents and second order were Milyang and Gijang regions (Table 2-5). The Milyang, Gijang, Yeongyang region of high
concentrations chlorogenic acid were higher mean temperature than Bonghwa region. The result of this experiment was similar to that of Rudikovskaya et al., (2008), who reported relationship between phenolic compounds concentration and temperature.
When compared to phenolic compounds concentrations with climate conditions it could not found any associated with foxtail millet or common millet. On the other hand, Norangchalgijang in Gijang region has little phenolic compounds concentrations, and that could be caused by rainfall. Gijang region has the highest precipitation. Especially, more than 900 mm of rain fell in July. It can be associated with precipitation in Norangchalgijang. This results was supported by another previous study (Vallejo et al., 2003) that was the significantly reduce of phenolic compounds by increased rainfall.
Further investigation will require needed to analyze the
Table 2. (Continued)
MY* QC Ct FO BI RT HD NE HT NI SC HA KA RV Vn
1** 89.31 53.42 536.81 tr nd 10.11 12.48 tr 11.28 69.39 35.71 44.80 tr tr tr 2 51.51 53.05 nd nd nd 8.56 8.62 tr nd 12.67 0.40 31.48 tr tr tr 3 62.61 53.45 30.70 tr nd 5.14 6.14 tr 11.28 50.05 19.57 42.50 tr tr tr 4 67.97 54.80 41.43 tr 1.01 79.54 13.95 tr 11.65 53.25 25.61 31.48 tr tr 2.56 5 52.70 68.42 tr tr nd 4.44 10.50 22.53 12.50 6.88 4.09 32.06 tr tr tr 6 54.04 tr 0.35 tr 4.22 0.87 8.06 tr 11.77 2.35 nd 31.12 tr nd tr 7 51.94 54.68 tr nd 3.79 tr 7.82 tr 11.22 nd nd nd tr tr tr 8 49.63 52.87 tr tr 4.07 tr 8.22 tr 11.97 4.76 3.22 30.01 tr tr tr 9 50.91 53.03 tr tr 4.69 0.29 4.35 tr 10.97 0.47 nd 30.23 tr tr tr
10 nd 50.79 tr tr 2.31 nd 3.74 tr nd nd nd 29.91 tr nd tr
11 24.70 55.52 62.40 nd nd nd 4.34 tr 13.47 6.86 2.07 nd tr tr tr 12 nd 53.19 nd nd nd tr 12.66 tr 5.30 3.11 0.85 44.43 tr tr tr
13 nd nd tr nd nd nd nd nd nd 4.76 nd 39.41 tr nd tr
14 47.82 50.64 tr nd nd nd 3.96 tr nd 3.38 3.40 34.62 nd tr tr 15 22.16 52.75 nd nd nd nd 12.12 nd nd nd nd 41.97 nd tr 0.23 Mean 41.69 47.11 44.78 0.00 1.34 7.26 7.80 1.50 7.43 14.53 6.33 30.93 0.00 0.00 0.19 CV (%) 29.39 2.77 14.91 _ 28.34 335.73 48.28 11.18 26.84 13.90 20.21 4.84 _ _ 24.12 LSD (0.05) 26.11 2.78 14.23 0.00 0.81 51.98 8.02 0.36 4.25 4.31 2.73 3.19 0.00 0.00 0.10 MY*; Myricetin, QC; Quercetin, Ct; (+)Catechin, FO; Formononetin, BI; Biochanin A, RT; Rutin, HD; Hesperidin, NE;
Naringenin, HT; Hesperetin, NI; Naringin, SC; Salicylic acid, HA*; Homogentisic acid, KA; Kaempferol, RV; Resveratrol, Vn;
Vanillin nd; not detected, tr; trace, **1; Moktaksusu, 2; Tojongsusu, 3; Hwanggumsusu, 4; Hwanggumchalsusu, 5; Whenchalsusu, 6; Hwanggumjo, 7; Jaeraejo, 8; Chungchajo, 9; Whachunchajo, 10; Yeongjujo, 11; Hwanggumgijang, 12; Bulgeungijang, 13; Norangchalgijang, 14; Jaeraegijang (Pocheon), 15; Jaeraegijang
Table 3. The total phenolic compounds in Milyang-si, Gyeongsangnam-do.
GA* PA VA SA VE BA bR CA CF pC FA mC oC tC
1** 14.16 42.40 59.60 9.07 41.09 137.89 21.15 218.94 60.07 7.85 28.06 65.33 tr 8.27 2 14.56 38.12 18.50 10.82 21.08 105.20 0.94 56.37 41.56 tr 25.41 tr tr 7.24 3 14.23 40.45 86.20 19.39 28.54 56.28 139.85 64.16 45.35 nd 20.96 32.12 tr 7.93 4 15.75 38.67 316.00 7.55 8.94 38.85 48.40 58.18 38.32 tr 20.02 17.66 tr 7.46 5 16.47 31.11 12.10 tr 0.55 25.53 tr 54.97 37.66 nd 17.24 nd tr 7.22 6 7.33 41.55 12.60 tr tr 11.38 tr 47.52 29.78 tr 15.15 nd tr 6.94 7 13.47 30.94 4.40 tr tr 17.75 tr 45.17 27.97 tr 14.46 nd nd 7.14
8 nd 33.94 15.00 tr tr nd nd nd 29.89 tr 15.07 tr tr 7.26
9 12.97 41.08 8.30 tr nd nd tr 46.79 27.54 tr 14.56 nd tr 7.02 10 nd 34.64 15.20 tr nd 19.21 tr 44.57 27.43 tr 14.91 nd nd 7.31 11 6.61 33.07 4.70 tr 0.04 28.20 tr 54.01 13.84 tr 15.09 nd tr 8.42 12 13.62 33.65 8.60 tr 0.04 6.47 14.34 nd 13.93 tr 15.41 nd nd 8.33 13 12.86 36.87 4.10 tr 0.07 7.22 15.66 46.67 30.39 tr 14.95 nd nd 7.03 14 12.76 36.73 1.50 tr nd 9.40 0.40 22.68 14.54 tr 7.00 tr tr 3.43 15 13.69 42.58 4.60 tr 0.71 25.78 tr 52.64 27.53 tr 14.75 nd tr 6.96 Mean 11.23 37.05 38.09 3.12 6.74 32.61 16.05 54.18 31.05 0.52 16.87 7.67 0.00 7.20 CV (%) 33.73 4.60 250.34 13.29 15.89 32.56 112.21 15.91 29.70 57.79 16.35 7.39 _ 18.30 LSD (0.05) 8.33 3.75 217.59 0.95 2.44 23.69 41.27 19.11 20.51 0.69 6.13 1.30 0.00 2.92 GA*; Gallic acid, PA; Protocatechuic acid, VA; Vanillic acid, SA; Syringic acid, VE; Veratric acid, BA; Benzoic acid, bR;
β-Resorcylic acid, CA; Chlorogenic acid, CF; Caffeic acid, pC; p-Coumaric acid, FA; Ferulic acid, mC; m-Coumaric acid, oC; o-Coumaric acid, tC; t-Cinnamic acid, nd; not detected, tr; trace, **1; Moktaksusu, 2; Tojongsusu, 3; Hwanggumsusu, 4;
Hwanggumchalsusu, 5; Whenchalsusu, 6; Hwanggumjo, 7; Jaeraejo, 8; Chungchajo, 9; Whachunchajo, 10; Yeongjujo, 11;
Hwanggumgijang, 12; Bulgeungijang, 13; Norangchalgijang, 14; Jaeraegijang (Pocheon), 15; Jaeraegijang
Table 3. (Continued)
MY* QC Ct FO BI RT HD NE HT NI SC HA KA RV Vn
1** 188.28 61.67 35.84 nd nd 57.76 25.07 tr 13.40 174.63 161.59 48.21 tr 1.19 26.26 2 64.54 61.74 129.23 tr nd 12.15 5.26 nd 11.23 37.75 56.62 30.92 tr tr 3.08 3 142.86 72.44 nd tr nd 74.38 13.80 nd 13.26 42.50 91.41 32.28 tr 0.13 4.71 4 56.12 78.80 211.38 tr nd 32.31 10.60 tr 12.34 29.28 51.21 37.81 tr tr 0.57 5 47.53 53.03 6.46 nd nd 8.54 9.37 tr 11.92 6.54 1.34 29.30 tr tr tr
6 47.43 56.96 1.12 tr 7.30 nd 8.49 tr 14.21 2.57 4.10 31.70 tr tr tr 7 nd 53.64 tr tr 4.08 tr 7.63 tr 14.01 3.32 nd 29.37 tr tr tr 8 nd 51.93 tr tr 3.99 tr 8.03 tr 13.56 1.38 2.82 29.19 tr tr tr 9 nd 52.38 tr tr 7.73 0.10 nd tr 12.92 nd nd 29.39 tr nd tr 10 48.62 56.83 tr tr 5.95 tr 8.43 tr 14.35 3.37 2.74 29.65 tr tr tr 11 49.17 57.69 75.35 tr nd 3.59 9.42 tr 15.44 3.80 6.74 31.85 tr tr tr 12 nd 63.77 nd tr nd 0.83 15.07 tr 13.39 2.30 3.00 32.85 tr tr 2.79 13 24.31 51.81 nd tr nd 0.34 7.99 tr 9.78 0.67 2.16 33.68 tr tr tr 14 24.77 25.10 nd nd nd nd 4.41 tr nd 5.50 2.36 33.36 nd nd tr 15 49.08 52.05 nd nd nd 0.78 7.60 tr 10.77 8.76 1.30 31.96 tr tr tr Mean 49.51 56.66 30.63 0.00 1.94 12.72 9.41 0.00 12.04 21.49 25.83 32.77 0.00 0.09 2.49 CV (%) 68.30 17.16 255.97 _ 12.41 18.58 29.87 _ 9.33 19.31 19.07 6.31 _ 111.36 24.44 LSD (0.05) 74.94 21.86 1.88 0.00 0.55 5.40 6.27 0.00 2.50 9.38 11.26 4.59 0.00 0.22 1.40 MY*; Myricetin, QC; Quercetin, Ct; (+)Catechin, FO; Formononetin, BI; Biochanin A, RT; Rutin, HD; Hesperidin, NE;
Naringenin, HT; Hesperetin, NI; Naringin, SC; Salicylic acid, HA*; Homogentisic acid, KA; Kaempferol, RV; Resveratrol, Vn;
Vanillin nd; not detected, tr; trace, **1; Moktaksusu, 2; Tojongsusu, 3; Hwanggumsusu, 4; Hwanggumchalsusu, 5; Whenchalsusu, 6; Hwanggumjo, 7; Jaeraejo, 8; Chungchajo, 9; Whachunchajo, 10; Yeongjujo, 11; Hwanggumgijang, 12; Bulgeungijang, 13; Norangchalgijang, 14; Jaeraegijang (Pocheon), 15; Jaeraegijang
Table 4. The total phenolic compounds in Gijang-gun, Busan.
GA* PA VA SA VE BA bR CA CF pC FA mC oC tC
1** nd 36.84 45.29 7.19 22.91 56.42 tr 113.64 35.50 tr 17.91 3.10 tr 8.65 2 nd 31.85 10.62 9.59 9.59 77.97 tr 49.35 28.28 tr 18.41 tr tr 7.18 3 14.52 37.39 125.06 30.61 54.57 131.46 191.37 nd 39.00 tr 27.49 54.91 tr 7.47 4 12.72 39.25 95.26 19.96 18.71 86.60 163.73 nd 45.50 tr 21.49 36.88 tr 7.84 5 12.80 30.72 18.58 tr 1.79 11.17 tr 49.28 36.98 tr 15.61 tr tr 6.89 6 16.98 31.18 4.24 tr 1.66 18.07 tr 46.69 30.63 tr 15.63 nd tr 7.37
7 13.04 nd nd tr tr 23.62 tr nd 28.10 tr nd nd tr 7.40
8 13.76 40.65 2.26 tr tr 22.89 tr nd 27.74 tr 16.25 tr tr 7.54 9 6.47 30.17 6.19 tr tr 15.91 tr 45.36 27.74 tr 15.17 tr tr 6.92 10 6.58 32.25 16.13 tr nd 14.99 nd 45.25 29.63 tr 14.34 nd tr 6.86 11 6.36 33.03 3.32 nd nd 14.88 tr 67.70 29.74 tr 13.87 nd nd 7.97
12 13.29 33.50 2.62 nd nd nd tr 51.65 nd tr nd nd nd 7.12
13 5.57 nd nd nd nd nd nd nd nd nd nd nd nd nd
14 nd 36.37 1.97 tr nd nd 2.52 46.53 28.63 tr 14.10 nd nd 3.45 15 12.70 nd 3.52 tr nd 23.95 tr 54.86 28.44 tr 14.23 nd tr 8.43 Mean 8.99 27.55 22.34 4.49 7.28 33.20 23.84 38.02 27.73 0.00 13.63 6.33 0.00 6.74 CV (%) 51.70 5.15 4.62 85.59 58.46 46.47 39.71 6.35 2.10 _ 7.85 8.37 _ 18.78 LSD (0.05) 9.90 3.02 2.20 8.19 9.07 32.88 20.18 5.14 1.24 0.00 2.28 1.13 0.00 2.70 GA*; Gallic acid, PA; Protocatechuic acid, VA; Vanillic acid, SA; Syringic acid, VE; Veratric acid, BA; Benzoic acid, bR; β-Resorcylic acid, CA; Chlorogenic acid, CF; Caffeic acid, pC; p-Coumaric acid, FA; Ferulic acid, mC; m-Coumaric acid, oC; o-Coumaric acid, tC; t-Cinnamic acid, nd; not detected, tr; trace, **1; Moktaksusu, 2; Tojongsusu, 3; Hwanggumsusu, 4; Hwanggumchalsusu, 5; Whenchalsusu, 6; Hwanggumjo, 7; Jaeraejo, 8; Chungchajo, 9; Whachunchajo, 10; Yeongjujo, 11; Hwanggumgijang, 12; Bulgeungijang, 13; Norangchalgijang, 14; Jaeraegijang (Pocheon), 15; Jaeraegijang
Table 4. (Continued)
MY* QC Ct FO BI RT HD NE HT NI SC HA KA RV Vn
1** 63.28 59.56 29.07 tr 1.04 31.69 13.58 tr 14.82 116.87 111.80 42.51 tr 0.67 8.33 2 64.52 67.67 94.51 tr nd 5.55 10.81 tr 12.30 47.40 11.17 29.75 tr tr tr
3 69.75 83.43 47.35 tr 0.33 99.18 19.18 tr 44.72 169.14 150.86 32.94 tr 3.60 14.17 4 60.65 70.24 nd tr nd 13.57 12.70 tr 13.64 104.30 68.21 32.82 tr 0.13 0.95 5 49.04 52.95 17.92 nd nd 2.39 nd tr 11.72 6.45 0.48 31.10 tr tr tr 6 47.95 51.48 2.13 tr 5.89 1.27 7.66 tr 12.90 3.39 1.59 43.12 tr tr tr 7 nd 54.02 nd tr 4.35 1.49 nd tr 10.62 nd nd 30.95 tr tr tr 8 50.80 57.59 2.24 tr 3.43 1.13 nd tr 11.95 7.48 2.63 30.29 tr 0.61 tr 9 nd 50.11 tr tr 4.62 0.50 8.20 tr 11.96 1.49 2.03 29.74 tr tr tr 10 47.32 51.26 nd tr 2.83 0.07 7.41 tr 11.77 nd 1.91 33.86 tr tr tr 11 23.45 52.18 nd nd nd nd 7.60 tr 12.34 nd nd 31.59 tr tr tr
12 nd nd nd nd nd tr 12.47 tr nd nd 1.79 31.88 nd tr tr
13 nd nd nd nd nd nd nd nd nd nd nd nd nd nd nd
14 nd nd tr nd nd nd nd nd nd 5.41 nd 40.92 nd tr nd
15 48.30 57.35 23.41 nd nd nd 4.12 tr 11.65 6.65 1.98 32.18 tr tr tr Mean 35.00 47.19 14.44 0.00 1.50 10.46 6.92 0.00 12.03 31.24 23.63 31.58 0.00 0.33 1.56 CV (%) 25.87 5.95 124.31 _ 13.98 34.66 23.39 _ 101.80 10.64 30.49 9.25 _ 393.94 197.98 LSD (0.05) 19.30 5.99 38.27 0.00 0.45 7.72 3.45 0.00 26.09 7.08 15.36 6.23 0.00 2.80 6.59 MY*; Myricetin, QC; Quercetin, Ct; (+)Catechin, FO; Formononetin, BI; Biochanin A, RT; Rutin, HD; Hesperidin, NE;
Naringenin, HT; Hesperetin, NI; Naringin, SC; Salicylic acid, HA*; Homogentisic acid, KA; Kaempferol, RV; Resveratrol, Vn; Vanillin nd; not detected, tr; trace, **1; Moktaksusu, 2; Tojongsusu, 3; Hwanggumsusu, 4; Hwanggumchalsusu, 5;
Whenchalsusu, 6; Hwanggumjo, 7; Jaeraejo, 8; Chungchajo, 9; Whachunchajo, 10; Yeongjujo, 11; Hwanggumgijang, 12;
Bulgeungijang, 13; Norangchalgijang, 14; Jaeraegijang (Pocheon), 15; Jaeraegijang
Table 5. The total phenolic compounds in Yeongyang-gun, Gyeongsangbuk-do.
GA* PA VA SA VE BA bR CA CF pC FA mC oC tC
1** 12.61 36.83 51.42 9.94 23.01 53.19 16.73 337.52 34.05 tr 21.90 13.79 tr 7.07 2 nd 31.50 1.07 tr tr 18.23 tr 45.52 33.94 tr 14.55 tr tr 6.86 3 nd 37.39 46.55 1.02 13.64 48.21 172.71 nd 57.63 tr 23.31 16.10 tr 7.30 4 nd 38.45 65.18 36.89 24.87 78.13 225.69 nd 40.89 tr 32.45 20.67 tr 7.66
5 14.02 nd 21.70 tr nd nd nd 52.14 28.01 tr 16.18 tr tr 8.08
6 13.02 40.53 nd tr nd 13.52 tr 45.84 29.82 tr 14.96 nd tr 7.49
7 13.76 nd 1.96 tr nd nd nd nd 26.52 tr 6.94 tr nd 7.28
8 12.81 nd 12.66 tr nd 15.92 nd 45.45 28.91 tr 14.15 nd tr 8.11 9 12.87 41.82 7.44 tr tr 8.36 tr 45.28 29.72 tr 15.24 nd tr 7.77 10 5.57 36.09 13.65 tr nd nd nd 44.75 28.58 tr 14.37 nd nd 7.28
11 nd nd 6.22 nd nd nd nd 54.56 26.52 tr 14.78 nd nd 9.82
12 12.59 nd 1.13 tr nd nd tr 45.15 26.52 tr 14.33 nd nd nd
13 nd 32.00 1.88 tr nd nd 2.87 nd 26.52 tr 14.07 nd nd 6.96
14 nd 32.51 5.72 tr nd 6.57 nd 53.82 27.92 nd nd nd tr 7.40
15 25.07 32.33 3.10 nd nd 11.19 nd 64.34 26.52 tr 14.20 nd tr 8.87 Mean 8.15 23.96 15.98 3.19 4.10 16.89 27.87 55.62 31.47 0.00 15.43 3.37 0.00 7.20 CV (%) 24.99 2.26 15.71 8.06 13.23 39.66 7.01 0.87 1.24 _ 16.64 15.83 _ 3.86 LSD (0.05) 4.44 1.18 5.33 0.56 1.18 14.44 4.26 1.05 0.85 0.00 5.60 1.16 0.00 0.61 GA*; Gallic acid, PA; Protocatechuic acid, VA; Vanillic acid, SA; Syringic acid, VE; Veratric acid, BA; Benzoic acid, bR; β-Resorcylic acid, CA; Chlorogenic acid, CF; Caffeic acid, pC; p-Coumaric acid, FA; Ferulic acid, mC; m-Coumaric acid, oC; o-Coumaric acid, tC; t-Cinnamic acid, nd; not detected, tr; trace, **1; Moktaksusu, 2; Tojongsusu, 3; Hwanggumsusu, 4; Hwanggumchalsusu, 5; Whenchalsusu, 6; Hwanggumjo, 7; Jaeraejo, 8; Chungchajo, 9; Whachunchajo, 10; Yeongjujo, 11; Hwanggumgijang, 12; Bulgeungijang, 13; Norangchalgijang, 14; Jaeraegijang (Pocheon), 15; Jaeraegijang
Table 5. (Continued)
MY* QC Ct FO BI RT HD NE HT NI SC HA KA RV Vn
1** 50.92 62.50 1116.6 tr nd 22.23 9.35 tr 11.22 91.87 9.84 34.97 tr tr 40.01 2 48.29 51.89 24.10 nd nd 3.13 5.07 tr nd 12.48 11.97 nd nd nd nd 3 60.19 93.95 nd tr nd 25.47 11.47 tr 12.09 135.08 74.22 29.77 tr 0.51 tr 4 68.16 95.27 nd tr nd nd 14.39 tr 30.74 182.17 106.80 31.26 tr 0.39 10.87 5 nd 52.20 35.69 nd nd tr 15.04 tr 14.66 2.32 1.51 nd tr nd tr 6 nd 51.57 tr tr 5.64 0.54 8.29 tr 13.45 1.48 3.30 30.22 tr tr tr
7 nd 50.77 nd tr 3.51 tr 3.82 tr 11.50 nd nd nd tr tr tr
8 nd 57.14 nd tr 6.61 tr 8.23 tr 13.43 3.75 1.90 31.53 tr tr tr 9 15.79 52.42 tr tr 7.97 0.68 9.51 tr 14.51 1.68 4.20 30.88 tr nd tr 10 nd 55.45 nd tr 7.27 tr 8.36 tr nd 3.85 5.00 30.18 tr tr tr 11 nd 96.07 nd tr nd nd 10.82 tr 12.47 nd 4.05 29.74 tr nd 1.67
12 nd 56.77 24.68 nd nd tr nd tr nd nd 5.34 nd nd nd tr
13 nd 50.59 nd nd nd tr nd tr nd nd 4.92 29.08 tr nd tr
14 23.67 59.57 nd tr nd nd 3.67 tr nd 16.65 nd 29.14 tr tr tr 15 nd 57.68 nd tr nd nd 4.81 tr 11.80 2.54 5.49 29.38 tr nd tr Mean 17.80 62.92 80.07 0.00 2.07 3.47 7.52 0.00 9.72 30.26 15.90 22.41 0.00 0.06 3.50 CV (%) 72.18 10.57 6.61 _ 26.81 34.70 47.13 _ 8.64 10.24 16.54 0.83 _ 173.07 13.29 LSD (0.05) 28.82 14.50 11.53 0.00 1.25 2.63 7.77 0.00 1.84 6.75 5.74 0.41 0.00 0.23 1.01 MY*; Myricetin, QC; Quercetin, Ct; (+)Catechin, FO; Formononetin, BI; Biochanin A, RT; Rutin, HD; Hesperidin, NE;
Naringenin, HT; Hesperetin, NI; Naringin, SC; Salicylic acid, HA*; Homogentisic acid, KA; Kaempferol, RV; Resveratrol, Vn; Vanillin nd; not detected, tr; trace, **1; Moktaksusu, 2; Tojongsusu, 3; Hwanggumsusu, 4; Hwanggumchalsusu, 5;
Whenchalsusu, 6; Hwanggumjo, 7; Jaeraejo, 8; Chungchajo, 9; Whachunchajo, 10; Yeongjujo, 11; Hwanggumgijang, 12;
Bulgeungijang, 13; Norangchalgijang, 14; Jaeraegijang (Pocheon), 15; Jaeraegijang
phenolic compounds, to examine the influence of environmental and varietal variation, and to determine their significance under field conditions.
Comparison of Phenolic Compounds by Different Varieties
Among the sorghum cultivars, Moktaksusu had the highest concentration of phenolic compounds. And followed by Hwanggumchalsusu (1033.1 μg・g-1), Hwanggumsusu (1007.0 μg・g-1), Tojongsusu (526.1 μg・g-1), Whenchalsusu (342.2 μg・g-1).
The phenolic compounds of sorghums were related to the color of seed. Moktaksusu, Hwanggumsusu and Whanggeum- chalsusu had dark red color, and they had much more phenolic compounds concentrations than Tojong and Whenchalsusu.
Tojongsusu and Whenchalsusu had light yellow color (Fig. 5).
The concentration of phenolic compounds in foxtail millet
varieties, Chungchajo (335.6 μg・g-1) concentrations was the highest, and followed by Hwanggumjo (275.5 μg・g-1), Yeungjujo (179.5 μg・g-1), Whachunchajo (96.0 μg・g-1) and Jaeraejo (60.1 μg・g-1). According to the color in foxtail millet varieties, the concentration of phenolic compounds was not showed significant difference. However, when compared with the lightness, the darker varieties had higher concentration of phenolic compounds. Dark colored Chungchajo, Yeongjujo and Whanggeumjo were showed higher contents of phenolic compounds than that of light colored Whachunchajo and Jaeraejo (Fig. 6).
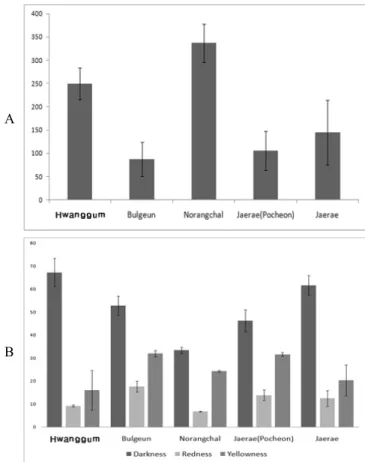
The concentration of phenolic compounds in common millet was the highest in the Norangchalgijang (337.0 μg・g-1).
Hwanggumgijang (250.0 μg・g-1) was also relatively higher contens. Next order were Jaeraegijang (144.4 μg・g-1), Jaeraegijang (pocheon) (105.6 μg・g-1), Bulgeungijang (87.1 μg・g-1). Especially, Jaeraegijang deviation was larger in the
A
B
Fig. 5. Comparison of phenolic compounds concentrations in five sorghums.
A: Phenolic compounds concentrations of each varieties (Each vertical bar indicates the standard error values.), B; The chromaticity of the samples
A
B
Fig. 6. Comparison of phenolic compounds concentrations in five foxtail millets.
A: Phenolic compounds concentrations of each varieties (Each vertical bar indicates the standard error values.), B; The chromaticity of the samples
case of varieties. And the correlation between color and phenolic compounds contents was not observed in this study (Fig. 7).
Sorghum had the highest concentration of phenolic com- pounds among three different varieties (sorghum, foxtail millet, common millet). Specially, (+)catechin (429.6 μg・g-1) con- centrations showed the highest in Moktaksusu. Moktaksusu had higher contents of (+)catechin than other sorghum cultivars.
In addition, Moktaksusu (180.4 μg・g-1) contained higher contents of chlorogenic acid. However, indivdual substances of phenolic compounds were showed significant varition according to regional differences. Tojongsusu revealed higher contents of benzoic acid (88.8 μg・g-1) and (+)catechin (62.0 μg・g-1). Hwanggum and Hwanggumchalsusu contained β -resorcylic acid, vanillic acid, salicylic acid and naringin. 5 sorghums were contained high concentrations of homogentisic acid, protocatechuic acid, chlorogenic acid, caffeic acid,
myricetin, and quercetin. Specially, p-coumaric acid, for- mononetin and biochanin A were not detected in sorghums.
The phenolic compounds concentrations in foxtail millet showed similar contents that of common millet. Every foxtail millet varieties had much higher concentration of quercetin (50.8 μg・g-1). They contained gallic acid (10.9 μg・g-1), homo- gentisic acid (28.1 μg・g-1), protocatechuic acid (30.9 μg・g-1), chlorogenic acid (35.4 μg・g-1), caffeic acid (29.8 μg・g-1), ferulic acid (13.4 μg・g-1) and benzoic acid (11.9 μg・g-1).
Also, β-Resorcylic acid, syringic acid, vanillin, p-coumaric acid, m-coumaric acid, o-coumaric acid, kaempferol and formononetin were not detected in foxtail millets.
Concentrations of phenolic compounds showed big differences among sorghums, foxtail millets, and common millets. Total phenolic compounds concentrations of sorghums were higher than that of foxtail millets and common millets. These
A
B
Fig. 7. Comparison of phenolic compounds concentrations in five common millets.
A: Phenolic compounds concentrations of each varieties (Each vertical bar indicates the standard error values.), B; The chromaticity of the samples
variations may caused by their genetic differences according to different species.
The relationship between color and phenolic compounds concentrations was similar to that of Lee et al. (2010). It was reported that the total phenolic compounds concentration in black and brown crops higher contained than that of green or yellow colored crops. In this study, sorghums and foxtail millets showed significant relationship between color and phenolic compounds concentrations. However, common millets did not significant differences of phenolic compounds according to different colors.
In case of sorghums, dark and red color varieties showed higher concentrations than others. The difference of colored sorghum and colorless sorghum showed significant differences in phenolic compounds concentrations. Foxtail millet also showed significant relationship color and phenolic compounds concentrations. Dark color varieties had higher amount of
phenolic compounds concentrations. Therefore, this factor will be used in further studies on variety selection with high contained phenolic compounds.
The contribution of phenolic compounds for human health was reported of phenolic compounds in previous study (Lee et al., 2007). In this study, sorghums had higher concentration of phenolic compounds than others (foxtail millet, common millet). Moktaksusu, Hwanggumsusu and Hwanggumchalsusu had higher concentration of phenolic compounds. According to Dykes and Rooney (2007), there was relationship between phenolic compounds and antioxidant activities. From this study, Moktaksusu, Hwanggumsusu, Hwanggumchalsusu were may have strong antioxidant activities.
Some phenolic compounds such as (+)catechin, chlorogenic acid and quercetin were well known for their specific func- tional effects. Moktaksusu, Tojongsusu and 5 common millets were had much of (+)catechin which contained special effects such as prevention of obesity and suppression of skin aging due to UV radiation (Silvina et al., 1998).
Every varieties that used in this study contained higher contents of chlorogenic acid. Chlorogenic acid had an influence on the gallstone and liver disease and was known to the cytotoxic activities (Kweon et al., 2001; Paynter et al., 2006). Large amount of quercetin was detected in all cultivars. Specially, quercetin was famous for their effects to heart disease ana various cancers (Murakami et al., 2008;
Davis et al., 2009).
In conclusion, this study suggests that variation of phenolic compounds exist among sorghums, foxtail millets and common millets in different regions. Further investigation is needed to select varieties high contained phenolic compounds under field condition and to analyze the phenolic compounds involved in biological activity which facilitate selection and breeding of varieties with high contained biofunctional compounds and biological activity.
ACKNOWLEDGEMENTS
This work was carried out with the support of “Cooperative Research Program for Agriculture Science & Technology Development (Project No. PJ006977)” Rural Development Administration, Republic of Korea.
REFERENCES
Block, G., B. Patterson, and A. Subar. 1992. Fruit, vegetables and cancer prevention: a review of the epidemiological evidence. Nutrition and Cancer 18 : 1-29.
Castelluccio, C., G. Paganga, N. Melikian, G. P. Bolwell, J. B.
Pridham, J. Dampson, and C. A. Rice-Evans. 1995. Antioxidant potential of intermediates in phenylpropanoid metabolism in higher plants. FEBS Lett. 368 : 188-192.
Davis, J. M., E. A. Murphy, M. D. Carmichel, and B. Davis.
2009. Quercetin increases brain and muscle mitochondrial biogenesis and exercise tolerance. Am. J. Physiol. 296 : 1071-1077.
Dykes, L. and L. W. Rooney. 2007. Phenolic compounds in cereal grains and their health benefits. Cereal Foods World 52 : 105-111.
Hahn, D. H., J. M. Faubion, and L. W. Rooney. 1983. Sorghum phenolic acids, their high performance liquid chromatography separation and their relation to fungal resistance. Cereal Chem.
60 : 255-259.
Harbone, J. B. and C. A. Williams. 2000. Advances in flavonoid research since 1992. Phytochem. 55 : 481-504.
Huang, M. T. and T. Ferraro. 1992. Phenolic compounds in food and cancer prevention. in phenolic compounds in food and their effects on health. II: Antioxidants and cancer prevention. American Cancer Society; Washington, DC.
507 : 8-34.
Jacob, R. A. and B. J. Burri. 1996. Oxidative damage and defense. Am. J. Clin. Nutr. 63 : 985-990.
Jones, J. M. 2006. Grain-based foods and health. Cereal Foods World 51 : 108-113.
Kehrer, J. P. 1993. Free radicals as medicators of tissue injury and disease. Critical Reviews in Toxicology 23 : 21-48.
Kil, H. Y., E. S. Seong, B. K. Ghimire, I. M. Chung, S. S.
Kwon, E. J. Goh, K. Heo, M. J. Kim, J. D. Lim, D. Lee, and C. Y. Yu. 2009. Antioxidant and antimicrobial activities of crude sorghum extract. Food Chem. 115 : 1234-1239.
Kim, E. H. S. H. Kim, J. I. Chung, H. Y. Chi, J. A. Kim, and I. M. Chung. 2006. Analysis of phenolic compounds and isoflavones in soybean seeds [Glycine max (L.) Merrill] and sprouts grown under different conditions. Eur. Food Res.
Technol. 222 : 201-208.
Kweon, M. H. H. J. Hwang, and H. C. Sung. 2001. Identifi- cation and antioxidant activity of novel chlorogenic acid derivatives from bamboo (Phyllostachys edulis). J. Agric.
Food Chem. 49 : 4646-4655.
Lee, J. Y., L. F. Wang, J. H, Kaik, and S. K. Park. 2007.
Changes in volatile compounds of green tea during growing season at different culture areas. Korean J. Food Sci. Technol.
39 : 246-254.
Lee, S. J., P. Seguin, J. J. Kim, H. I. Moon, H. M. Ro, E.
H. Kim, S. H. Seo, E. Y. Kang, J. K. Ahn, and I. M.
Chung. 2010. Isoflavones in Korean soybeans differing in seed coat and cotyledon color. Journal of Food Composition and Analysis 23 : 160-165.
Maga, J. A. 1978. Simple phenol and phenolic compounds in food flavor. Critical Reviews in Food Science and Nutrition 10 : 323-372.
Maggiolini, M., A. G. Recchia, D. Bonofiglio, S. Catalano, A.
Vivacqua, A. Carpino, V. Rago, R. Rossi, and S. Andò. 2005.
The red wine phenolics piceatannol and myricetin act as agonists for estrogen receptor in human breast cancer cells.
Journal of Molecular Endocrinology 35 : 269-281.
Murakami, A., H, Ashida, and J. Terao. 2008. Multitargeted cancer prevention by quercetin. Cancer Lett. 269 : 315-25.
Naczk, M. and F. Shaahidi. 2004. Extraction and analysis of phenolics in food. Journal of Chromato.graphy A 1054 : 95-111.
Naim, M., U. Zehavi, S. Nagy, and R. I. Rouseff. 1992.
Hydroxycinnamic acids as off-flavor precursors in citrus fruits and their products. in phenolic compounds in food and their effects on health. American Chemical Society ; Washington, DC 14 : 180-191.
Nothling, U., S. P. Murphy, L. R. Wilkens, B. E. Henderson, and L. N. Kolonel. 2007. Flavonols and pancreatic cancer risk : the multiethnic cohort study. American Journal of Epidemiology 166 : 924-931.
Paganga, G., N, Miller, and C. A. Rice-Evans. 1999. The poly- phenolic content of fruit and vegetables and their antioxidant activities. What does a serving constitute? Free Radical Res.
30 : 153-162.
Peleg, H., M. Naim, R. I. Rouseff, and U. Zehavi. 1991.
Distribution of bound and free phenolic compounds in oranges (Citrus sinensis) and grapefruits (Citrus paradisi). J. Sci. Food Agric. 57 : 417-426.
Powles, J. W. and A. R. Ness. 1996. Fruit and vegetables. and cardoivascular disease: A review. International Journal of Epidemiology 26 : 1-13.
Rebecca, J. R. 2003. Phenolic compounds in foods : An overview of analytical methodology. J. Agric. Food Chem. 51 : 2866-2887.
Rudikovskaya, E. G., G. A. Fedorova, L. V. Dudareva, L. E.
Makarova, and A. V. Rudikovskii. 2008. Effect of Growth Temperature on the Composition of Phenols in Pea Roots.
Russian Jornal of Plant Physiology 55 : 712-715.
Schindler, R. and R. Mentlein. 2006. Flavonoids and vitamin E reduce the release of the angiogenic peptide vascular endothelial growth factor from human tumor cells. Journal of Nutrition 136 : 1477-1482.
Sharma, S., J. D. Stutzman, G. J. Kelloff, and V. E. Steele.
1994. Screening of potential chemoprotective agents using biochemical markers of carcinogenesis. Cancer Res. 54 : 5848-5855.
Silvina, B., L. and G. F. Cesar. 1998. (+)Catechin prevents
human plasma oxidation. Free adical Biology and Medicine 24 : 435-441.
Stohs, H. J. 1995. The role of free radicals in toxicity and disease.
Journal of Basic and Clinical Physiology and Pharmacology 6 : 205-222.
Tan, S. C. 2000. Determinants of eating quality in fruits and vegetables. Proceedings of the Nutrition Society of Australia 24 : 183-190.
Thomas, M. J. 1995. The role of free radicals and antioxidant:
how do we know that they are working. Critical Reviews in Food Science and Nutrition 35 : 21-39.
Vallejo, F., F. A. Tomas-Barberan, and C. Garcia-Viguera. 2003.
Effect of climatic and sulphur compounds and vitamin C, in the inflorescences of eight broccoli cultivars. Eur. Food Res. Technol. 216 : 395-401.
Veteli, T. O., K. Kuokkanen, R. Julkunen-tiitto, H. Roinenen, and J. Tahvanainen. 2002. Effects of elevated CO2 and temperature on plant growth and herbivore defensive chemistry.
Global Change Biology 8 : 1240-1252.
Yao, L. H., Y. M. Jian, J. Shi, F. A. Tomas-Barberan, N.
Datta, R. Singanusong, and S. S. Chen. 2004. Flavonoids in food and their health benefits. Plant Foods for Human Nutrition 59 : 113-122.