Journal of the Korea Institute of Building Construction, Vol. 11, No. 6
http://dx.doi.org/10.5345/JKIBC.2011.11.6.538 www.jkibc.org
Strength and Autogenous Shrinkage of High Strength Mortar Using Water Substituting Liquid
1)Han, Min-Cheol Lee, Dong-Gyu*
Department of Architectural Engineering, Cheong‐ju University, Naedoekdong, Cheongju‐si, 360‐170, Korea
Abstract
This paper is to experimentally investigate the strength and autogenous shrinkage of high strength mortar with the 20 % of water‐binder ratio(W/B). In this study, the water substituting liquid(WSL) was used including gasoline, light oil, lamp oil, edible oil, HFE, ethanol, methanol and acetone in order to explore changes in strength and autogenous shrinkage depending on WSL type and replacement. For fresh properties, the replacement of WSL did not affect the fluidity of mortar mixtures considerably, except for ethanol and methanol. However, the replacement of WSL resulted in a slight decrease in flexural and compressive strength. For autogenous shrinkage, the replacement of WSL led to reduce autogenous shrinkage, and especially, the replacement of edible oil led to reduce autogenous shrinkage significantly due to saponification between edible oil and cement.
Keywords : high strength concrete, water substituting liquid, strength, autogenous shrinkage
1. Introduction
Contemporary buildings have become higher and larger in size due to overpopulation and integration of facilities. The buildings should be durable and economical so that effective construction materials are usually used like high strength concrete. Super high‐rise buildings and super long span bridges have brought such materials that help mitigate dead weight and improve durability of structures in demand. For this reason, a lot of research has been conducted[1,2].
The lower the water/cement ratio (W/C) is, the higher cement strength becomes. Since excessive use of superplasticizer can bring about concrete degradation, the use of water is indispensible[3,4].
As high strength concrete is generally used in a
Received : June 2, 2011
Revision received : October 21, 2011 Accepted : October 25, 2011
* Corresponding author : Lee, Dong-Gyu
[Tel:+82-043-229-7861, E-mail: [email protected]]
ⓒ2011 The Korea Institute of Building Construction, All rights reserved.
large quantity in the field, hydration of cement causes drying and autogenous shrinkage, which leads to cracks and deformation and greatly reduces the durability of the structure in the end[5].
There are few studies conducted to decrease the W/C by using water substituting liquid instead of reducing the amount of mixing water, and lower autogenous shrinkage and improve the performance of high strength concrete[6].
Therefore, this paper aims to ultimately verify the possibility of improving the performance of high strength mortar by analyzing the effect of WSL on the strength and autogenous shrinkage based on the high strength mortar produced by replacing some of the mixing water with water substituting liquid (not water but volatile or hydraphobic liquid, hereinafter referred to as WSL).
2. Experimental plan and method
2.1 Experimental plan
Table 1 shows the experimental plan for this
Strength and Autogenous Shrinkage of High Strength Mortar Using Water Substituting Liquid
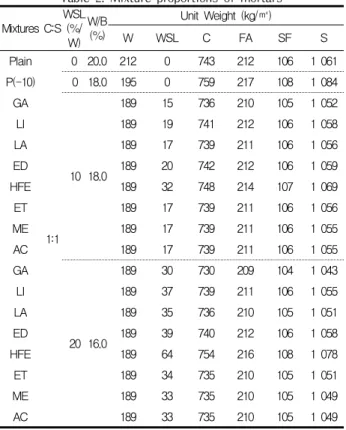
study, and Table 2 illustrates the mixture proportions of mortar.
Table 1. Experimental plan Factors Levels
Mixture
W/B(%) 1 20
C:S 1 1:1
Binder
composition 1 OPC(7) : FA(2) : SF(1) Target Flow(mm) 1 220±10
Types of WSL 10
· Plain · P(‐10)2)
· Gasoline · Light oil
· Lamp oil · Edible oil
· HFE1) · Ethanol
· Methanol · Acetone Replacement
ratio of WSL(%/W)
3 · 0,10, 20
Experi -ment
Fresh mortar 1 · Flow
Hardened mortar 3
․Compressive strength (1, 7, 28 days)
․Flexural strength(1, 28 days)
․Autogenous shrinkage 1) HFE(C4F9OCH3)[7]:Liquid for washing electronic product instead of water 2) P(-10) : water reduced mix by 10% compared with plain mix
Table 2. Mixture proportions of mortars Mixtures C:S
WSL (%/
W) W/B
(%)
Unit Weight (kg/㎥)
W WSL C FA SF S
Plain
1:1
0 20.0 212 0 743 212 106 1 061
P(-10) 0 18.0 195 0 759 217 108 1 084
GA
10 18.0
189 15 736 210 105 1 052
LI 189 19 741 212 106 1 058
LA 189 17 739 211 106 1 056
ED 189 20 742 212 106 1 059
HFE 189 32 748 214 107 1 069
ET 189 17 739 211 106 1 056
ME 189 17 739 211 106 1 055
AC 189 17 739 211 106 1 055
GA
20 16.0
189 30 730 209 104 1 043
LI 189 37 739 211 106 1 055
LA 189 35 736 210 105 1 051
ED 189 39 740 212 106 1 058
HFE 189 64 754 216 108 1 078
ET 189 34 735 210 105 1 051
ME 189 33 735 210 105 1 049
AC 189 33 735 210 105 1 049
W : water, L : Non‐water based liquids C : cement, FA : fly ash, SF : slilica fume, S : sand
First, to achieve the high strength mortar mixture (plain) with 20% of water to binder ratio (W/B), we mixed 20% of fly ash and 10% of silica by mass ratio. We designed the mixing water for the experiment by replacing it with 10% or 20% of 8 different kinds of WSL by volume ratio. P(‐10), 10%
less than the mixing water for the plain, was added as one more experimental factor.
The plain mixture is designed to meet the target flow of the paste of 220±10 mm, and a constant mixture proportion by variable was applied to verify its effect.
To confirm fluidity changes, the flow of fresh mortar was measured, and compressive strength, flexural strength and autogenous shrinkage of hardened mortar were also measured, respectively.
2.2 Materials
The cement used in this study is ordinary Portland cement manufactured by Korea . Table 3 and 4 illustrate the physical properties of the cement and the fine aggregate, respectively. In terms of the fine aggregate, the river sand from Jochiwon, Chungnam and the crushed sand were mixed at a mixing ratio of 1:1.
As for the mineral admixtures, fly ash classified and refined by Korea Midland Power Co., Ltd was used and silica fume from Norway was also used, whose physical properties are shown in Table 5 and Table 6, respectively. The polycarboxylate based superplasticizer produced in Korea whose physical properties are summarized in Table 7 was used.
As one of WSLs, HFE‐7100, a liquid for washing electronic devices was used and other WSLs are all the products manufactured and sold in Korea. The physical properties of the WSLs are shown in Table 8.
Table 3. Physical properties of cement Density(g/
㎤) Blaine
(㎠/g) Sound-
ness (%)
Setting time
(min.) Compressive strength(MPa) Initial Final 3 days 7 days 28 days
3.15 3 265 0.07 232 429 24.5 33.1 43.9
Type Density(g/㎤) Fineness modulus
Absorption ratio(%)
Unit weight (kg/㎥)
Passing amount of
0.08 mm sieve(%) River
sand 2.6 2.21 0.46 1518 0.30
Crushed
sand 2.6 3.26 0.46 1684 0.32
Density (g/㎤)
Blain (㎠/g)
L.O.I
(%) SiO2 Moisture contents
(%)
2.21 4 061 3.5 51.2 0.01
Table 5. Physical and chemical properties of fly ash
Density (g/㎤)
Blaine
(㎠/g) L.O.I(%) Chemical composition(%) SiO2 Al2O3 Fe2O3 CaO MgO 2.20 200
000 1.50 96.40 0.25 0.12 0.38 0.1
Table 6. Physical and chemical properties of silica fume
Type Basis Appearance Density
(g/㎤) High range water
reducing agent Polycarboxylate Liquid, Dark brown 1.05 Table 7. Physical and chemical properties of high range water
reducing agent
Table 8. Physical properties of WSL WSL Density
(g/㎤)
Boiling point
(℃) Properties
Gasoline 0.71 30∼200 volatility, hydrophobic
Light oil 0.88 250∼350 hydrophobic
Lamp oil 0.82 180∼250 hydrophobic
Edible oil 0.92 240 hydrophobic
HFE 1.52 61 volatility
Ethanol 0.81 78.5 volatility, hydrophilic Methanol 0.79 65 volatility, hydrophilic
Acetone 0.79 56 volatility, hydrophilic, hydrophobic
2.3 Experimental method
The mortar was mixed in accordance with KS L 5109, and the flow of fresh mortar was measured according to KS L 5105. The compressive and flexural strength was measured in accordance with ASTM C 348.
To measure the length change due to autogenous shrinkage of hardened cement, we spread a 1 mm‐
thick Teflon sheet on the floor and at both sides of
in Figure 1, which allowed the mortar to shrink without any restraint. An embedded strain gauge was installed in the middle of the specimen to measure the autogenous shrink since it was initially set at the data logger.
a) plan
b) longitudinal section
c) cross section
Figure 1. Specimen set‐up for autogenous shrinkage
At this time, the mortar specimen was removed from the mould after a day elapsed. In order to prevent possible shrinkage or expansion caused by either evaporation or absorption of moisture during the storage, polyester film and aluminum foil were used to wrap the specimen.
Eq. (1) is applied to calculate the change rate of length of autogenous shrinkage by the embedded gauge. In the equation, the coefficient of thermal expansion of the mortar was applied at the time of measurement to offset the shrinkage caused by temperature.
--- (1)
Strength and Autogenous Shrinkage of High Strength Mortar Using Water Substituting Liquid
: Actual drying shrinkage or change rate of the length of autogenous shrinkage
: Actual displacement
: Coefficient of thermal expansion (20.0×10‐6/℃) : Temperature difference
3. Results and Discussion
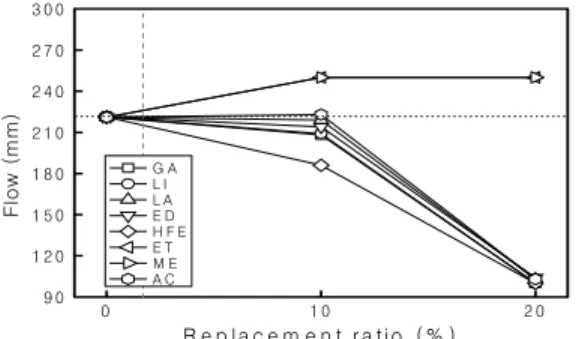
3.1 Fluidity of fresh mortar
Figure 2 and 3 illustrate the replacement rate of WSL, and the flow by type. First, in terms of flow, plain mixture met the target flow, but P(‐10) was shown to be slightly lower than plain mixture. Overall, the flow values did not show any significant differences among specimens at the 10% replacement rate.
However, the flow values drastically decreased among most specimens at the 20% replacement rate except for those with ethanol and methanol, which can be interpreted that since the WSLs used in this research have the volatile and hydrophobic properties, which make the fluidity of most specimens reduced greatly.
0 1 0 2 0
9 0 1 2 0 1 5 0 1 8 0 2 1 0 2 4 0 2 7 0 3 0 0
Flow (mm)
R e p la c e m e n t ra tio ( % )
G A L I L A E D H F E E T M E A C
Figure 2. Flow corresponding to WSL kinds and contents
0 2 0 4 0 6 0 8 0 1 0 0 1 2 0 1 4 0 1 6 0
Flow ratio (%)
R e p la c e m e n t 1 0 % R e p la c e m e n t 2 0 %
P - 1 0 G A L I L A E D H F E E T M E A C
Figure 3. Flow ratio for plain mixture corresponding to various WSL types
The flow was decreased in the order of acetone, lamp oil, edible oil, light oil, gasoline, and HFE at the 10 % of replacement rate, while the specimens with ethanol and methanol increased compared to plain mixture. In addition, the specimens with ethanol and methanol did not show any decrease in flow compared to plain mixture at the 20% of replacement rate, while the rest of the specimens showed great decrease in flow compared to plain mixture. It is believed that ethanol and methanol have the polar hydroxyl groups (-OH) in the molecules, and they easily dissolve into the mixing water, which helps regain as much liquid as it was replaced and improve its fluidity as the result[8].
On the other hand, since all kinds of the hydrophobic liquid did not mix well with the specimen, the fluidity seemed to deteriorate.
However, acetone has all of hydrophobic, hydrophilic and volatile properties. Therefore, when it is used in a small amount, it turns hydrophilic, but when it is used in a large amount, it turns hydrophobic[9]. It is confirmed that at the 10% of replacement rate, acetone’s hydrophilic property helped increase the water demand, and the fluidity improved accordingly, whereas at the 20% of replacement rate, its hydrophobic property made the fluidity lower greatly.
HFE is usually used as liquid for washing electronic devices due to its strong volatility and making products not getting wet. Its strong volatility and insolubility caused the flow to decrease greatly even at the 10% of replacement rate.
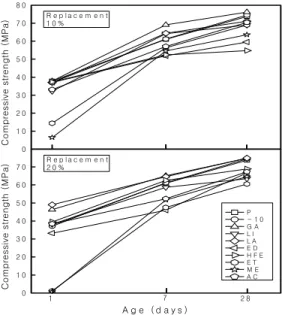
3.2 Strength Development
Figure 4 shows the compressive strength with age by WSL type and replacement rate and Figure 5 illustrates the compressive strength ratio compared to that of plain mixture by age.
First, in terms of the compressive strength, plain mixture had 37 MPa, 61 MPa, and 73 MPa at 1 day, 7 days and 28 days, while P(‐10) had 38 MPa, 62
overall compared to that of plain mixture. This may be due to the fact that the decrease in W/B caused by the decreased water demand helped increase the compressive strength.
In terms of strength, the specimens with the 10%
of light oil, HFE, acetone, or edible oil were similar to plain mixture, while the specimens with gasoline and lamp oil as much showed an increase by 8 MPa~10 MPa compared to plain mixture. However, the specimens with ethanol and methanol showed a great decrease compared to plain mixture, which may be resulted from the retardation of early cement hydration that alcohol is combined with Ca2+
ions in cement matrix in the process of hydration reaction [8]
On the other hand, in terms of strength, the specimens with the 20% of gasoline, lamp oil, edible oil and HFE were similar to plain mixture while the specimens with other WSLs decreased by approximately 6 MPa~32 MPa. In addition, although the specimens with ethanol and methanol appeared similar in strength to plain mixture at 7 days, the specimens with other WSLs decreased compared to plain mixture.
0 1 0 2 0 3 0 4 0 5 0 6 0 7 0 8 0
0 1 0 2 0 3 0 4 0 5 0 6 0 7 0
R e p l a c e m e n t 2 0 % R e p l a c e m e n t 1 0 %
Compressive strength (MPa)
P - 1 0 G A L I L A E D H F E E T M E A C 7 2 8
Compressive strength (MPa)
A g e ( d a y s ) 1
Figure 4. Compressive strength with age
0 2 0 4 0 6 0 8 0 1 0 0 1 2 0
Compressive strength ratio (%
0 2 0 4 0 6 0 8 0 1 0 0 1 2 0 1 4 0
Compressive strength ratio (%)
7 d a y s
0 2 0 4 0 6 0 8 0 1 0 0 1 2 0 1 4 0
Compressive strength ratio (%)
2 8 d a y s
P - 1 0 G A L I L A L E H F E E T M E A C
Figure 5. Compressive strength ratio for plain mixture corresponding to WSL kinds and contents
On the other hand, at 28 days the specimens with the 10% of gasoline and lamp oil showed a slight increase in strength compared to that of plain while the specimens with other WSLs showed a decrease in strength by approximately 6 MPa~13 MPa.
In addition, a similar tendency was shown between at the 10% and at the 20% of replacement rate because when water is replaced with one of WSLs, the WSL that has volatile property including gasoline, light oil, lamp oil and HFE vaporizes a little in the fresh mortar, but is captured in the pores in the hardened mortar without being hydrated, which may prevent the WSL from decreasing the W/B. As already reported in the previous study[8,9], ethanol, methanol and acetone that have hydrophilic property and retard strength development barely have the effect on decreasing the W/B.
Strength and Autogenous Shrinkage of High Strength Mortar Using Water Substituting Liquid
Figure 6 shows the flexural strength with age by replacement rate and type of WSL, and Figure 7 illustrates the ratio of flexural strength of the specimen using WSL and plain mixture at 1 day and 28 days, respectively. Plain mixture showed 12 MPa and 27 MPa at 1 day and 28 days, while P(‐10) mixture showed 13 MPa and 23 MPa, respectively.
On the other hand, in terms of the flexural strength, the specimens with the 10% of WSLs except for edible oil, HFE and ethanol appeared similar to plain mixture. In addition, the specimens with the 20% of WSLs except for edible oil and HFE also appeared similar to plain mixture, while the specimens with edible oil and HFE decreased by 4~5 MPa. The flexural strength tends to be complexly affected by compressive strength, tension and length change of autogenous shrinkage. As shown in the previous study [10], the flexural strength is greatly affected by the autogenous shrinkage. And it is found that the less the autogenous shrinkage, the higher the flexural strength.
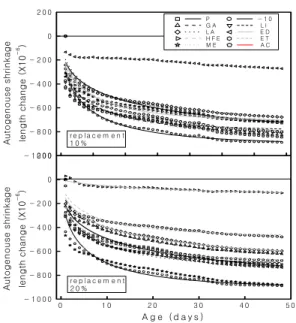
3.3 Autogenous shrinkage of hardened mortar Figure 8 shows the results of autogenous shrinkage with age by WSL type and replacement
0 5 1 0 1 5 2 0 2 5 3 0
1 2 8
0 5 1 0 1 5 2 0 2 5
R e p l a c e m e n t 2 0 % R e p l a c e m e n t 1 0 % P - 1 0
G A L I L A E D H F E E T M E A C
Flexural strength (MPa)Flexural strength (MPa)
A g e ( d a y s )
Figure 6. Flexural strength with age
0 2 0 4 0 6 0 8 0 1 0 0 1 2 0 1 4 0 1 6 0
Flexural strength ratio (%)
R e p la c e m e n t 1 0 % R e p la c e m e n t 2 0 % 1 d a y
0 2 0 4 0 6 0 8 0 1 0 0 1 2 0 1 4 0
Flexural strength ratio (%)
2 8 d a y s
P - 1 0 G A L I L A L E H F E E T M E A C
Figure 7. Flexural strength ratio for plain mixture corresponding to WSL kinds and contents
- 1 0 0 0 - 8 0 0 - 6 0 0 - 4 0 0 - 2 0 0 0 2 0 0
0 1 0 2 0 3 0 4 0 5 0
- 1 0 0 0 - 8 0 0 - 6 0 0 - 4 0 0 - 2 0 0 0 2 0 0
r e p la c e m e n t 2 0 %
P - 1 0
G A L I
L A E D
H F E E T
M E A C
Autogenouse shrinkage length change (X10-6 )
r e p la c e m e n t 1 0 %
Autogenouse shrinkage length change (X10-6 )
A g e ( d a y s )
Figure 8. Autogenous shrinkage with age
rate, and the analysis result of the measurements of autogenous shrinkage using the JCI model, and the numerical equation is shown as Eq.(2)[11].
Figure 9 shows the ratio of autogenous shrinkage of the specimens adding WSL and plain mixture at 7, 14 and 49 days. Table 9 shows the results of regression analysis of autogenous shrinkage by the JCI model.
where, εc(t) : autogenous shrinkage deformation rate at an age of t days (×10‐6)
ε∞(W/B)=3070exp(‐7.2(W/B))(0.2≤W/B≤0.5) β(t) = 1‐exp(‐a(t‐t0)b)
γ : influence coefficient depending on cement and agent
a, b : contants depending on W/B t0 : time of initial setting (day)
In terms of autogenous shrinkage, plain mixture was measured at ‐728×10‐6 at 49 days, while P(‐10) with a low W/B was measured at ‐890×10‐6, which is the highest in value among mixtures.
In terms of the autogenous shrinkage by WSL and replacement rate, the higher the replacement rate, the lower the autogenous shrinkage value. This may be resulted from the residue of WSL within pores of the cement matrix that causes shrinkage reduction and consequently weakens capillarity pressure, or the property that some WSLs tend to retard setting.
What is more notable is that the specimen with the 10 % of edible oil was measured at ‐272×10‐6, while
Plain P(-10)
Gasolin Light oil
Lamp oil Edible o
il HFE
Ethanol Me
thanol Aceton
0 2 0 4 0 6 0 8 0 1 0 0 1 2 0 1 4 0
Autogenous shrinkage length change ratio(%)
4 9 d a y s
P - 1 0 G A L I L A E D H F E E T M E A C
P l a i n P (- 1 0 ) G a s o li n L i g h t o il L a m p o i l E d ib le o i l H F E E t h a n o l M e th a n o l A c e to n
0 2 0 4 0 6 0 8 0 1 0 0 1 2 0 1 4 0 1 6 0
Autogenous shrinkage length change ratio(%)
1 0 % /W 2 0 % /W
7 d a y s
Figure 9. Autogenous shrinkage ratio for plain mixture corresponding to WSL kinds and contents
Replacement
ratio(%) Factors Regression coefficients
γ a b R2
Plain ‐1.256 0.279 0.445 0.927
P(-10) ‐1.147 0.407 0.555 0.893
10
GA ‐1.101 0.445 0.459 0.853
LI ‐1.009 0.448 0.535 0.867
LA ‐0.890 0.326 0.561 0.934
ED ‐6.394 0.021 0.238 0.811
HFE ‐0.910 0.374 0.591 0.915
ET ‐1.116 0.382 0.459 0.889
ME ‐0.945 0.419 0.485 0.875
AC ‐1.143 0.442 0.443 0.849
20
GA ‐0.762 0.286 0.518 0.943
LI ‐0.775 0.391 0.568 0.905
LA ‐0.832 0.364 0.538 0.916
ED ‐0.135 0.084 0.819 0.915
HFE ‐0.757 0.255 0.522 0.954
ET ‐0.757 0.392 0.544 0.902
ME ‐0.518 0.300 0.630 0.920
AC ‐1.011 0.466 0.448 0.836
the specimen with the 20 % of edible oil at ‐105×10‐6, which are 70~80 % lower in autogenous shrinkage compared to plain mixture. It is believed that the fatty acid, the main ingredient of edible oil, reacted with calcium hydroxide in hardened cement through hydrolysis, and produced calcium salts of fatty acid.
Such reactants filled the capillary pores and consequently weakened the capillary pressure that could affect the autogenous shrinkage[12].
From the analytic result of autogenous shrinkage, Table 9 showed the prediced values, which are similar to the measured ones.
In comparison with plain mixture, the specimen with edible oil that showed the best autogenous shrinkage reduction was measured to be 37.4 % and 15.4 % at the 10 % and 20 % of replacement rate, respectively, at an age of 49 days. All the specimens except for those with acetone and lam oil less shrank at the 20 % of replacement rate than at the 10 % of replacement rate.
Figure 10 shows the results of comparative analysis of autogenous shrinkage at 10% and 20% of replacement rate. It is found that the higher the replacement rate was, the less autogenous shrinkage
Strength and Autogenous Shrinkage of High Strength Mortar Using Water Substituting Liquid
happened overall.
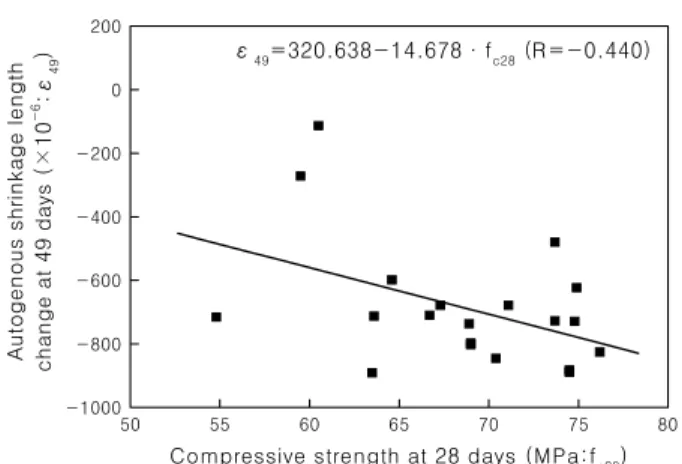
Figure 11 illustrats the relationship between the compressive strength at 28 days and the autogenous shrinkage value at 49 days. Overall, the higher the compressive strength, the higher the augogenous shrinkage.
As a way of achieving high strength concrete, the repalcement of WSL by the mixing water was studied. In terms of strength, it is hard to expect drastic improvement in strength due to the volatility and retarding property of WSL. However, in terms of autogenous shrinkage of high strength concrete, vegetable oil including edible oil showed a considerable effect on autogenous shrinkage reduction.
- 9 0 0 - 7 0 0 - 5 0 0 - 3 0 0 - 1 0 0 1 0 0
- 9 0 0 - 7 0 0 - 5 0 0 - 3 0 0 - 1 0 0 1 0 0
Replacement 20%
R e p l a c e m e n t 1 0 %
y = 1 3 0 .7 8 + 1 .0 8 x ( R = 0 .9 0 2 )
Figure 10. Relationship of replacement ratio of WSL on autogenous shrinkage
50 55 60 65 70 75 80
-1000 -800 -600 -400 -200 0 200
ε49=320.638-14.678·fc28 (R=-0.440)
Autogenous shrinkage length change at 49 days (×10-6:ε49)
Compressive strength at 28 days (MPa:fc28)
Figure 11. Relationship of autogenous shrinkage and compressive strength
4. Conclusions
In this study, tests were conducted to investigate the effect of WSL on the engineering and autogenous shrinkage characteristics of high strength mortar. The results are drawn as follows:
1) In terms of flow, overall specimens were shown to be similar to or slightly lower compared to plain mixture at a 10% of replacement rate.
However, all the specimens except for those with ethanol and methanol were shown to be greatly lower that plain mixture since most of WSL agents were the hydrophobic and were not easily absorbed in mortar.
2) In terms of the compressive strength by WSL type and its replacement rate, all the specimens except for those with methanol and ethanol showed a higher strength than plain mixture at an early age. However, all the specimens except for those with gasoline and lamp oil showed a 10%‐20% decrease in strength compared to plain mixture at 28 days.
It is found that as the compressive strength increased, the flexural strength increased accordingly, standing at 1/3‐1/4 of compressive strength.
3) In terms of autogenous shrinkage, as the replacement rate of WSLs increased, the autogenous shrinkage appeared decreasing. It is believed that WSL agents had properties of the shrinkage reduction and retardation of setting.
4) When edible oil (vegetable oil) was replaced, the autogenous shrinkage decreased by 70‐80%
compared to plain mixture. It is considered that the fatty acid in the edible oil reacted with calcium hydroxide in hardened cement through saponification. The reactants generated in the reaction filled the capillary pores in the
to be weakened as a result.
This study was conducted to understand the engineering and autogenous shrinkage characteristics of high strength mortar by replacing some mixing water with WSL for high strength mortar and to ultimately improve concrete properties. Although WSLs barely contribute to improvement of strength, it is confirmed that vegetable oil can be expected to reduce autogenous shrinkage considerably. Further studies should be done to facilitate the vegetable oil to be mixed well with mortar and to reduce the autogenous shrinkage within the extent applicable to practical use in the future.
References
1. Terauchi R, Hayakawa M, Jinnai H, Watanabe S. Basic study on test age and curing method of specimens for manufacturing control of high strength concrete. Journal of Structural and Construction Engineering. 2008 Nov;73(633):1899-1906.
2. Yang DI, Kim JM, Gong MH, Jung SJ. An Experimental Study For Basic Property of Ultra High Strength Concrete.
Journal of the Architectural Institute of Korea. Structure &
Construction. 2006 Sep;22(9):99-106.
3. Han CG, Han MC, Lee DG. Added AE Water Reducing Agent on Physical Properties of the Concrete, Journal of The Korea Institute of Building Construction, 2008 Feb;2(27):91-6.
4. Lee JG, Park KS, Kim SY, Jang MG, Kim HJ. The Fundamental Study on the decision of the weight of water required to cement hydration. Proceedings of The Korean Society of Agriculture Engineers Conference; 2000 Oct. Seoul (Korea): The Korean Society of Agriculture Engineers; 2000.
p. 266-71
5. Kang H, Ahn JM, Shin SW. Mechanical and Mixing Properties of Ultra-high Strength Concrete with fck=150MPa. Journal of the Korea Institute of Building Construction. 2010 Mar;10(3):113-20.
6. Han CG, Hwang YS, Kim KS, Kim YD. Influence of Unit Water Content on the Durability and Properties of Fresh Concrete. Journal of the Architectural Institute of Korea.
Structure & Construction. 2003 Apr;19(4):129-36.
7. 3M, Novec 71DA Engineered Fluid, Product Information.
SRA&type=p&snum=10&type=p&co=ptn&msdsLocale=en_us&
q=novec&num=10&start=20
8. Kang SM, Kang HJ, Song MS, Park PH. A Study on the Early Hydration-Retarding Mechanism of Polymer Modified Cement. Proceedings of the Korea Concrete Institute; 2009 may 29; Hanyang university. Seoul (Korea): Korea Concrete Institute; 2009. p. 221-2.
9. Park CW, Kim HD. Graft Copolymerization of Methyl Methacrylate on Sodium Alginate in the Acetone-Water Solution of Various Compositions by Hydrogen Peroxide (Ⅱ), Polymer(Korea), 1982 Oct;6(5):294-304.
10. Safat A, Gianluca R, Zora V. Shrinkage effects on the flexural stiffness of composite beams with solid concrete slabs: An experimental study. Engineering Structures. 2011 April;33 (4):1302-15.
11. Ei-ichi T, Shingo M. Prediction Model for Shrinkage of Concrete Including Autogenous Shrinkage, Proceedings of Sixth International Conference.; in: F.-J. Ulm, Z.P.
Bazant, F.H. Wittmann, Editors, Creep, Shrinkage and Durability Mechanics of Concrete and Other Quasi-Brittle Materials.: Elsevier Science Ltd.; 2001. p. 735–46.
12. Lee CS, Pack JH. Relation between Autogenous Shrinkage of Concrete and Relative Humidity, Capillary Pressure, Surface Energy in Pore, Journal of the Korea Concrete Institute. 2008 Apr;20(2):131-8.