J Korea Industr Inf Syst Res Vol.19 No.1, 2014 http://dx.doi.org/10.9723/jksiis.2014.19.1.043
Comparison of Characteristics of P-Wave Detection in ECG with
Wireless Patch Electrodes
Young Chang Cho
*, Min Soo Kim
**, and Jeong Oh Yoon
***Abstract P-wave characteristic in the human electrocardiogram (ECG) is important in the diagnosis of atrial conduction pathology. In this paper, we measured an ECG signal from patient with cardiovascular disease using one lead ECG electrode system which is based on the wireless cardiac monitoring system. And we detected a P-wave in ECG signal using the complex-valued continuous wavelet transforms (CWT) according to two kinds of patch type electrodes such as an existing narrow patch type electrode and the improved wide patch type electrode presented in this paper. Also, we compared the characteristics in detecting the P-wave in terms of the magnitude and the width of P-waves. From the results of comparison we found that the width and the magnitude of P-wave detected using the wide patch type electrode is improved to be interpreted easier compared to those using the narrow patch type electrode. Furthermore, we have also proven that the complex-valued CWT can be used as a robust detector for P-wave in ECG signal analysis.
Key Words : P-wave; electrocardiogram (ECG); wireless patch type electrode; one lead;
complex-valued continuous wavelet transform (CWT)
1. Introduction
†The analysis of the electrocardiogram (ECG) is a well-known non-invasive technique to detect the electrical heart activity. Abnormal heart cycle is reflected in the ECG by P-wave, QRS complex and T wave. Several clinical studies connect certain P-wave properties such as its width and morphology, with anomalies in the electrical atrial conduction and atrial pathology. The relation between the P-wave morphology and the interatrial delay has been studied in [1, 2]. Recently, it has
* 경운대학교 항공정보통신공학과, 제1저자
** 경운대학교 항공정보통신공학과, 제2저자
*** 경운대학교 항공정보통신공학과, 교신저자 (e-mail:[email protected])
been clearly verified how P-wave morphology depends upon which of three interatrial routes the conduction from right to left atrium has utilized [3].
The analysis of the P-wave obtained from Frank
leads and its relation to atrial fibrillation is reported
in [4-6]. The magnitude and width of the P-waves
are smaller than those of the QRS complexes and
T waves, So their study requires more sophisticated
computation techniques. In order to improve the
performance in obtaining the P-wave, a different
approach such as using the wide patch type
electrode is needed. The patch type electrode
constantly records the heart’s electrical activity and
is designed to be worn comfortably during normal
daily activities, including sleep. The ease of use and
inconspicuousness of the patch electrode helps
increase the likelihood that a patient will wear the device for the entire prescribed monitoring period.
Patch ECG electrode system offers patient friendly, non-obtrusive, electrode and lead wire free recording environment. In addition to monitoring one lead ECG signal[7, 8], patch electrode also monitors the contact impedance, providing real time information on the sensor contact quality.
But, it is difficult to observe the P-wave with the existing narrow patch type electrode because the size of the electrode is not sufficient to measure P-wave obviously which is usually small both in magnitude and in width relative to other signal components such as R-wave and T-wave. So, it is necessary to use an additional method to enhance the magnitude and width of P-wave to be detected accurately.
The CWT can decompose a signal into the whole range of scales and positions[9-11], instead of a subset of discrete values as in DWT, which can help disclose more detail information. Usually, the DWT leads to a less redundant decomposition, which makes it efficient to compress and reconstruct a signal or image. Independent to the P-wave width measurements, morphologic analyses have been implemented in the assessment of P-wave characteristics. Hence the CWT is appropriate for an analysis of the P-wave detection.
In this paper, we presented the wireless one lead wide patch type electrode to improve the morphology of P-wave. And we proposed the continuous wavelet transform (CWT) based approach to extract useful properties such as the edge and high frequency information in morphology of P-wave for detection.
2. Materials and Methods
For the chronic patients with cardiovascular disease who live alone, it is necessary to constantly monitor their physiological parameters, especially the
ECG, to effectively prevent and control their health conditions. The one lead ECG signal is recorded using two kinds of electrodes. Human ECG transmission has been particularly useful for wireless cardiac monitoring system. Nowadays, the infrastructure of RF and mobile phone systems has opened a new transmission medium which establishes access to many database at very low costs[12, 13].
Real-time ECG transmission via mobile phone system has been important in order to provide a direct access to doctors in remote area.
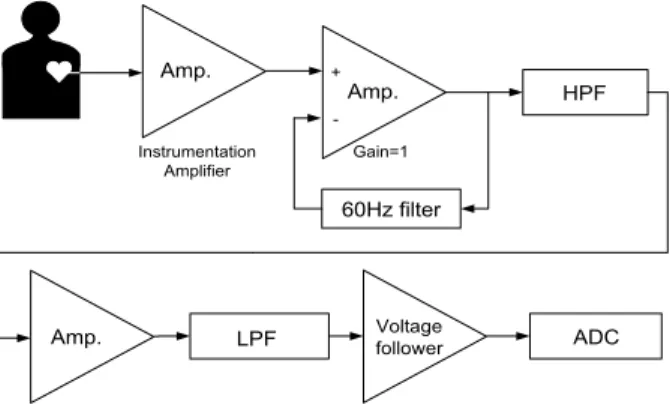
In this paper we use the real-time ECG analog circuit signal acquisition system as shown in Fig. 1.
The ECG signal is sampled at a rate of ㎐.
Instrumentation Amplifier
Amp.
Amp.
Gain=1
HPF
+
60Hz filter
-
Amp. LPF Voltagefollower ADC
Fig. 1. Block diagram of ECG acquisition system
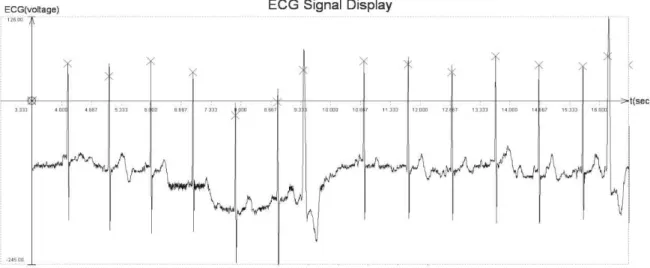
We use a typical example of a discrete-time ECG
signal as shown in Fig. 2. Being a non-stationary
signal, the ECG has irregularities, although they
may not be periodic and may show up at different
intervals.
(a) Standard ECG beat
(b) ECG signals measured using the narrow patch type electrode
(c) ECG signals measured using the wide patch type electrode
Fig. 2. Standard ECG beat and the measured ECG signals
Fig. 2. shows the waveforms of measured ECG signals. As seen in Fig. 2(b), the waveform of P-wave in ECG measured by the narrow patch type electrode is narrow in width and small in magnitude compared to the case of the wide patch type electrode shown in Fig. 2(c).
2.1 Continuous Wavelet Transforms
The wavelet transform technique is appropriate for studying non-stationary signals. It represents the time-domain signals over different scales, enabling an identification of both large-scale (low frequency) and small-scale (high-frequency) fragments. The CWT does this by having a variable window width, which is related to the scale of observation. Any signal can be decomposed into a set of base functions
which are called the wavelets. The Continuous Wavelet Transform is
obtained by formula [14]:
∞∞
(1)
where * denotes complex conjugation. The variables and denote scale and translation. The wavelets are generated from a single base wavelet
, the so-called mother wavelet, by scaling and translation:
(2)
In Eq.(2), is the scale factor, is translation factor and the factor is for energy normalization across different scales. Generally speaking,
is obtained by the following process: the basic wavelet (with scale ) is shifted along the signal and for each value of time shifting the Eq.(1) is computed, then the wavelet window is stretched by factor (the width of the wavelet window is increased times) and again shifted along the signal. This process can be repeated over and over again. The larger scale the lower frequency components that are treated.
The advantage of CWT over other time-frequency transformations is that the CWT is not limited to using sinusoidal analyzing functions.
Rather, a large selection of localized waveforms can be employed as long as they satisfy predefined mathematical criteria. Coefficients of the CWT are denoted as for particular scale(s) and translation(). Scale can be treated as frequency, and translation as time, but considering that larger scales represent the lower frequencies.
Wavelets are basis functions used for expansion.
They are characterized by a number of properties
that determine their use in the frame of
time-frequency localization. Formally, a real-valued
function is called a wavelet if it satisfies two
constraints defined by
∞∞ and
∞∞
(3)
The first part of Eq.(3) states that the wavelet oscillates, the second part says the wavelet must be non-zero somewhere. The properties of wavelets may serve as a key for selection of function for a specific application. Filtering may require symmetrical functions and rational coefficients of filters corresponding to wavelets. The following properties are most discussed in literature:
orthogonality, compact (finite) support, rational coefficients of corresponding filters, symmetry, smoothness, and analytic expression [15, 16].
2.2 Real-valued wavelets
The most used and/or discussed real-valued wavelets are Haar wavelet, a family of Daubechies wavelets, Morlet wavelet, Meyer wavelet, Mexican hat wavelet, a family of Coiflet wavelets, family of Symlet wavelets, and biorthogonal wavelets. The time and frequency resolution of various wavelets differ. The ideal resolution value is represented by an equality curve
.
The results for selected wavelets can be acquired by G. Mallat [12].
2.3 Complex-valued wavelets
The complex-valued wavelets are Complex Gaussian wavelets, Complex Daubechies wavelets, Complex Kingsbury wavelet, Complex Morlet wavelets, Complex Frequency B-spline wavelets, Complex Shannon wavelets. Time and frequency resolution of various complex-valued wavelets differ too. Complex-valued wavelet transform plays a special role in signal analysis. Complex nature of wavelets provides further improvement in signal detection compared to real-valued wavelet analysis.
This is possible by using so called the dual-tree processing through cross-correlation with real and
imaginary parts of wavelets. And the processed complex-valued time-frequency image (CWT) can be further analyzed by detection of significant attributes in its modulus and phase. In this way, not only the waves can be detected but also various shapes of the waves can be distinguished.
3. Results
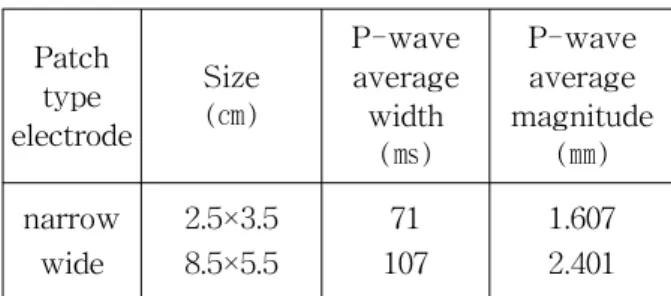
Table 1 shows the comparison of characteristics of P-wave for two kinds of patch type electrodes.
The greatest advantage of the patch type electrode is that it's simply designed to use.
P-wave obtained by the improved wide patch type electrode has wider in width and larger in magnitude than that of the conventional narrow patch type electrode.
Patch type electrode
Size (㎝)
P-wave average width
(㎳)
P-wave average magnitude
(㎜) narrow
wide
2.5×3.5 8.5×5.5
71 107
1.607 2.401 Table 1. Comparison of characteristics of P-wave
for electrode types
Wide patch type electrode improves not only the
waveform of P-wave but also the baseline drift to
make the detection of P-wave easy to be
interpreted. We proposed a method to assist to
detect the extracted waves effectively, such as
P-wave and R-wave in ECG signal. In the discrete
wavelet transform (DWT), the wavelet coefficients
for scale 1 to 7 is calculated by passing the
previous approximation coefficients through the high
and low pass filters. According to the power
spectra of ECG signal the energies of P-waves are
mainly at scale levels 4, 5 and 6. But, baseline drift
is serious at scale 7, so reconstruction coefficients
Fig. 3. Example of ECG after the R-wave detection for narrow patch type electrode
(a) orignal signal
(b) DWT signal
Fig. 4. Detection of P-wave in ECG using DWT for narrow patch type electrode d5 is selected to detect P-waves.
From Fig. 3, we see that it is difficult to observe P-wave from the original ECG signal, because the magnitude of P-wave in abnormal ECG is too low and flat. The ECG signal shown in Fig. 4 and Fig.
5 are abnormal signals obtained from the patients with a cardiac arrhythmia using the narrow patch
type electrode and wide patch type electrode respectively. In the patch type electrode, P-wave is reconstructed with the sum of scale 5 and scale 6 by db5 family. From narrow patch type electrode, P-wave detected with the combined wavelet (D5+D6) by db5 is shown in Fig. 4.
Fig. 5 shows that it is a little easier to observe
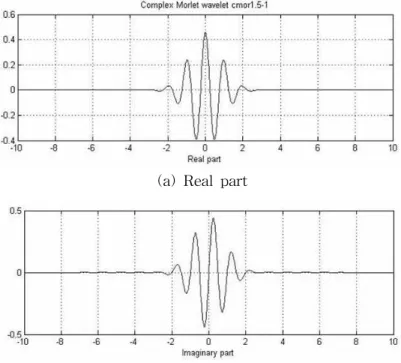
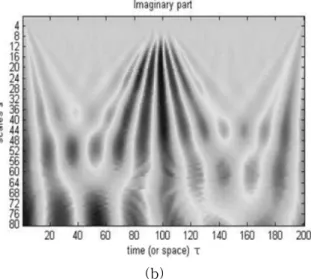
(a) Real part
(b) Imaginary part
Fig. 6. Complex Morlet wavelet No.1-0.5.
(a) orignal signal
(b) DWT signal
Fig. 5. Detection of P-wave in ECG using DWT for wide patch type electrode
the P-wave in abnormal ECG signal using the wide patch type electrode. Real and Imaginary part of
Morlet 1-0.5 wavelet used in CWT are shown in
Fig. 6. We can see the difference of the shape of
(a) (b)
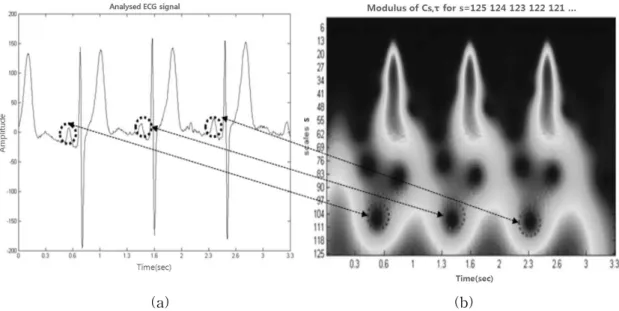
(c) (d)
Fig. 7. Results of CWT from two cycle ECG signal using complex Morlet wavelet No.1-0.5. (a) Absolute value of real part and (b) imaginary part of modulus (c) Detail of the ECG signal for narrow ECG electrode type (d) its modulus
the wavelet basis functions which yields different results in the CWT output representation.
Modulus of time-frequency image (see Fig. 7) displays P-wave as a single peak centered at
.
The difference between two modulus, the real part and the imaginary part of the CWT are below discussed on detail of the analyzed signal (Fig.
7(a)-(b)) from narrow patch type electrode. Modulus of time-frequency image (see Fig. 7(d)) displays
P-wave as a single peak centered at sec
and . Note that the basis wavelet functions are well suited for detecting and localization. In ECG the edge and high frequency information are of paramount importance.
The modulus of CWT using complex Morlet wavelet is shown in Fig. 8. The CWT is indicative of multiple or propagated sources within the heart making respective changes in the measured ECG.
This decomposition throws light into the regions of
(a) (b)
Fig. 8. Results of CWT using complex Morlet wavelet No.1-0.5 (a) signal with P-wave in first derivative from wide type electrode (b) its modulus
temporal energy concentrations thus giving an indication of the center of such energy. It may be noted that the Fourier spectrum of the resulting analytic signal is double that of the original signal at positive frequencies and zero at negative frequencies. The energy in the signal is concentrated in a single space/time frequency focus. However, if an additional shifted and attenuated signal is added in time to the same signal, the resulting transform contained additional points of energy concentrations as shown in Fig. 8. However, if a short action potential is added at a similar point, its effect is not noticeable in the transform domain.
The algorithm has been tested on our arrhythmia databases in which every recording is a 15-20 minutes duration, 10 records were tested for P-waves to evaluate our algorithm. In our evaluation of the proposed technique, we have calculated the Sensitivity, the Positive predictability and the Error as follows:
Sensitivity:
(4)
Positive predictability:
(5)
Error:
(6)
Where, TP indicates true positive(correct detection); FN, false negative(undetected) and FP, false positive(misdetection).
Table 2 shows that our method achieves very good detection performance. This algorithm attains average sensitivity of 99.84% and average positive
Table 2. Performance of the proposed classification model for test data
Subjects Total
beats FP
beats FN
beats P+(%) Se(%)
subject-1 1,200 0 2 100 99.81
subject-2 1,145 0 0 100 100
subject-3 1,232 7 3 99.34 99.12
subject-4 1,022 0 0 100 100
subject-5 1,099 10 0 99.06 100
subject-6 1,289 0 1 100 99.54
subject-7 1,221 0 0 100 100
subject-8 1,129 0 3 100 99.34
subject-9 1,094 0 2 100 99.43
subject-10 1,309 0 0 100 100
Average 1,174 99.84 99.72