제 1 장 서 론
1985년 국내에서 체외수정시술에 의한 첫 시험관아기 가 탄생한 이래 불임 환자 치료를 위한 보조생식술은 날 로 그 시술 기관과 시행수가 증가되고 있을 뿐만 아니 라, 치료성적도 괄목할 만큼 개선되는 등 불임증 진단과 치료에 많은 발전이 있어 왔다. 불임을 치료하기 위해 보조생식술을 시행하고 있는 의료기관으로부터의 자료 는 성공적인 보조생식술, 즉 생아의 출산을 가능하게 하 는 여러 가지 요소들에 대한 풍부하고 귀중한 자료가 될 수 있다. 각 의료기관별의 치료 성적은 그 자체로도 의 미가 있지만 성공률과 성공에 영향을 주는 요소에 대한 통합적인 분석을 위해서는 국내의 여러 의료기관으로부 터의 자료를 취합하여 국내 통계를 구해보는 것이 의미 가 있을 것이며, 이러한 조사는 국내 불임 환자 및 보조 생식술 시술 기관의 실태 파악에 도움을 주는 것은 물론 궁극적으로 국내 보조생식술에 관한 전체적이고 일관성 있는 자료를 장기적으로 처리 분석하여 불임증 치료의 방향까지 제시할 수 있을 것으로 기대된다.
1993년 5월 제정된 인공수태 윤리에 관한 선언에 의하 면, 인준된 인공수태시술 의료기관은 그 시술내용을 연 1회 이상 대한의사협회 (또는 동 협회가 지정한 관련학 회)에 보고하도록 되어 있으며, 1994년 본 학회 내에 인 공수태시술 의료기관 심사소위원회가 설치되었다. 대한 산부인과학회에서는 1992년부터 국내 보조생식술의 현 황을 조사하여 보고하여 오고 있고 2004년 10월 현재 92 개의 의료기관이 인공수태시술 의료기관으로 인준되어 있다. 이러한 조사사업의 일환으로 2001년도 보조생식술 현황도 조사하여 이에 보고하게 되었다.
본 조사에 의해 얻어진 국내 보조생식술에 대한 자료 는 불임 환자 및 보조생식술 시술 기관의 실태파악에 도
움을 주는 것은 물론 더 나아가서는 시술방법의 계속적 인 개선과 발전, 부작용의 감소와 임신 성공률의 향상을 도모하는데 유용한 자료로 활용될 것이다. 본 조사 연구 는 대한산부인과학회의 재정 지원 하에 수행되었으며, 실무에서 많은 노력을 기울인 대한산부인과학회의 직원 여러분들과 서울대학교병원의 황규리 선생, 김진주 선생 그리고 본 조사에 협조하여 주신 국내 각 인공수태시술 의료기관의 여러분들께 본 심사소위원회에서는 깊은 감 사의 말을 전하고자 한다.
2004년 10월 대한산부인과학회 인공수태시술의료기관 심사소위원회 위원장 윤태기 (포천중문의대) 간 사 최영민 (서울의대) 위 원 김선행 (고려의대) 강인수 (성균관의대) 김정훈 (울산의대) 노성일 (미즈메디병원) 류철희 (전북의대) 문신용 (서울의대) 문화숙 (문화병원) 민응기 (함춘클리닉) 이규섭 (부산의대) 이병석 (연세의대) 이상훈 (중앙의대) 이여일 (전남의대) 이원돈 (마리아병원) 이정호 (계명의대) 전상식 (경북의대) 한혁동 (연세의대) (이상 가나다순)
조사보고서
한국 보조생식술의 현황: 2001년
대한산부인과학회
인공수태시술 의료기관 심사소위원회
Current Status of Assisted Reproductive Technology in Korea, 2001
접수일:2004. 10. 3.
주관책임자 : 최영민
제 2 장 조사대상 및 방법
1. 조사대상
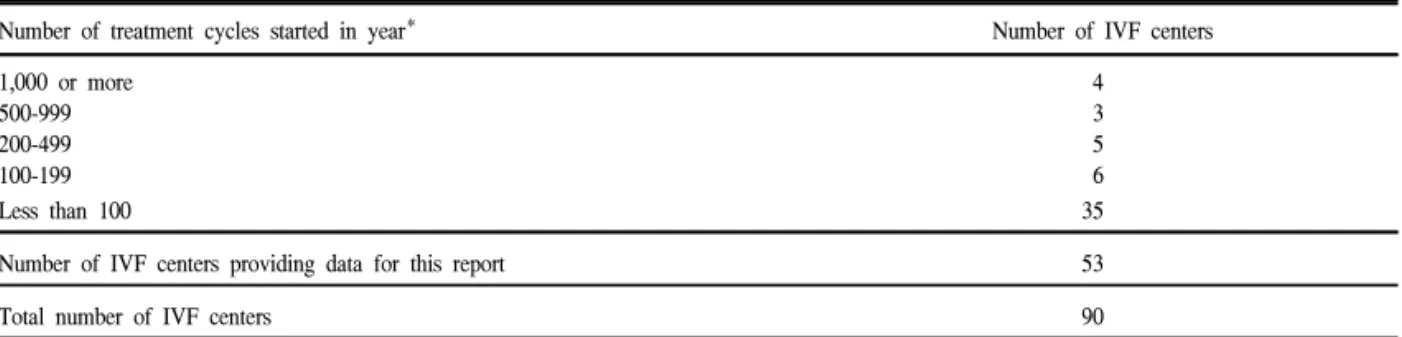
본 연구의 목적은 2001년 1월 1일부터 2001년 12월 31 일까지 국내에서 시술된 보조생식술의 현황 및 시술성 적을 파악하고자 하는 것이다. 조사 시점인 2003년 7월 당시 대한산부인과학회에 인공수태시술 의료기관으로 인준되어 있는 90개의 의료기관을 대상으로 설문지를 발송하였으며 (Fig. 1), 이들 기관 중 시술 성적을 보고한 56개의 의료기관 중 시술례가 있는 53개 기관의 결과를 종합하여 분석하였다. 본 연구조사 결과 분석에 포함된 의료기관은 다음과 같으며 (*는 시술례가 있었던 기관) 1년간 시행하는 총 치료주기의 수에 따라 의료기관을 분류해 보면 Table 1과 같다.
Fig. 1. Location of certified ART clinics in Korea, 2001
Table 1. Number of IVF centers according to size (total number of treatment cycles in the year)
Number of treatment cycles started in year* Number of IVF centers
1,000 or more 4
500-999 3
200-499 5
100-199 6
Less than 100 35
Number of IVF centers providing data for this report 53
1. 가천의대 중앙길병원*, 인천 2. 건국대학교 충주민중병원, 충주 3. 건양대학교병원*, 대전 4. 경북대학교 병원*, 대구 5. 경상대학교 병원*, 진주 6. 경희의대 경희의료원*, 서울 7. 계명대학교 동산의료원*, 대구 8. 고려대학교 병원*, 서울 9. 광주기독병원*, 광주 10. 단국대학병원*, 서울 11. 동국의대 경주병원*, 경주 12. 동래현대병원*, 부산
13. 동아대학병원 동아의료원*, 부산 14. 마리아병원*, 서울
15. 마리아의원*, 광주 16. 마리아의원*, 대구 17. 마리아의원*, 인천 18. 마산순안병원*, 마산 19. 목병원*, 서울 20. 문산부인과, 서울 21. 문화병원*, 부산
22. 미즈메디병원(강남)*, 서울 23. 박금자산부인과*, 서울 24. 부산대학교 병원*, 부산 25. 서울대학교병원*, 서울 26. 성균관의대 삼성서울병원*, 서울 27. 성균관의대 삼성제일병원*, 서울 28. 아름병원*, 부산
29. 연세대학교 원주의과대학 원주기독병원*, 원주 30. 연세의대 신촌세브란스병원*, 서울
31. 예일산부인과*, 서울
32. 울산의대 서울아산병원*, 서울 33. 은산부인과*, 광주
34. 을지병원*, 서울
35. 이도근산부인과*, 진주
36. 이두룡산부인과*, 대구
39. 인제의대부속 상계백병원*, 서울 40. 인제의대부속 서울백병원*, 서울 41. 일신기독병원*, 부산
42. 장스여성병원*, 서울 43. 전남대학교병원*, 광주 44. 전북대학교병원*, 전주 45. 제일산부인과*, 익산 46. 조선대학병원*, 광주 47. 조영열산부인과*, 구리 48. 조재동산부인과*, 창원 49. 중앙의대부속 필동병원*, 서울
52. 프리모산부인과*, 청주 53. 하나병원*, 대구 54. 한나여성의원*, 서울 55. 한라병원*, 제주
56. 한림의대부속 강동성심병원*, 서울
(가나다순) 2. 조사방법
조사설문지를 대상 기관에 e-mail로 발송하였으며,
e-mail로 설문지를 회수하였다. 발송된 설문지는 다음과
같다.
2001년도 보조생식술 시술결과 보고서
REGISTRATION FORM OF ASSISTED REPRODUCTION: 2001 PLEASE READ INSTRUCTIONS AND FOOTNOTES CAREFULLY
BEFORE COMPLETING THE FORMS
Name of IVF Center (한글) Contact Person
Name (한글) Tel Fax
Address (한글)
All data relate to treatment cycles that were started during the calendar year, 2001, and to any clinical pregnancies resulting from those treatment cycles. Please complete as many data items as possible (n=number). If data are not available for some items, write NA. Gestational age (duration of pregnancy) should be calculated by adding 14 days (2 weeks) to the number of completed weeks between the date of fertilization (conception) and the date of completion of the pregnancy
In the following tables :
∙Standard IVF (IVF without ICSI) includes those treatment cycles and pregnancies in which fertilization occurred, or was intended to occur, in the laboratory and fresh embryos were transferred to the uterus or fallopian tubes. This heading excludes: (1) frozen/thawed embryo transfer cycles; and (2) microinsemination techniques.
∙ICSI includes those treatment cycles and pregnancies that follow transfer of fresh embryos after intracytoplasmic sperm injection. Transfer cycles after both ICSI and embryo freezing are recorded separatedly.
∙GIFT includes only those cycles and pregnancies in which gametes (oocytes and sperm) were transferred to the fallopian tubes (excluding combined IVF and GIFT in the same cycle, which should be recorded in IVF category).
주의 : 본 보고서에서 ART procedure를 1) Standard IVF (IVF without ICSI), 2) ICSI, 3) GIFT, 4) FER (Frozen Embryo Replacement) after standard IVF, 5) FER after ICSI, 6) Oocyte donation의 6가지로 구분하고 있습니다.
그리고 이 항목들의 대상은 상호 중첩되지 않으니 숫자 기입시 유의하시기 바랍니다.
If you did not perform ART practice in 2001, check here. □ Not done
If you performed ART practice in 2001, please fill out tables below.
Module Ia
Pregnancy Outcomes in relation to Treatment
Table 1a-1. Pregnancy outcomes : IVF, ICSI, GIFT
IVF without ICSI (n)
IVF with ICSI (n)
GIFT (n) Initiated cycles
Cycles with attempted oocyte retrieval (aspiration)
Transfers
1 embryo (oocyte#) 2 embryos (oocytes) 3 embryos (oocytes) 4 embryos (oocytes) 5 embryos (oocytes)
≥6 embryos (oocytes) All
Clinical pregnancies
Pregnancies with one or more live births Clinical pregnancies with no available information for live birth
* This table excludes cycles in which frozen/thawed embryos were transferred.
#: in case of GIFT
Clinical pregnancy: Presence of an intrauterine gestational sac on ultrasound examination
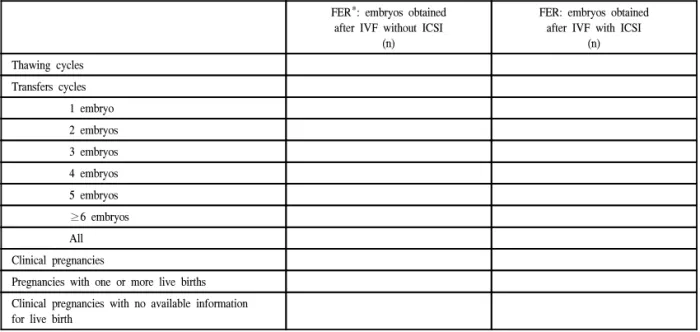
Table 1a-2. Pregnancy outcomes after transfer of frozen/thawed embryos
FER*: embryos obtained after IVF without ICSI
(n)
FER: embryos obtained after IVF with ICSI
(n) Thawing cycles
Transfers cycles 1 embryo 2 embryos 3 embryos 4 embryos 5 embryos
≥6 embryos All Clinical pregnancies
Pregnancies with one or more live births Clinical pregnancies with no available information for live birth
*FER (Frozen Embryos Replacement)
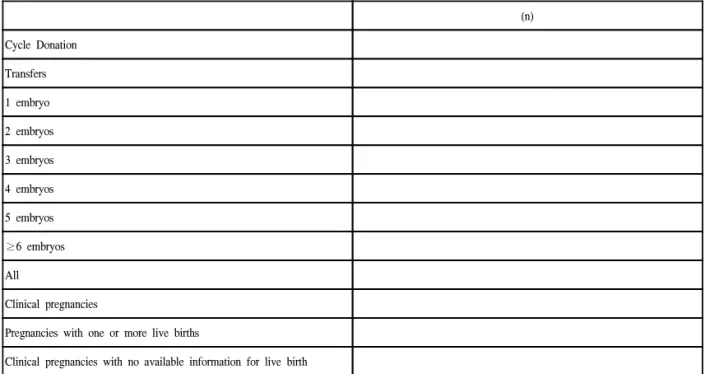
Table 1a-3. Pregnancy outcomes after oocyte donation
(n) Cycle Donation
Transfers 1 embryo 2 embryos 3 embryos 4 embryos 5 embryos
≥6 embryos All
Clinical pregnancies
Pregnancies with one or more live births
Clinical pregnancies with no available information for live birth
Module Ib
Women's Age and Indications for IVF Treatment AGE at start of Treatment
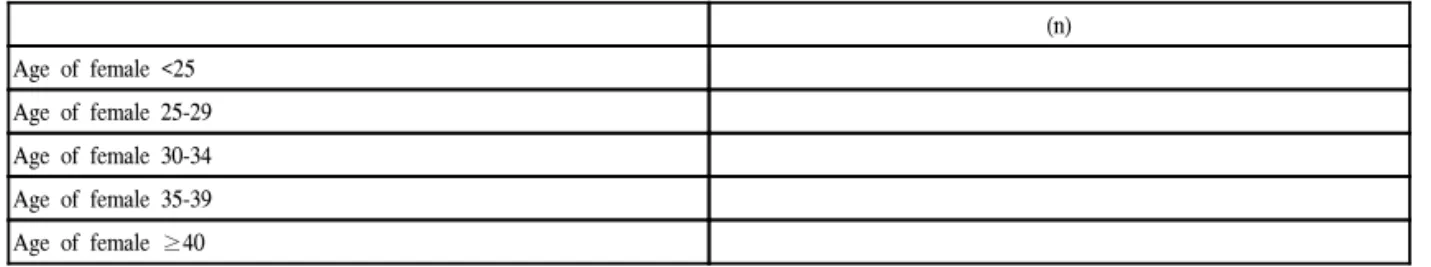
Table Ib-1. STANDARD IVF TREATMENT (excluding ICSI, FER, Donation cycles)
(n) Age of female <25
Age of female 25-29 Age of female 30-34 Age of female 35-39 Age of female ≥40
Table Ib-2. ISCI TREATMENT (excluding ICSI, FER, Donation cycles- including combined cycles with standard IVF)
(n) Age of female <25
Age of female 25-29 Age of female 30-34 Age of female 35-39 Age of female ≥40
Table 1b-3. OOCYTE DONATION : Recipient cycles
(n) Age of female <25
Age of female 25-29 Age of female 30-34 Age of female 35-39 Age of female 40-44 Age of female ≥45
INDICATIONS (excluding FER/Donation)
Table 1b-4. Indications
INDICATIONS FOR ART IVF without ICSI
(n)
IVF with ICSI (n) Female only
Male factor only Mixed male and female Unexplained
Other factors
ART Report Forms, Korea 2001
Module Ic
Complications of Treatment
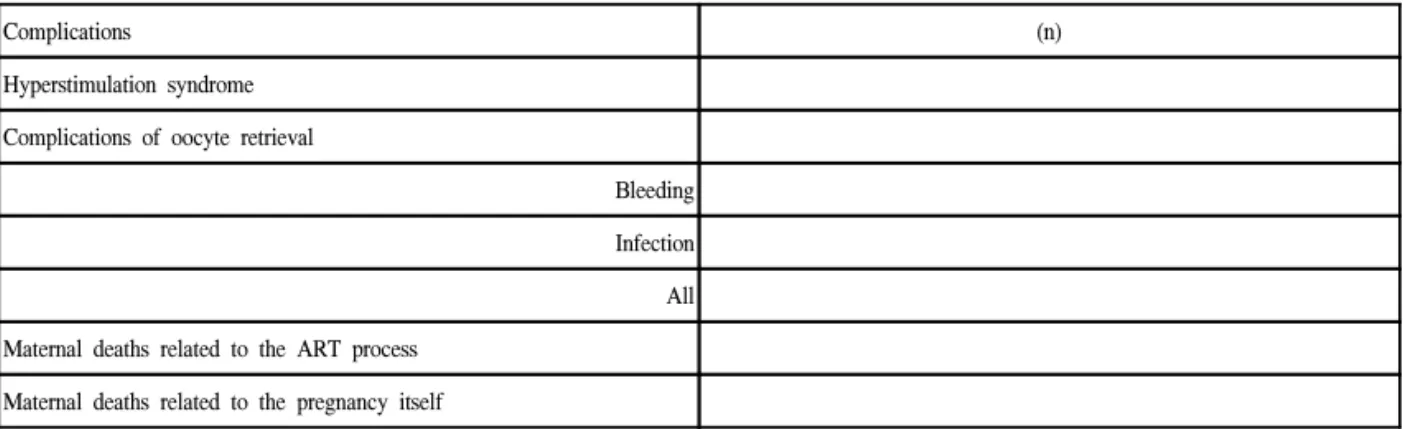
Table 1c. Complications that require admission to hospital
Complications (n)
Hyperstimulation syndrome Complications of oocyte retrieval
Bleeding Infection All Maternal deaths related to the ART process
Maternal deaths related to the pregnancy itself
Module 2
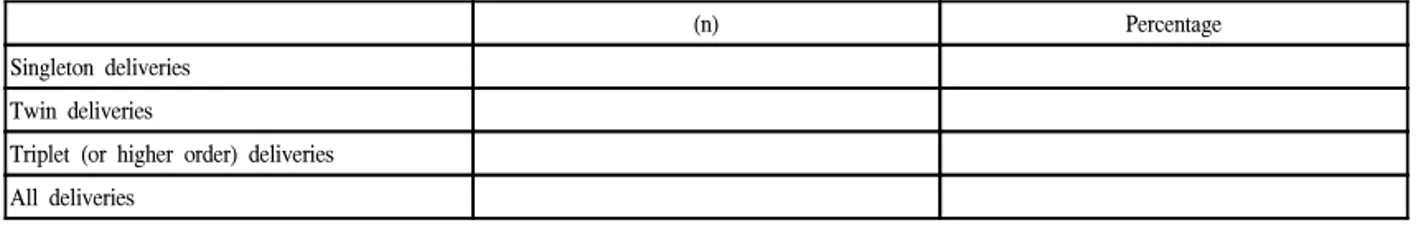
Deliveries in relation to Treatment
Table 2-1. IVF Standard (IVF without ICSI)
(n) Percentage
Singleton deliveries Twin deliveries
Triplet (or higher order) deliveries All deliveries
Table 2-2. ICSI (IVF with ICSI)
(n) Percentage
Singleton deliveries Twin deliveries
Triplet (or higher order) deliveries All deliveries
Table 2-3. Frozen Embryo Replacement
(n) Percentage
Singleton deliveries Twin deliveries
Triplet (or higher order) deliveries All deliveries
Table 2-4. Oocyte Donation
(n) Percentage
Singleton deliveries Twin deliveries
Triplet (or higher order) deliveries All deliveries
Table 2-5. Induced Abortions
(n) Percentage/All Deliveries
IVF Standard ICSI
ART Report Forms, Korea 2001
Module 3a
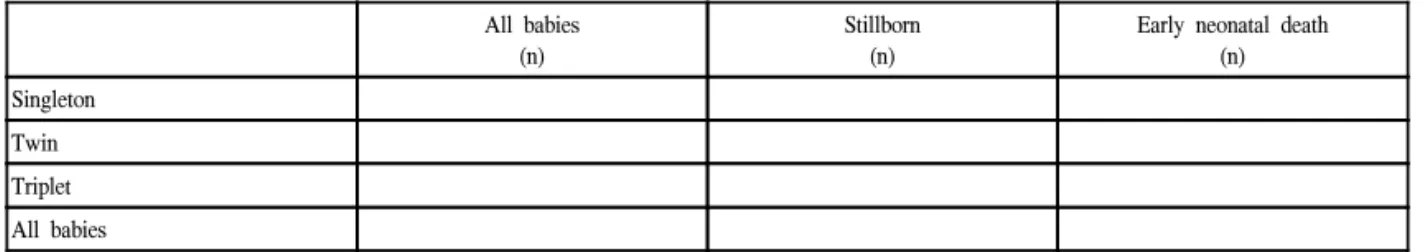
Perinatal Mortality in relation to Treatment and Multiple Deliveries
Table 3a-1. IVF without ICSI
All babies (n)
Stillborn (n)
Early neonatal death (n) Singleton
Twin Triplet All babies
Table 3a-2. ICSI (IVF with ICSI)
All babies (n)
Stillborn (n)
Early neonatal death (n) Singleton
Twin Triplet All babies
Table 3a-3. FER (Frozen Embryo Replacement) All babies
(n)
Stillborn (n)
Early neonatal death (n) Singleton
Twin Triplet All babies
Table 3a-4. Oocyte Donation
All babies (n)
Stillborn (n)
Early neonatal death (n) Singleton
Twin Triplet All babies
- Deliveries include all with a gestational age at > 20 weeks from the calculated last menstrual period.
- An early neonatal death is defined as a death occurring within the first week postpartum.
- Stillborn include deaths occurring during the delivery process.
Module 3b
Malformations in relation to Treatment
(includes chromosomal abnormalities)
Table 3b-1. Standard IVF (IVF without ICSI)(n) Total number of infants (live-born and stillborn)
Number of malformations
Terminations because of a malformed fetus(excluding the malformations in the above line)
Table 3b-2. ICSI (IVF without ICSI)
(n) Total number of infants (live-born and stillborn)
Number of malformations
Terminations because of a malformed fetus (excluding the malformations in the above line)
Table 3b-3. FER (Frozen Embryo Replacement)
(n) Total number of infants (live-born and stillborn)
Number of malformations
Terminations because of a malformed fetus (excluding the malformations in the above line)
Table 3b-4. Oocyte Donation
(n) Total number of infants (live-born and stillborn)
Number of malformations
Terminations because of a malformed fetus (excluding the malformations in the above line) Please list malformations which were reported, if available:
ART Report Forms, Korea 2001
Module 4
Clinical Outcomes by Maternal Age, Cause of Infertility
Table 4-1. Number of oocyte retrieval cycles and clinical pregnancies by maternal age, 2001
Standard IVF* IVF with ICSI GIFT
Women's age at
start of treatment Oocyte retrieval# (n)
Clinical pregnancies (n)
Oocyte retrieval (n)
Clinical pregnancies (n)
Oocyte retrieval (n)
Clinical pregnancies (n)
<25 years 25-29 30-34 35-39
≥40
*IVF without ICSI
#Oocyte retrieval cycles attempted
Table 4-2. Number of oocyte retrieval cycles and clinical pregnancies by cause(s) of infertility, 2001
Standard IVF IVF with ICSI GIFT
Cause(s) of infertility
Oocyte retrieval*
(n)
Clinical pregnancies (n)
Oocyte retrieval*
(n)
Clinical pregnancies (n)
Oocyte retrieval (n)
Clinical pregnancies (n) Female only
Male factor only Mixed male and female Unexplained Other factors
* Oocyte retrieval cycles attempted
- This table excludes cycles using frozen/thawed embryos.
- The groups in the sections on cause of infertility are mutually exclusive so each treatment cycle or pregnancy should be included in only one group.
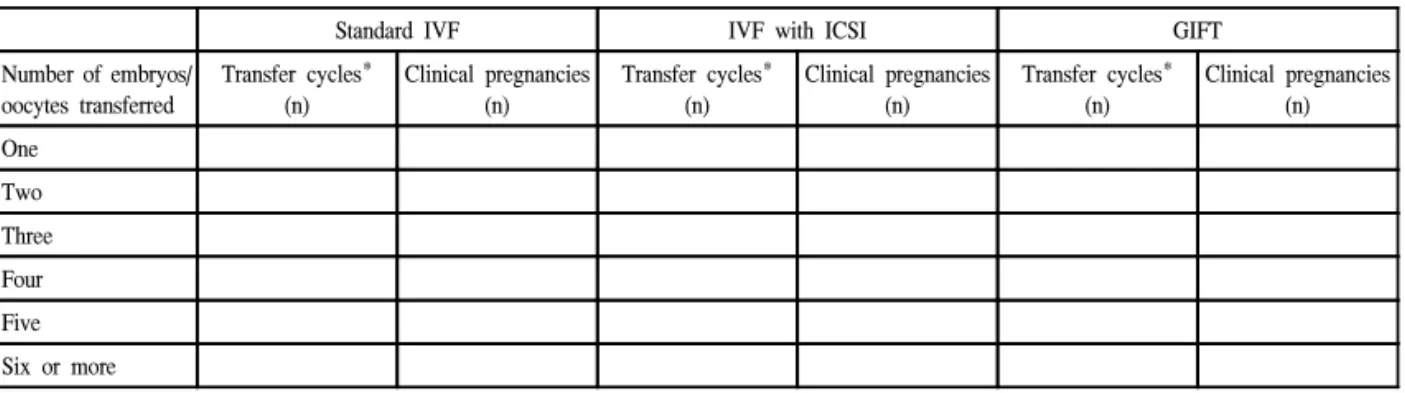
Table 4-3. Number of oocyte retrieval cycles and clinical pregnancies by number of embryos or oocytes transferred, 2001
Standard IVF IVF with ICSI GIFT
Number of embryos/
oocytes transferred
Transfer cycles*
(n)
Clinical pregnancies (n)
Transfer cycles*
(n)
Clinical pregnancies (n)
Transfer cycles*
(n)
Clinical pregnancies (n) One
Two Three Four Five Six or more
- This table excludes cycles using frozen/thawed embryos.
Module 5
Embryo Freezing and Other Special Techniques
Table 5-1. Embryo freezing, 2001
Have you ever performed embryo freezing in 2000? Yes ( ), No ( )
(n) Number of oocyte pick-up (OPU) cycles that resulted in embryo freezing in 2001
Number of embryos that were frozen in 2001
Total number of embryos in frozen storage at 31 July 2003
Table 5-2. Oocyte retrieval cycles, transfer cycles and pregnancies using special techniques of sperm collection and/or assisted hatching, 2001
Selected techniques
Oocyte retrieval cycles attempted
(n)
Transfer cycles (n)
Clinical pregnancies (n)
Pregnancies with live births
(n) Microepididymal sperm
aspiration (MESA) Testicular sperm extraction (TESE)
Other and unspecified techniques of sperm collection*
Assisted hatching
*: describe
* 이상입니다. 기입하여 주셔서 감사드립니다.
본 조사에서는 체외수정 및 자궁내 배아이식술 (in vitro fertilization and embryo transfer: IVF-ET) 중 난자 세포질내 정자주입술 (intracytoplasmic sperm injection:
ICSI)을 시행한 경우를 분리하여 조사하였으며 마찬가지 로 냉동보존배아를 이용한 IVF-ET의 경우에도 ICSI를 시행한 군과 시행하지 않은 군으로 나누어 보고하게 하 였다. 그러나, 접합자 난관내이식술 (zygote intrafallopian transfer: ZIFT)은 제외하였다.
모든 자료들은 2001년에 시작된 치료주기에 관련된 것이고 따라서 2001년에 시작된 주기의 결과로 발생한 임상적 임신은 모두 분석에 포함하였다. 임상적 임신은 초음파에 의한 태낭의 확인 또는 소파술로 얻어진 임신 산물 등의 임신의 임상적 증후가 있는 경우만을 포함하 고 단순히 혈중 β-hCG만의 상승이 있었던 생화학적 임 신은 제외하였다. 임신 주수는 수정으로부터 임신이 종 결된 시점간의 기간에 14일 (2주)을 더하여 completed weeks의 수로 나타내었다.
그리고 취합된 자료들은 Microsoft사의 Excel프로그램 을 이용하여 분석하였다.
제 3 장 결과 분석 및 고찰
1. 2001년도 한국 보조생식술 시술 개요
2001년의 시술례를 보고해온 국내의 53개의 보조생식 술 시술기관에서 총 14,667예의 보조생식술을 시행하였 다 (Table 2). 이는 2000년 58개의 시술기관에서 15,619예 를 보고한 것과 비교하여 감소한 숫자이다.
Table 2. Clinical pregnancy in relation to treatment
Treatment cycles / pregnancies IVF ICSI GIFT FER* after IVF FER after ICSI Oocyte donation
Cycles initiated (started)# 7740 4987 63 1059 587 231
Cycles with oocyte retrieval 6650 4767 63 - - 231
Cycles with embryo transfer 6465 4584 62 1023 547 222
1 embryo (oocyte$) 403 448 1 88 55 9
2 embryo (oocytes) 821 617 1 244 96 18
3 embryo (oocytes) 1446 853 6 318 141 39
4 embryo (oocytes) 2172 1484 5 190 149 57
5 embryo (oocytes) 1370 1002 15 90 64 75
≥6 embryo (oocytes) 253 180 34 93 42 24
Clinical pregnancies 2179 1386 18 249 135 101
(CP per retrieval, %) 32.7% 29.1% 28.6% - - 43.7%
(CP per transfer, %) 33.7% 30.2% 29.0% 24.3% 24.7% 45.5%
Live births# 1800 1189 14 232 105 84
(Live births per retrieval, %) 27.0% 23.8% 22.2% - - 36.4%
(Live births per transfer, %) 27.8% 25.9% 22.6% 22.7% 19.2% 37.8%
*: frozen embryos replacement, a: thawing cycles, b: cycle donation,
$ #
보조생식술의 시술 방법별 분포를 보면, 총 14,667예 의 주기 중 IVF (ICSI를 병행한 경우는 제외) 7,740예 (52.8%), ICSI 4,987예 (34.0%)로 IVF와 ICSI 시술의 합 이 총 12,727예 (86.8%)로 대부분의 보조생식술이 신선 배아를 이용하는 것으로 이루어지고 있음을 알 수 있 다. 냉동보존 배아이식 (cryopreserved embryo transfer:
cryopreserved ET)은 1,646예 (11.2%)가 시행되었으며, 난 자 공여시술 (oocyte donation)은 231예 (1.6%), 생식세포 난관내이식술 (gamete intrafallopian transfer: GIFT)은 63 예 (0.4%)였다 (Table 2, Fig. 2).
5 2 . 8 % 3 4 . 0 %
0 . 4 %
1 1 . 2 % 1 . 6 %
IV F -E T IC S I G IF T F E R O D
Fig. 2. Types of ART procedures.
2. IVF와 ICSI
1) 임상적 임신율 및 생아 출생률
IVF와 ICSI를 시행 받은 대상 환자 중 총 3,565명 (난
자 채취 주기당 31.2%, 배아 이식 주기 당 32.2%)이 임상
적으로 임신을 확인할 수 있었으며, 추정하여 2,989명
(난자 채취 주기당 26.1%, 배아 이식 주기 당 27.0%)이
생아를 출산하였다 (Table 2).
Maternal age at start of treatment
IVF ICSI Total OR cycles CP (%) OR cycles CP (%) OR cycles CP (%)
<25 56 22 (39.2%) 15 2 (13.3%) 71 24 (33.8%)
25-29 807 316 (39.1%) 671 261 (38.8%) 1478 577 (39.0%)
30-34 2621 1006 (38.3%) 1879 635 (33.7%) 4500 1641 (36.4%)
35-39 2034 645 (31.7%) 1385 379 (27.3%) 3419 1024 (29.9%)
≥40 1066 165 (15.4%) 783 115 (14.6%) 1849 280 (15.1%)
Total 6584 2154 (32.7%) 4733 1392 (29.4%) 11317 3546 (31.3%)
2) 대상 환자의 연령분포 및 이에 따른 임신율 IVF와 ICSI를 시행 받은 대상 환자의 연령분포를 보면 25세 미만이 0.6%, 25-29세가 13.1%, 30-34세가 39.8%, 35-39세가 30.2%, 40세 이상이 16.3%로 30-39세가 전체 의 70.0%로 대부분을 차지하였다 (Table 3, Fig. 3).
0 5 10 15 20 25 30 35 40
Percentage (%)
<25 25-29 30-34 35-39 >40 Age
Fig. 3. Percentage of ART users by ages: IVF & ICSI.
난자 채취 주기 당 임상적 임신율은 25세 미만이 33.8%, 25-29세가 39.0%, 30-34세가 36.4%, 35-39세가
0 5 10 15 20 25 30 35 40
CP/Retrieval(%)
<25 25-29 30-34 35-39 >40 Age
Fig. 4. Clinical pregnancy rates by ages of women IVF &
ICSI.
29.9%, 40세 이상은 15.1%로 40세 이후의 임신율이 저조 하였다 (Table 3, Fig. 4).
3) 불임 원인 및 이에 따른 임신율
IVF와 ICSI를 시행 받은 대상 환자의 적응증, 즉 불임 증의 원인 인자별 분포는 여성 인자 (female only)만 있 는 경우가 46.9%, 남성 인자 (male factors only)만 있는 경우가 20.4%, 여성 인자와 남성 인자가 공존하는 경우 (mixed male and female)가 10.2%, 원인불명의 불임증 (unexplained)이 17.4%, 기타 다른 인자가 5.1%이었다 (Table 4, Fig. 5).
4 6 . 9 %
2 0 . 4 % 1 0 . 2 %
1 7 . 4 % 5 . 1 %
F e m a le o n ly M a le o n ly M ix e d U n e x p la in e d O t h e r f a c t o rs
Fig. 5. Primary diagnosis for ART procedures.
0 10 20 30 40
Fem ale on ly Male o nly Mixed U nexplained Oth er factor
Fig. 6. Clinical pregnancy rates by cause of infertility.
39.8%
30.2%
16.3%
13.1%
0.6%
33.8%
39.0%
36.4%
24.9%
15.1%
29.9%
32.4%
27.5%
33.0%
31.0%
난자 채취 주기 당 임상적 임신율은 여성 인자만 있는 경우는 31.0%, 남성 인자만 있는 경우는 33.0%, 여성 인 자와 남성 인자가 공존하는 경우는 27.5%, 원인불명의 불임증은 32.4%, 기타 다른 인자의 경우 24.9%로 원인별 로 뚜렷한 차이가 발견되지는 않았다 (Table 4, Fig. 6).
4) 이식 배아 수 및 이에 따른 임신율
IVF와 ICSI 시행주기에서 이식한 배아의 수는 1개의 경우가 8.2%, 2개인 경우 12.7%, 3개인 경우 20.8%, 4개 인 경우 33.1%, 5개인 경우 21.4%, 6개 이상인 경우 3.8%
였다 (Table 2).
이식 주기당 임상적 임신율은 이식한 배아의 수가 1개 의 경우는 12.3%, 2개인 경우 24.1%, 3개인 경우 33.9%, 4개인 경우 36.0%, 5개인 경우 37.0%, 6개 이상인 경우 31.0%였다 (Table 5).
5) 다태아 출생비율
IVF와 ICSI 시행주기에서 출생한 총 생아 (live birth) 중 단태아의 비율은 66.6%였으며 쌍태아는 33.1%, 삼태 아는 0.3%였으며 사태아 이상은 없었다. 전체적으로 쌍 태아 이상의 다태 임신의 빈도가 일반 인구에서의 쌍태 아 빈도가 3% (Cunningham FG et al., Williams Obstetrics 21th ed. U.S.: McGrawHill Companies; 2001)인 것과 비교 하면 매우 높은 빈도이다 (Table 6, Fig. 7).
Table 4. Number of oocyte retrieval cycles by cause of infertility
Cause of infertility
IVF ICSI Total OR cycles CP (%) OR cycles CP (%) OR cycles CP (%)
Female only 4110 1348 (32.7%) 1212 306 (25.2%) 5322 1654 (31.0%)
Male factor only 281 106 (37.7%) 2031 658 (32.3%) 2312 764 (33.0%)
Mixed male and female 365 97 (26.5%) 794 222 (27.9%) 1159 319 (27.5%)
Unexplained 1444 504 (34.9%) 531 137 (25.8%) 1975 641 (32.4%)
Other factors 408 108 (26.4%) 169 36 (21.3%) 577 144 (24.9%)
Total 6608 2163 (32.7%) 4737 1359 (28.6%) 11345 3522 (31.0%)
Table 5. Clinical pregnancies by number of embryos transferred
Number of embryos transferred
Standard IVF IVF with ICSI Total Transfer Clinical Transfer Clinical Transfer Clinical cycles pregnancies (%) cycles pregnancies (%) cycles pregnancies (%)
One 452 63 (13.9%) 454 49 (10.7%) 906 112 (12.3%)
Two 794 221 (27.8%) 615 119 (19.3%) 1409 340 (24.1%)
Three 1443 526 (36.4%) 852 253 (29.6%) 2295 779 (33.9%)
Four 2172 788 (36.2%) 1483 530 (35.7%) 3655 1318 (36.0%)
Five 1362 508 (37.2%) 1001 368 (36.7%) 2363 876 (37.0%)
Six or more 248 71 (28.6%) 177 61 (34.4%) 425 132 (31.0%)
6 6 . 6 % 3 3 . 1 %
0 . 3 %
S i n g l e t o n T wi n T r i p l e t
Fig. 7. Pluralities among live births: IVF & ICSI.
3. 난자 공여시술 (oocyte donation)
총 231예의 난자 공여시술이 있었으며, 222명에서 배 아 이식을 시행하였다. 배아 이식 당 임상적 임신율은 45.5%, 생아 37.8%였다 (Table 2).
4. 생식세포 난관내이식술
총 63예에서 생식세포 난관내 이식을 시행하였으며, 생식세포 이식 주기 당 임상적 임신율은 29.0%, 생아 출 산율은 22.6%였다 (Table 2).
이식한 난자의 수는 1개의 경우가 1.6%, 2개인 경우 1.6%, 3개인 경우 9.7%, 4개인 경우 8.1%, 5개인 경우 24.2%, 6개 이상인 경우 54.8%였다 (Table 2).
이식 주기당 임상적 임신율은 이식한 난자의 수가 1개 인 경우 0%, 2개인 경우 0%, 3개인 경우 16.6%, 4개인 경우 20.0%, 5개인 경우 40.0%, 6개 이상인 경우 26.4%
였다 (Table 7).
Singleton Twin deliveries Triplet deliveries All deliveries
IVF 1090 547 7 1644
Number (n) Percentage (66.3%) (33.2%) (0.4%)
ICSI 710 348 1 1059
Number (n) Percentage (67.0%) (32.8%) (0.1%)
FER 185 66 1 252
Number (n) Percentage (73.4%) (26.2%) (0.4%)
Oocyte donation 40 22 0 62
Number (n) Percentage (64.5%) (35.5%) (0%)
Table 7. Clinical pregnancies by number of oocytes transferred in GIFT cycles
GIFT
Number of oocytes transferred Transfer cycles Clinical pregnancies (%)
One 1 0 (0%)
Two 1 0 (0%)
Three 6 1 (16.6%)
Four 5 1 (20.0%)
Five 15 6 (40.0%)
Six or more 34 9 (26.4%)
Total 62 17 (27.4%)
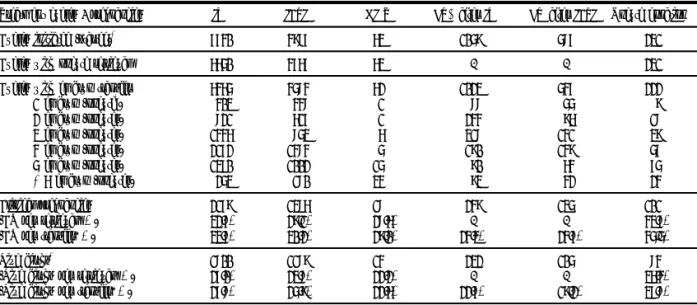
Table 8. Oocyte retrieval cycles, transfer cycles and pregnancies using special techniques of sperm collection and/or assisted hatching
Selected techniques Oocyte retrieval cycles Transfer cycles Clinical Pregnancies with attempted pregnancies (%#) live births (%#)
Microepididymal sperm aspiration (MESA) 121 114 34 (28.0%) 22 (18.1%)
Testicular sperm extraction (TESE) 569 540 171 (30.0%) 108 (18.9%)
Other and unspecified techniques of sperm collection* 32 32 13 (40.6%) 10 (31.2%)
Assisted hatching 1671 1633 431 (25.7%) 282 (16.8%)
#: per oocyte retrieval cycle
5. 냉동보존 배아이식 (transfer of cryopreserved embryo)
2001년에 총 1,646예의 냉동보존배아 이식시도가 있었 으며, 이중 총 1,570예에서 냉동보존배아 이식을 시행하 였다. 배아 이식주기 당의 임상적 임신율은 24.4% 생아 출산율은 21.4%였다 (Table 2).
이식한 배아의 수는 1개의 경우가 9.1%, 2개인 경우 21.7%, 3개인 경우 29.2%, 4개인 경우 21.6%, 5개인 경우 9.8%, 6개 이상인 경우 8.6%였다 (Table 2).
6. 수술적 방법에 의한 정자 채취와 보조 부화술 2001년에 시행된 MESA (microsurgical epididymal sperm aspiration)는 총 121예이고 난자 채취 주기당 임신
율은 28.0%, 난자채취주기당 생아 출생율은 18.1%였다.
TESE (testicular sperm extraction)는 569예에서 시행되었 고 난자채취주기당 임신율은 30.0%였고 난자채취주기당 생아 출생율은 18.9%였다. 보조부화술은 1,671예에서 시 행되었고 난자채취 주기당 임신율은 25.7%, 난자채취 주 기당 생아 출생율은 16.8%였다 (Table 8).
제 4 장 맺음말