2014, 25
(6)
,1273–1281
생활형태와 기능성화장품 인지도에 대한 통계적 분석 †
신재경
1
1창원대학교 자연과학대학 통계학과
접수 2014년 8월 29일, 수정 2014년 9월 19일, 게재확정 2014년 9월 25일
요 약
현대사회에서는 다양한 산업 기술의 고도화와 함께 여러 가지 재료와 집적기술의 발전으로 화장품 산업 전반에도 많은 종류의 화장품이 출시되고 있는 실정이다. 이와 함께 화장품법의 독립과 화장품 의 전 성분 표시제가 도입되었다. 웰빙시대인 요즈음에는 질 좋은 삶의 추구를 위해 생활관리, 생체리 듬, 올바른 자세, 스트레스 증상과 같은 생활패턴에도 많은 관심을 갖게 되었다. 이들 생활패턴은 삶 의 질과 건강뿐만 아니라 피부 관리와도 관련이 있을 것으로 판단하여 기능성 화장품의 인지도와 생활 패턴과의 관계를 알아보기 위하여 설문조사를 하였다. 그 결과는 화장품 인지도 관련 16문항 중 문항 3, 문항 5, 문항 6 및 문항 11은 대학교 간 응답에 유의한 차이가 있음을 보였다. 또한, 생활패턴과의 교차분석 결과는 응답연도와 스트레스 증상 간, 응답연도와 올바른 자세 간에는 응답에 유의한 차이가 있음을 보였다. 끝으로, 성별과 생체리듬, 성별과 올바른 자세 및 성별과 스트레스 증상 간에는 응답 에 유의한 차이가 있음을 알 수 있었다. 향후 과제로는 일반인을 대상으로도 동일한 조사를 하여 이들 간의 차이를 조사해 볼 필요성이 있는 것으로 생각된다.
주요용어: 교차분석, 기능성화장품, 생활패턴, 인지도, 화장품법.
1. 서 론
21세기 문명사회에서는 다양한 산업 기술의 고도화와 함께 여러 가지 재료와 집적 기술의 발전으로 화장품산업 전반에도 많은 종류의 화장품이 출시되고 있는 실정이다. 화장품을 사용하는 소비자들 중 에는 여성뿐 만이 아니라 남성들도 깨끗한 피부와 아름다워지고 싶은 욕구와 보다 나은 삶의 질을 추구 하려는경향의 사람들이 늘어나고 있는 추세이다. 이러한 사회 현상은 기존 화장품에 대한 정의보다 확 대된개념의 화장품에 대한 새로운 정의와 높은 삶의 질을 추구하려는 생활 형태에 대한 연구도 중요하 게 되었다. 우리나라의 화장품 법은 2000년 7월 1일 기존의 약사법에서 독립 법으로 분리·제정 되었다 (Kim과 No, 2007).
이러한법적·제도적 장치는 ‘인체를 청결 또는 미화하고, 피부 또는 모발을 건강하게 유지하기 위한 물품’이라는 기존의 화장품 정의 보다 폭 넓은 화장품의 개념이 필요하게 되었다. 이런 필요에 따라, 화 장품 법에서 기능성화장품의 정의가 등장하게 되었으며, 기능성화장품은 첫째, 피부의 미백에 도움을 주 는 제품, 둘째, 피부주름개선에 도움을 주는 제품, 셋째, 피부를 곱게 태워주거나 자외선으로부터 피부 를보호하는데 도움을 주는 제품이라는 3영역으로 정의되고 있다.
이와 더불어 또 하나의 변화는 2008년10월 1일부터 일반화장품 및 기능성화장품의 전 성분 표시제가 도입된것이다. 특히 기능성 성분에 대한 지식은 대부분이 잘 모르거나 피상적인 수준에 머무르고 있는 실정이다.
†
이 논문은 2013-2014년도 창원대학교 연구비에 의하여 연구되었음.
1
(641-773) 경남 창원시 의창구 사림동 9번지, 창원대학교 통계학과, 교수. E-mail: [email protected]
지금까지 많은 사람들이 주위 사람들의 권유나 광고를 바탕으로 화장품을 선택해왔다. 매일 사용하는 화장품인 만큼 화장품에 대한 지식과 성분에 대한 인식도 매우 중요하다고 여기는 사람들이 점차 증가하 고 있는 추세이므로, 그에 대한 소비자들의 알 권리를 보장하여 자신의 피부에 잘 맞는 화장품을 선택할 수 있도록 하는 것이 중요하다.
웰빙시대인 요즈음에는 질 좋은 삶의 추구를 위해 생활관리, 생체리듬, 올바른 자세, 스트레스 증상과 같은 생활패턴에도 많은 관심을 갖게 되었다. 이들 생활패턴은 삶의 질과 건강뿐만 아니라 피부 관리와 도 관련이 있을것으로 생각이 된다.
Choi와 Ha (2012)는 노인의 삶의 질과 삶의 만족도에 관한 연구를 하였으며, Hong 등 (2012)은 2008년도 노인생활실태 및 복지욕구조사 자료의 통계분석을 하여 고령사회의 정책 수립에 관한 연구를 하였으며, Ban 등 (2012)은 비만 중년여성의 복합 운동이 대사 증후군 지표와 건강 체력에 미치는 영향 에 관한 연구를 하였으며, Kim 등 (2013)은 운동 형태에 따른 중년 여성의 신체 구성과 혈중 지질의 변 화에 관한 연구를 하였으며, Choi 등 (2012)은 K대 대학생을 중심으로 스마트 폰 중독이 정신 건강, 학 교생활, 대인관계에 미치는 영향에 관한 연구를 하였으며, Han 등 (2012)은 복합 운동 프로그램을 통한 저 체력군 고등학생의 대사 증후군 지표와 자율 신경계의 변화에 관한 연구를 하였다. 또한, 화장품법 시행과 더불어, Kim과 Han (2002)은 창원·마산지역 대학생의 기능성 화장품과 관련한 인지도 조사를 수행하였으며, Kim 등 (2008)은 창원지역의 직장인 여성과 전업주부의 기능성 화장품과 관련한 인지도 조사를 수행하였고, Kim과 Shin (2013)은 특정 수강집단에 있어서 기능성화장품 인지도 조사 연구를 수행하였다. 본 연구에서는 인터넷 교양강좌로 개설된 화장품학을 수강하는 학생들을 대상으로, 기능성 화장품의 인지도와 생활패턴에 관한 설문조사를 시행하여 기능성화장품의 인지도와 생활패턴과의 관련 성에 대해 분석하고자 한다.
2. 연구 방법 2.1. 연구 대상
본 연구는 창원대학교의 교양과목으로 인터넷 강좌로 개설된‘화장품학’을 수강하는 학생을 대상으로 하였다. 본 교과목은 창원대학교 및 경남권역을 대상으로 진주 소재 경상대학교에서도 개설되어 운영되 고 있다. 조사 기간은 2011년부터 2012년까지 2년간의 수강생을 대상으로 하였으며, 이들의 인구 통계 학적 데이터를 Table 3.1에 정리하였다.
2.2. 조사 도구
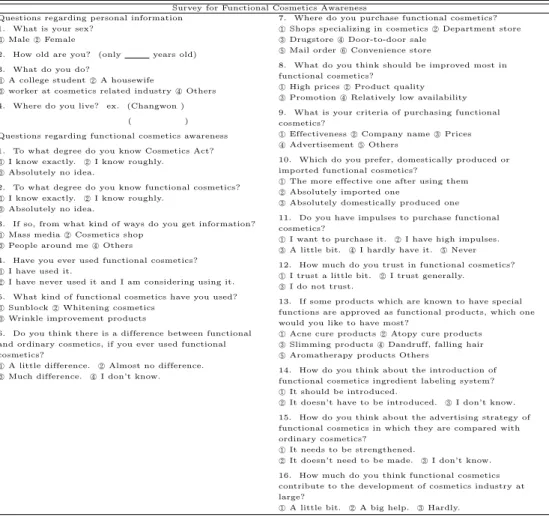
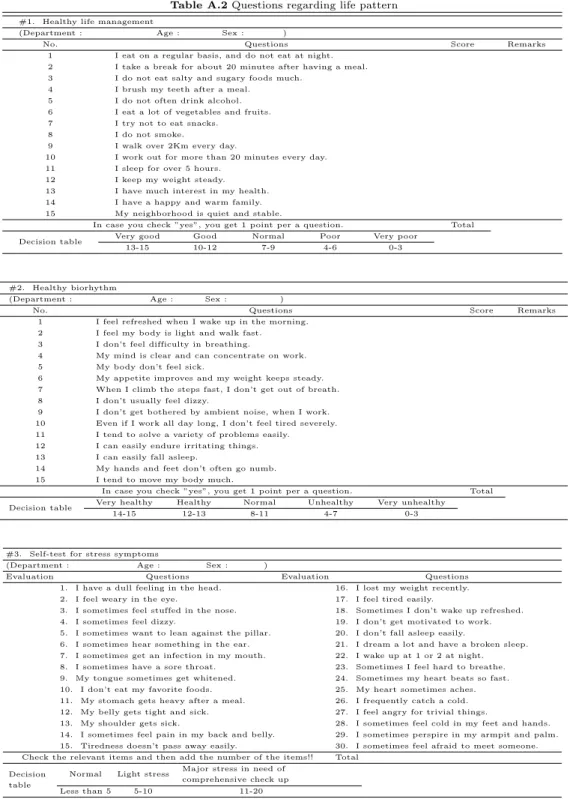
본 연구를 위한 ‘기능성 화장품 인지도 조사’와 ‘생활패턴 (생활관리, 생체리듬, 올바른 자세, 스트레 스 증상)’에 관한 설문 문항은 각각 부록에 있는 Table A.1과 Table A.2에 나타내었다.
2.3. 자료 수집 및 분석
자료 수집은, ‘화장품학’을 수강하는 학생을 대상으로, 설문에 대한 응답을 제출받았다. 자료 분석은 PASW 18.0 (구 SPSS) 프로그램을 이용하여 분석하였고, 분석기법으로 설문 대상자의 일반적 특성을 파악하기 위해 인구 통계학적 속성 분석을 하였다 (Table 3.1 참조). 그리고 기능성화장품의 인지도와 생활패턴과의 관련성에 대해 분석하고, 해당 설문 문항에 대한 유의성 및 그들 데이터의 동질성 검정을 수행하기 위하여 χ2-검정 (카이제곱-검정)과 빈도분석을 실시하였다.
3. 연구 결과 및 해석 3.1. 설문 대상자의 일반적 특성
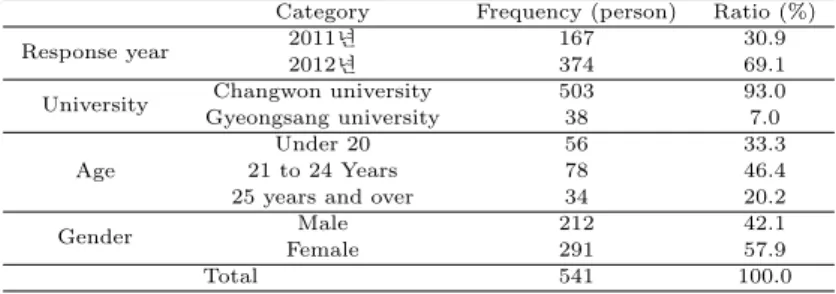
우선 Table 3.1의 전체 설문 대상자의 속성분석의 결과를 비율로 살펴보면 년도 별로는 2012년이
69.1%로, 2011년의 30.9%보다 2배 이상 높았으며, 대학교별로는 창원대학교가 93.0%로 진주 경상대 학교의 7%보다 훨씬 높게 나타났다. 이는 본 화장품학 강좌가 창원대학교에서 개설이 되어 창원대학교 학생이 진주경상대학교 학생보다 많이 수강한 것으로 생각이 된다. 성별로는 여학생이 57.9%로 남학 생의 42.1%보다 높게 나타났지만 남학생들도 화장품에 많은 관심을 가지고 있는 것을 알 수 있다.
Table 3.1 The characteristics for particular lesson group with property analysis Category Frequency (person) Ratio (%)
Response year 2011년 167 30.9
2012년 374 69.1
University Changwon university 503 93.0
Gyeongsang university 38 7.0
Age
Under 20 56 33.3
21 to 24 Years 78 46.4
25 years and over 34 20.2
Gender Male 212 42.1
Female 291 57.9
Total 541 100.0
3.2. 속성 중 대학교와 기능성 화장품의 인지도 관련 설문문항과의 교차분석
본 절에서는 속성 중에서 대학교와 기능성 화장품의 인지도와 관련한 설문문항과의 교차분석 결과에 대하여 살펴보기로 한다.
Table 3.2 Result for cross-tabulation with university and the question 3 (person (%)) Question 3 If so, from what kind of ways do you get information?
Total Mass media cosmetics shop people around me Others
University Changwon 38 (39.6) 22 (22.9) 28 (29.2) 8 (8.3) 96 (100.0)
Gyeongsang 17 (45.9) 10 (27.0) 3 (8.1) 7 (18.9) 37 (100.0)
Total 55 (41.4) 32 (24.1) 31 (23.3) 15 (11.3) 133 (100.0)
χ
2= 8.184, p-value = 0.042
Table 3.2의 대학교와 문항 3과의 교차분석 결과는 유의확률이 0.042로 응답에 차이가 있는 것으로 나타났다 (유의수준 0.05). 이를 살펴보면 창원대학교는‘주변사람들을 통하여(29.2%)’에 응답한 학생 의 비율이 상대적으로 높은반면 경상대학교는 ‘기타(18.9%)’에 응답한 학생의 비율이 상대적으로 높은 것으로 나타났다.
Table 3.3 Result for cross-tabulation with university and the question 5 (person (%)) Question 5 What kind of functional cosmetics have you used?
Total Sunblock Whitening cosmetics wrinkle improvement product
University Changwon 62 (80.5) 11 (14.3) 4 (5.2) 77 (100.0)
Gyeongsang 9 (37.5) 15 (62.5) 0 (0.0) 24 (100.0)
Total 71 (70.3) 26 (25.7) 4 (4.0) 101 (100.0)
χ
2= 22.586, p-value = 0.000
Table 3.3의 대학교와 문항 5와의 교차분석 결과는 유의확률이 0.000으로 응답에 차이가 있는 것으로 나타났다 (유의수준 0.001). 이를 살펴보면 창원대학교는‘자외선 차단제(80.5%)’에 응답한 학생의 비 율이 상대적으로 높은반면 경상대학교는‘미백화장품 (62.5%)’에 응답한 학생의 비율이 상대적으로 높 은것으로 나타났다.
Table 3.4 Result for cross-tabulation with university and the question 6 (person (% ))
Question 6 Do you think there is a difference between functional andordinary cosmetics, if you ever used functional cosmetics? Total A little difference Almost no difference Much difference I don’t know
University Changwon 42 (42.9) 21 (21.4) 6 (6.1) 29 (29.6) 98 (100.0)
Gyeongsang 21 (55.3) 5 (13.2) 7 (18.4) 5 (13.2) 38 (100.0)
Total 63 (46.3) 26 (19.1) 13 (9.6) 34 (25.0) 136 (100.0)
χ2= 9.181, p-value = 0.027
Table 3.4의 대학교와 문항 6과의 교차분석 결과는 유의확률이 0.027로 응답에 차이가 있는 것으로 나타났다 (유의수준 0.05). 이를 살펴보면 창원대학교는 ‘잘 모르겠다 (29.6%)’에 응답한 학생의 비율 이 상대적으로 높은반면 경상대학교는 ‘약간 차이가 있다 (18.4%)’에 응답한 학생의 비율이 상대적으 로 높은것으로 나타났다.
Table 3.5 Result for cross-tabulation with university and the question 11 (person (%))
Question 11 Do you have impulses to purchase functional cosmetics?Total I want to purchase it I have high impulse A little bit I hardly have it Never
University Changwon 14 (13.7) 7 (6.9) 52 (51.0) 17 (16.7) 12 (11.8) 102 (100.0)
Gyeongsang 14 (36.8) 5 (13.2) 17 (44.7) 0 (0.0) 2 (5.3) 38 (100.0)
Total 28 (20.0) 12 (8.6) 69 (49.3) 17 (12.1) 14 (10.0) 140 (100.0)
χ2= 16.400, p-value = 0.003
Table 3.5의 대학교와 문항 11과의 교차분석 결과는 유의확률이 0.003으로 응답에 차이가 있는 것으 로 나타났다 (유의수준 0.001). 이를 살펴보면 창원대학교 학생은 ‘끌리지 않는다 (16.7%)’의 응답자 비율이 상대적으로 높은반면 경상대학교 학생은‘사고 싶다 (36.8%)’의 응답자 비율이 상대적으로 높 은것으로 나타났다.
대학교와 나머지 문항과의 교차분석 결과는 유의하지 않은 것으로 나타났다. 응답연도와 기능성 화장 품 인지도 설문문항과의 교차분석 결과 및 성별과 기능성 화장품 인지도 설문문항과의 교차분석 결과는 Kim과 Shin (2013)을 참조하기 바란다. 다음 절에서는 생활패턴 (생활관리, 생체리듬, 올바른 자세, 스 트레스 증상)과 설문 대상자의 각 속성과의 교차분석 결과를 살펴보기로 한다.
3.3. 응답연도와 생활패턴 (생활관리, 생체리듬, 올바른 자세, 스트레스 증상)과의 교차분석 먼저, 생활패턴 중 스트레스 증상과 응답 연도와의 교차분석 결과를 살펴보기로 하자.
Table 3.6은 생활패턴 중 스트레스 증상과 응답 연도와의 교차분석 결과를 나타내고 있다. 스트레스 증상과 응답 연도와의 교차분석 결과는 유의확률이 0.028로 응답에 차이가 있는 것으로 나타났다 (유의 수준 0.05). 이를 살펴보면 2011년에는‘정상’에 응답한 비율 (26.3%)이 2012년 (17.1%)에 비해 상대 적으로 높은 반면 2012년에는 ‘중증 (종합검진요망)’에 응답한 비율 (50.3%)이 2011년 (40.7%) 보다 상대적으로 높은것으로 나타났다.
Table 3.6 Result for cross-tabulation with year and stress symptoms (person (%)) Stress symptoms
Total Normal Light stress Major stress (in need of comprehensive)
Year 2011 44 (26.3) 55 (32.9) 68 (40.7) 167 (100.0)
2012 64 (17.1) 122 (32.6) 188 (50.3) 374 (100.0)
Total 108 (20.0) 177 (32.7) 256 (47.3) 541 (100.0)
χ
2= 7.160, p-value = 0.028
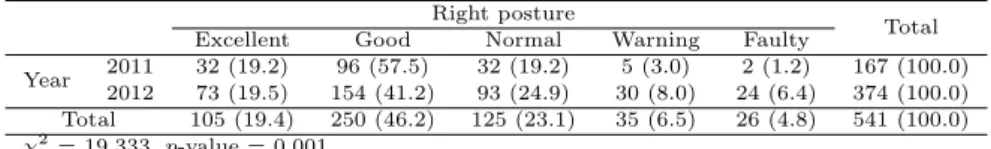
Table 3.7 Result for cross-tabulation with year and right posture (person (%)) Right posture
Total
Excellent Good Normal Warning Faulty
Year 2011 32 (19.2) 96 (57.5) 32 (19.2) 5 (3.0) 2 (1.2) 167 (100.0) 2012 73 (19.5) 154 (41.2) 93 (24.9) 30 (8.0) 24 (6.4) 374 (100.0) Total 105 (19.4) 250 (46.2) 125 (23.1) 35 (6.5) 26 (4.8) 541 (100.0) χ
2= 19.333, p-value = 0.001
다음으로올바른 자세와 응답 연도와의 교차분석 결과를 Table 3.7에 나타내었다. 이들에 대한 교차분 석결과는 유의확률이 0.001 로 응답에 차이가 있는 것으로 나타났다 (유의수준 0.01). 이를 자세하게 살펴보면 2011년에는 ‘양호’에 응답한 비율 (57.5%)이 높았던 반면 2012년에는 ‘주의 (8%)’와 ‘불량
(6.4%)’에 응답한 비율이 2011년에 비해 상대적으로 높았던 것으로 나타났다. 이외 나머지 생체리듬과 응답연도, 생활관리와 응답연도의 교차분석 결과는 각각 유의한 차이가 없는 것으로 나타났다.
3.4. 성별과 생활패턴 (생활관리, 생체리듬, 올바른 자세, 스트레스 증상)과의 교차분석
본 절에서는 성별과 생활패턴과의 교차분석 결과를 살펴보기로 하자. 성별과 생활패턴과의 교차분석 결과는 성별과 생활패턴 중 생체리듬, 올바른 자세 및 스트레스 증상은 응답에 유의한 차이가 있는 것으 로 나타났다. Table 3.8, Table 3.9 및 Table 3.10은 각각 성별과 생체리듬, 성별과 올바른 자세 및 성별 과 스트레스 증상과의 교차분석 결과이다.
이것을 좀 더 상세하게 살펴보기로 하자. Table 3.8의 성별과 생체리듬과의 교차분석 결과는 유의확 률이 0.000으로 응답에 유의한 차이가 있는 것으로 나타났다 (유의수준 0.001). 이들 내용을 살펴보면 남학생은‘양호 (23.6%)’, ‘매우양호 (16%)’에 응답한 비율이 여학생에 비해 상대적으로 높은 반면 여학 생은 ‘불량 (32.3%)’에 응답한 비율이 남학생에 비해 상대적으로 높은 것으로 나타났다.
Table 3.8 Result for cross-tabulation with gender and biorhythm (person (%)) Biorhythm
Total
Extremely poor Poor Usually Good Very good
Gender Male 23 (10.8) 31 (14.6) 74 (34.9) 50 (23.6) 34 (16.0) 212 (100.0) Female 35 (12.0) 94 (32.3) 108 (37.1) 43 (14.8) 11 (3.8) 291 (100.0) Total 58 (11.5) 125 (24.9) 182 (36.2) 93 (18.5) 45 (8.9) 503 (100.0) χ
2= 41.485, p-value = 0.000
Table 3.9 Result for cross-tabulation with gender and right posture (person (%)) Right posture
Total
Excellent Good Average Attention Bad
Gender Male 56 (26.4) 105 (49.5) 34 (16.0) 9 (4.2) 8 (3.8) 212 (100.0) Female 39 (13.4) 133 (45.7) 80 (27.5) 22 (7.6) 17 (5.8) 291 (100.0) Total 95 (18.9) 238 (47.3) 114 (22.7) 31 (6.2) 25 (5.0) 503 (100.0)
χ
2= 21.717, p-value = 0.000 //
Table 3.10 Result for cross-tabulation with gender and stress symptoms (person %)) Stress symptoms
Total Normal Light stress Major stress (in need of comprehensive)
Gender Male 65 (30.7) 85 (40.1) 62 (29.2) 212 (100.0)
Female 33 (11.3) 82 (28.2) 176 (60.5) 291 (100.0)
Total 98 (19.5) 167 (33.2) 238 (47.3) 503 (100.0)
χ
2= 54.033, p-value = 0.000
또한, Table 3.9의 성별과 올바른 자세와의 교차분석 결과는 유의확률이 0.000로 응답에 차이가 있는 것으로 나타났다 (유의수준 0.001). 이를 살펴보면 남학생은‘우수 (26.4%)’에 응답한 비율이 높은 반 면 여학생은‘보통 (27.5%)’에 응답한 비율이 상대적으로 높은 것으로 나타났다.
마지막으로 Table 3.10의 성별과 스트레스 증상과의 교차분석 결과는 유의확률이 0.000으로 응답에 차이가 있는 것으로 나타났다 (유의수준 0.001). 이를 살펴보면 남학생은 ‘정상 (30.7%)’에 응답한 비 율이 여학생에 비해 상대적으로 높은반면 여학생은‘중증 (종합검진요망) (60.5%)’에 응답한 비율이 남 학생에 비해 상대적으로 높은것으로 나타났다.
4. 결론 및 제언
본 연구는 창원대학교와 진주 소재 경상대학교의 교양과목으로 개설되어 있는 “화장품학”을 수강하 는 학생을 대상으로, 기능성화장품의 인지도와 생활패턴에 대한 조사를 수행하고, 해당 설문 문항과 생 활패턴과의 교차분석을 통해, 유의성을 검정하였다. 검정결과를 살펴보면, 먼저 속성 중에서 대학교와 기능성 화장품의 인지도와 관련한 16개의 설문문항과의 교차분석 결과는 문항 3 (유의확률 0.042), 문
항 5 (유의확률 0.000), 문항 6 (유의확률 0.027) 그리고 문항 11 (유의확률 0.003)만 유의수준 5%에서 응답에 차이가 있었으며, 다른 문항과는 유의한 차이가 없는 것으로 나타났다. 응답연도와 기능성 화장 품 인지도 설문문항과의 교차분석 결과 및 성별과 기능성 화장품 인지도 설문문항과의 교차분석 결과는 Kim과 Shin (2013)을 참조하기 바란다.
다음으로 속성과 생활패턴과의 교차분석 결과는 생활패턴 중 스트레스 증상과 응답연도는 유의수준 5%에서 유의확률이 0.025로, 올바른 자세와 응답연도는 유의수준 1%에서 유의확률이 0.001로 응답에 차이가 있는 것으로 나타났으며, 나머지 생체리듬과 응답연도 및 생활관리와 응답연도는 각각 유의한 차 이가 없는 것으로 나타났다.
마지막으로 성별과 생활패턴과의 교차분석결과는 성별과 생체리듬, 성별과 올바른 자세 및 성별과 스 트레스 증상과의 교차분석 결과는 유의수준이 0.1%에서 유의확률이 모두 0.000으로 응답에 차이가 있 는것으로 나타났으며, 성별과 생활관리와의 교차분석 결과는 유의한 차이가 없는 것으로 나타났다.
향후과제로는 앞에서 설명한 결과들 중에서 응답에 유의한 차이를 보인 교차분석 결과를 특정한 수강 집단을 대상으로 한것이 아닌 일반인 특히 전업주부 및 직장인 여성을 대상으로도 동일한 조사를 하여 이들결과 간의 차이를 조사해 볼 필요성이 있는 것으로 생각된다.
Appendix
Table A.1 Survey for functional cosmetics awareness
Survey for Functional Cosmetics Awareness Questions regarding personal information
1. What is your sex?
①Male ② Female
2. How old are you? (only years old) 3. What do you do?
①A college student ② A housewife
③worker at cosmetics related industry ④ Others 4. Where do you live? ex. (Changwon )
( )
Questions regarding functional cosmetics awareness 1. To what degree do you know Cosmetics Act?
①I know exactly. ②I know roughly.
③Absolutely no idea.
2. To what degree do you know functional cosmetics?
①I know exactly. ②I know roughly.
③Absolutely no idea.
3. If so, from what kind of ways do you get information?
①Mass media ② Cosmetics shop
③People around me ④ Others
4. Have you ever used functional cosmetics?
①I have used it.
②I have never used it and I am considering using it.
5. What kind of functional cosmetics have you used?
①Sunblock ② Whitening cosmetics
③Wrinkle improvement products
6. Do you think there is a difference between functional and ordinary cosmetics, if you ever used functional cosmetics?
①A little difference. ②Almost no difference.
③Much difference. ④I don’t know.
7. Where do you purchase functional cosmetics?
①Shops specializing in cosmetics ② Department store
③Drugstore ④ Door-to-door sale
⑤Mail order ⑥ Convenience store
8. What do you think should be improved most in functional cosmetics?
①High prices ② Product quality
③Promotion ④ Relatively low availability 9. What is your criteria of purchasing functional cosmetics?
①Effectiveness ② Company name ③ Prices
④Advertisement ⑤ Others
10. Which do you prefer, domestically produced or imported functional cosmetics?
①The more effective one after using them
②Absolutely imported one
③Absolutely domestically produced one 11. Do you have impulses to purchase functional cosmetics?
①I want to purchase it. ②I have high impulses.
③A little bit. ④I hardly have it. ⑤Never 12. How much do you trust in functional cosmetics?
①I trust a little bit. ②I trust generally.
③I do not trust.
13. If some products which are known to have special functions are approved as functional products, which one would you like to have most?
①Acne cure products ② Atopy cure products
③Slimming products ④ Dandruff, falling hair
⑤Aromatherapy products Others
14. How do you think about the introduction of functional cosmetics ingredient labeling system?
①It should be introduced.
②It doesn’t have to be introduced. ③I don’t know.
15. How do you think about the advertising strategy of functional cosmetics in which they are compared with ordinary cosmetics?
①It needs to be strengthened.
②It doesn’t need to be made. ③I don’t know.
16. How much do you think functional cosmetics contribute to the development of cosmetics industry at large?
①A little bit. ②A big help. ③Hardly.
Table A.2 Questions regarding life pattern
#1. Healthy life management
(Department : Age : Sex : )
No. Questions Score Remarks
1 I eat on a regular basis, and do not eat at night.
2 I take a break for about 20 minutes after having a meal.
3 I do not eat salty and sugary foods much.
4 I brush my teeth after a meal.
5 I do not often drink alcohol.
6 I eat a lot of vegetables and fruits.
7 I try not to eat snacks.
8 I do not smoke.
9 I walk over 2Km every day.
10 I work out for more than 20 minutes every day.
11 I sleep for over 5 hours.
12 I keep my weight steady.
13 I have much interest in my health.
14 I have a happy and warm family.
15 My neighborhood is quiet and stable.
In case you check ”yes”, you get 1 point per a question. Total
Decision table Very good Good Normal Poor Very poor
13-15 10-12 7-9 4-6 0-3
#2. Healthy biorhythm
(Department : Age : Sex : )
No. Questions Score Remarks
1 I feel refreshed when I wake up in the morning.
2 I feel my body is light and walk fast.
3 I don’t feel difficulty in breathing.
4 My mind is clear and can concentrate on work.
5 My body don’t feel sick.
6 My appetite improves and my weight keeps steady.
7 When I climb the steps fast, I don’t get out of breath.
8 I don’t usually feel dizzy.
9 I don’t get bothered by ambient noise, when I work.
10 Even if I work all day long, I don’t feel tired severely.
11 I tend to solve a variety of problems easily.
12 I can easily endure irritating things.
13 I can easily fall asleep.
14 My hands and feet don’t often go numb.
15 I tend to move my body much.
In case you check ”yes”, you get 1 point per a question. Total Decision table Very healthy Healthy Normal Unhealthy Very unhealthy
14-15 12-13 8-11 4-7 0-3
#3. Self-test for stress symptoms
(Department : Age : Sex : )
Evaluation Questions Evaluation Questions
1. I have a dull feeling in the head. 16. I lost my weight recently.
2. I feel weary in the eye. 17. I feel tired easily.
3. I sometimes feel stuffed in the nose. 18. Sometimes I don’t wake up refreshed.
4. I sometimes feel dizzy. 19. I don’t get motivated to work.
5. I sometimes want to lean against the pillar. 20. I don’t fall asleep easily.
6. I sometimes hear something in the ear. 21. I dream a lot and have a broken sleep.
7. I sometimes get an infection in my mouth. 22. I wake up at 1 or 2 at night.
8. I sometimes have a sore throat. 23. Sometimes I feel hard to breathe.
9. My tongue sometimes get whitened. 24. Sometimes my heart beats so fast.
10. I don’t eat my favorite foods. 25. My heart sometimes aches.
11. My stomach gets heavy after a meal. 26. I frequently catch a cold.
12. My belly gets tight and sick. 27. I feel angry for trivial things.
13. My shoulder gets sick. 28. I sometimes feel cold in my feet and hands.
14. I sometimes feel pain in my back and belly. 29. I sometimes perspire in my armpit and palm.
15. Tiredness doesn’t pass away easily. 30. I sometimes feel afraid to meet someone.
Check the relevant items and then add the number of the items!! Total
Decision table
Normal Light stress Major stress in need of comprehensive check up
Less than 5 5-10 11-20
#4. Right posture evaluation
(Department : Age : Sex : )
evaluation Questions evaluation Questions
1. Neck posture evaluation 4. Pelvis posture evaluation
1) I feel inconvenient when I move my neck from right to left (1 point).
1) I feel inconvenient in the pelvis when I walk (1 point).
2) I feel inconvenient when I move my neck back
and forth (1 point). 2) I tend to lean to one side when I sit (1 point).
3) I have a headache along with an ache in the neck (2 points)
. 3) I feel pain in the pelvis when I stand up after sitting for a while (2 points).
4) My arms and shoulder go numb along with an ache in the neck (3 points).
4) I feel numb in the
leg along with pain in the pelvis(3 points).
2. Back posture evaluation 5. Overall body balance
1) One shoulder go above the other (1 point). 1) My head leans to one side (1 point).
2) I feel inconvenient when I sit upright
(1 point). 2) One shoulder goes above the other (1 point).
3) I feel numb inside the shoulder blade (2 points).
3) One side of the pelvis goes above the other (1 point).
4) I feel stuffed in my heart and feel pain in the
back (3 points). 4) One leg is shorter than the other (1 point) .
3. waist posture evaluation 5) Trousers and skirt turn to one side (1 point).
1) I feel inconvenient when I bend forward and lean backward (1 point).
2) I can’t stand long due to waist pain (2 points). Excellent 0 point : You have a good posture.
3) I can’t sit long due to waist pain (2 points). Good 1-5 points : Try to keep your posture right....
4) I feel numb in the leg along with waist pain (3 points).
Normal 6-10 points : You need to pay attention to your posture!! You need to keep stretching your body and work out your muscles.
Warning 11-15 points : You need to have your posture tested by specialists, and keep your posture corrected by way of training!!
Check the relevant items and add thepoints!! Faulty Over 16 points : You need to see a doctor!!!
Total
References
Ban, S. M., Lee, K. J. and Yang, J. O. (2012). The effects of participation in a combined exercise program on the metabolic syndrome indices and physical fitness in the obese middle-aged women. Journal of the Korean Data & Information Science Society, 23, 703-715.
Choi, H. S. and Ha, J. C. (2012). A study on the relations between the quality of life and the life satisfaction of the elderly. Journal of the Korean Data & Information Science Society, 23, 559-568.
Choi, H. S., Lee, H. K. and Ha, J. C. (2012). The influence of smartphone addiction on mental health, campus life and personal relations- Focusing on K university students. Journal of the Korean Data &
Information Science Society, 23, 1005-1015.
Han, J. M., Lee, K. J. and Yang, J. O. (2012). The effects of participation in a combined exercise program on the metabolic syndrome indices and physical fitness in the obese middle-aged women. Journal of the Korean Data & Information Science Society, 23, 703-715.
Hong, C. S., Jeong, C. H., Cho, M. H. and Kim, H. J. (2012). Statistical analysis of actual living condition of the elderly and welfare need survey data. Journal of the Korean Data & Information Science Society, 23, 13-24.
Kim, B. K. and Han, J. D. (2002). The study on the awareness of functional cosmetics in Changwon-Masan city. Journal of the Society of Cosmetic Scientists of Korea, 28, 5-14.
Kim, B. K. and No, E. J. (2007). Cosmetics, Changwon National University Press, Changwon, 149-154.
Kim, B. K. and Shin, J. K. (2013). An investigation on awareness of paticular lesson group about functional cosmetics. Journal of the Korean Society of Cosmetics and Cosmetology, 3, 145-154.
Kim, B. K., Shin, Y. M. and Han, J. D. (2008). An investigation on awareness of the woman works and housewives in Changwon area about the functional cosmetics. Journal of the Research Institute of Industrial Technology, 22, 127-133.
Kim, Y. C., Kim, Y. S., Yang, J. O., Lee, B. J. and Lee, J. S. (2013). Effects of aerobic and combined exercise on body composition and blood lipid in the middle-aged women. Journal of the Korean Data
& Information Science Society, 24, 1241-1251.
2014, 25
(6)
,1273–1281
Statistical analysis of life pattern and functional cosmetics awareness †
Jae-Kyoung Shin
1
1Department of Statistics, Changwon National University
Abstract
As a variety of industrial technology advances with various materials developed, cosmetics industry in general is witnessing many kinds of new cosmetic products. At the same time, Cosmetics Act becomes effective, and cosmetics ingredient labeling is implemented. Concerns with life pattern such as life management, biorhythm, right posture, and stress symptoms are on the increase in order to seek high-quality life as well. These life patterns are closely connected not only with life quality and health but with skin management, and thus this paper conducts a survey on the connection between functional cosmetics awareness and life pattern. Results show that out of 16 questions concerning cosmetics awareness, responses to question number 3, 5, 6 and 11 have relevant differences among colleges. Furthermore, the results of cross analysis with life pattern show that there are relevant differences between the year of responses and stress symptoms and between the year of responses and right posture. Lastly, it is shown that answers to questions regarding gender and biorhythm, gender and right posture, and gender and stress symptoms are relevantly different. Further research is needed to reveal the differences between college students and ordinary people at large.
Keywords: Awareness, cosmetics act, cross-tabulation, functional cosmetics, life pat- tern.
†
This research is financially supported by Changwon National University in 2013-2014.
1