Geosciences Journal
Vol. 12, No. 3, p. 265−275, September 2008 DOI 10.1007/s12303-008-0027-4
ⓒ The Association of Korean Geoscience Societies and Springer 2008
Statistical evaluation of groundwater quality around an uncontrolled landfill:
implication for plume migration pathways
ABSTRACT: When leachate emanates from an uncontrolled land- fill, it poses a threat to the groundwater resources of the surround- ing areas. Thus, regular monitoring is essential to protect the groundwater from contamination. In this study, an evaluation is carried out on the quality of groundwater affected by the leachate deriving from an uncontrolled landfill situated in a valley. A non- parametric trend analysis revealed that alkalinity levels were increasing at most monitoring wells, indicating the continuous increase of biodegradation of organic matter. According to a clus- ter analysis, similar chemical groups developed in a parallel direc- tion to that of groundwater flow. Each group indicates different redox levels and various degrees of landfill leachate effect. This geographical distribution of groups with similar chemical proper- ties is closely associated with local groundwater flow and land sur- face permeability. However, an evaluation of the effect of recharge flow from the surrounding mountains and of the vertical compo- nent of groundwater in the recharge area is essentially required in order to enhance our understanding of redox zonation or distri- bution of groundwater quality affected by the landfill leachate.
Key words: uncontrolled landfill, leachate, groundwater, biodegra- dation, recharge
1. INTRODUCTION
Until 1990, most landfills in Korea had been constructed without suitable bottom liners or a leachate collecting sys- tem in Korea (Lee et al., 2006a). When landfills are con- structed in a recharge area such as in mountainous valleys, the leachate emanating from the uncontrolled landfills poses a considerable threat to groundwater resources in downgradient residential areas (Lee et al., 2008). As noted in Lee et al. (2007), groundwater development has drasti- cally increased in Korea since the 1980s. Groundwater has been used for various purposes, including domestic, agri- cultural and industrial. In areas where municipal water work services are incomplete, groundwater is essential for water supply. In particular, in agricultural areas, groundwa- ter is commonly developed for the irrigation of rice and other plants generally because of the economic advantage it provides.
It is known that there are about 1,000 uncontrolled land- fills in Korea (Park et al., 2006), for which proper remedi- ation activity is required. However, due to limited community resources, including economic budgets and administrative encumbrances, the urgent remediation measures required impose a heavy burden on relevant central and provincial environmental authorities. Therefore, when urgent remedi- ation of uncontrolled landfills is not available, regular mon- itoring of groundwater quality around the landfills is the best practical strategy for protecting valuable groundwater resources from contamination by landfill leachates. Gener- ally, landfills take a considerable amount of time to natu- rally stabilize, and thus long-term monitoring is inevitable.
In the meantime, groundwater contamination resulting from landfill leachate may be attenuated via a range of nat- ural processes, such as dilution, dispersion, sorption and biological degradation (Wiedemeier et al., 1999; Lee et al., 2008). However, this natural attenuation is not always acceptable for all landfill sites. The fate of contaminated groundwater is largely dependent on the hydrogeological condition of the specific landfill site. Thus, understanding the relationship between the hydrogeological condition and the evolution of the contaminated groundwater is essential in order to efficiently monitor groundwater in landfill sites.
In this context, an examination is carried out in this study on the groundwater quality around an uncontrolled landfill located in the mountainous valley of an up-gradient area.
The trend in the variation of groundwater quality was revealed using a non-parametric trend test and the geo- graphical distribution of groundwater quality was analyzed from a multivariate cluster analysis. Hydrological and geo- physical investigation data were also used to assist the inter- pretation of this analysis, which significantly enhanced the understanding of the behavior of contaminated groundwater.
2. METHODS AND MATERIALS 2.1. Site Description and Hydrogeology
The uncontrolled landfill used for this study is located in Joung-Ku Park
Jin-Yong Lee*
Tae-Dong Kim
Department of Environmental Engineering, Andong National University, Andong 760-749, Korea Department of Geology, Kangwon National University, Chuncheon 200-701, Korea
Department of Environmental Engineering, Andong National University, Andong 760-749, Korea
*Corresponding author: [email protected]
Wonju, about 100 km east of Seoul, Korea (Fig. 1). From 1982 to 1995, domestic wastes have been uncontrollably dumped into the landfill (Lee et al., 2006b). The surface area of the landfill is 6,000 m2, 41,000 m3 of which consists of domestic wastes. The landfill is surrounded by low relief mountains. It was formed without a suitable bottom liner and with only a leachate settling pond located at the lower perimeter (Park et al., 2007). At present, the settling pond is not properly functioning and has been abandoned. Land- fill leachate flows out of the landfill from a drainage pipe and from cracks formed in the concrete barrier wall installed at the bottom of the landfill. The amount of leachate discharged significantly increases during the wet season (late May-early September). At the surface of the drainage pipe and the concrete barrier wall, a large amount of dark pink rusty materials is observed. XRD analyses identified that this material contained iron and manganese oxides. An upper area of the landfill is currently being used as a motorcycle racecourse. Because the surface of the landfill has not been appropriately sealed, it is expected that precipitation will readily percolate in the subsurface of the landfill.
Below the landfill, there is a sandy open field where a number of vegetables, including corn, sesame, sweet potato and pumpkin are occasionally cultivated (see Fig. 1a). Arti- ficial fertilizer is not applied to this field because of the con- siderable amount of nutrients provided by the landfill. The open field was formerly used as a water reservoir for the agricultural irrigation of the downgradient paddy fields.
Most of the area below the open field is used as paddy fields to cultivate rice. A number of sporadic groundwater wells have been found in the paddy fields. Residential houses are located approximately 600 m from the landfill.
Near the residential area, a 50 m wide stream runs from west to east. It is known that the residents are serviced by water from the municipal supply.
Geological logging data obtained during the installation of shallow groundwater monitoring wells revealed that there are three simple hydrogeological layers in the open field (Lee et al., 2006a, 2007a). The uppermost layer is mainly comprised of sandy soil, which readily receives per- colation from site rainfall. According to permeameter tests, the saturated hydraulic conductivity of the upper layer is in Fig. 1. Location of the studied landfill also showing location of the groundwater monitoring wells below the landfill. Arrows indicate local groundwater flows.
the order of 10-4 cm/s. The thickness of the sandy soil (1~3.5 m) gradually increases with an increase in distance from the concrete barrier wall. Water tables are mostly formed in this layer. Below the sandy layer, there is a weathered layer (mostly decomposed rock) with a significant number of fractures. The thickness of this layer ranges from 1.5 to 2.5 m.
The two upper layers (sandy soil and weathered rock) form a shallow aquifer in this area. The average hydraulic con- ductivity of the two layers ranged from 10-4 to 10-2 cm/s.
Below the weathered layer, a hard rock (granite) with less fractures is found, in which hydraulic conductivity is less than 10-5 cm/s (Kim et al., 2007).
For the downgradient paddy fields, the uppermost layer consists of clayey silts of low permeability, which facilitates water storage for rice cultivation. Below the 0.5 m thick silt layers, there is a hard rock layer with few fractures. The permeability of this hard rock layer is estimated to be in the order of 10-5~10-6 cm/s (Lee et al., 2006a). The lower per- meability would impede groundwater flow in this layer.
However, to a certain extent, the significant thickness of this layer enables agricultural irrigation in this area.
From results of an earlier investigation carried out by the MOE (Ministry of Environment), leachate from this landfill contained CODMn 73~86 mg/L, CODCr 136~263 mg/L, BOD 27~44 mg/L, total-N 112~186 mg/L, NH4-N 72~143 mg/L, NO3-N 0.00~1 mg/L and Cl- 417~1,238 mg/L (Kim et al., 2007). In a preliminary analysis of this study (August 2004), the leachate emanating from the landfill contained BOD 81.2 mg/L, CODCr 137.1 mg/L, CODMn 75.2 mg/L, NO3-N 1.61 mg/L, NO2-N 10.1 mg/L, Fe 13.49 mg/L and NH4-N 103.85 mg/L. Thus, it was expected that ammonia might be a considerable problem to groundwater resources in this area (Lee et al., 2006a).
2.2. Field Investigation and Chemical Analysis
In order to evaluate groundwater quality, 15 monitoring wells have been recently installed around the landfill (see well locations in Fig. 1c) using a vehicle mounted percus- sion drilling machine. Of these, 8 wells (WW1~WW8) were first installed in December 2004, while the other 5 wells were constructed in April 2005. The depths of the wells range between 3 and 7 m, with the exception of the first 1~2 m, they were fully screened. Thus, they are tapped at multiple hydrogeological layers including the sandy soil, the weathered rock layer and the partly hard rock that has few fractures.
Groundwater sampling and subsequent field and labora- tory analyses for WW1~WW8 were conducted 21 times during February 2005~October 2006. However, for the later installed wells, 11~17 sampling rounds were applied. Water from the WWC1 well was not normally sampled because the water levels were mostly below the well depth. Field determined parameters included water temperature, dissolved
oxygen (DO), oxidation-reduction potential (ORP), electri- cal conductivity (EC) and pH, which were measured by standard probes (YSI 556). Concentrations of Fe2+, Mn2+, NH3-N and sulfide were also identified in the field using a spectrophotometer (DR2010, HACH). Levels of dissolved organic carbon (DOC), Cl-, NO3-, NO2-, Alkalinity and SO42- were identified in the laboratory of Sangji University in Wonju, Korea. An analysis of major ions (cations and anions) was once conducted in October 2005.
2.3. Statistical Analysis
For sparsely or irregularly sampled data, or when there is a limited amount of data, the variation trend can be ana- lyzed by non-parametric trend tests. Representative non- parametric analyses include the Sen’s test and the Mann- Kendall trend test (Lee and Lee, 2003; Lee et al., 2006c).
These tests provide information for variation trends of a specific groundwater parameter at a given confidence level.
In this study, the Sen’s test (Sen, 1968) was adopted, which was applied only for groundwater parameters for 8 wells (WW1~WW8) because these parameters were determined for the wells over one hydrological year. In addition, for the trend determination, a confidence level of 95% was applied in this study.
The cluster analysis is a type of multivariate analysis where total target samples can be divided into a finite num- ber of groups that have similar properties (Lee et al., 2001).
The cluster analysis was conducted for the groundwater data (field determined parameters and major ions) obtained from the sampling round of October 2005. Before the cluster analysis was carried out, a data distribution was examined using QQ plot (Ryan et al., 1995). Most of the groundwater parameters showed normal distribution without any trans- formation at a 95% confidence level. However, NO3- with HCO3- and DOC showed a log-normal and log-log normal distribution (logarithmic transformation of log-normal data), respectively. Groundwater parameters (Fe2+, Mn2+, NH3-N, NO2-, sulfide) that showed a non-normal distribution or that had null values were excluded for further analysis. The 15 groundwater parameters were finally standardized using z-transformation in order to equalize their weights in the analysis results. Using these transformed variables, a cluster analysis was conducted and linkage was completed using the Ward’s minimum variance method (Ward, 1963).
3. RESULTS AND DISCUSSION 3.1. Groundwater Chemistry
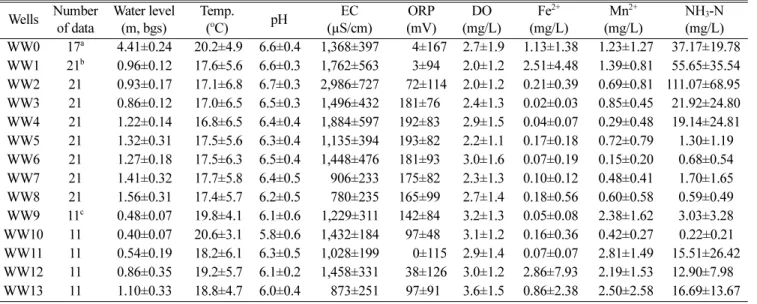
Table 1 shows the statistics of groundwater parameters monitored in 14 wells (with the exception of WWC1).
While the monitoring periods differ somewhat, the statistics may provide important implications for the condition of
groundwater according to the distance from the landfill.
With the exception of the wells within the landfill, the water levels of most wells ranged between approximately 0.5~1.5 m below the ground surface. By considering the absolute elevations of the water levels, it was deduced that a drastic head drop had occurred between the interior and exterior of the landfill due to the concrete barrier wall. The water tem- peratures of the interior wells appeared to be slightly ele- vated possibly due to the fermentation of microorganisms (Lee et al., 2002). However, the relatively high tempera- tures of most downgradient wells might be influenced by the surface temperature.
The pH values of the groundwaters were slightly acidic, showing a gradual decreasing trend from the landfill to the
downgradient area. This result somewhat contradicts the expectation that organic acids generated during decompo- sition of organic matters will lower the pH values within the landfill (pH ~5), gradually increasing with distance from the landfill (Christensen et al., 1994). The water conditions of the interior wells (WWC1 and WW0) may not appro- priately represent those of the interior of the landfill because the wells were somewhat shallower than the land- fill depth (about 50 m), thus they would be more readily influenced by external conditions such as rainfall and atmo- spheric contact. To a certain extent, rainwater that has per- colated into the landfill would neutralize the pH level of the landfill, because the surface of this particular landfill is gen- erally permeable (Kim et al., 2007).
Table 1. Basic statistics of groundwater qualities around the landfill (mean ± standard deviation) Wells Number
of data
Water level (m, bgs)
Temp.
(oC) pH EC
(µS/cm)
ORP (mV)
DO (mg/L)
Fe2+
(mg/L)
Mn2+
(mg/L)
NH3-N (mg/L) WW0 17a 4.41±0.24 20.2±4.9 6.6±0.4 1,368±397 4±167 2.7±1.9 1.13±1.38 1.23±1.27 37.17±19.78 WW1 21b 0.96±0.12 17.6±5.6 6.6±0.3 1,762±563 3±941 2.0±1.2 2.51±4.48 1.39±0.81 55.65±35.54 WW2 21 0.93±0.17 17.1±6.8 6.7±0.3 2,986±727 72±114 2.0±1.2 0.21±0.39 0.69±0.81 111.07±68.95 WW3 21 0.86±0.12 17.0±6.5 6.5±0.3 1,496±432 181±761 2.4±1.3 0.02±0.03 0.85±0.45 21.92±24.80 WW4 21 1.22±0.14 16.8±6.5 6.4±0.4 1,884±597 192±831 2.9±1.5 0.04±0.07 0.29±0.48 19.14±24.81 WW5 21 1.32±0.31 17.5±5.6 6.3±0.4 1,135±394 193±821 2.2±1.1 0.17±0.18 0.72±0.79 1.30±1.191 WW6 21 1.27±0.18 17.5±6.3 6.5±0.4 1,448±476 181±931 3.0±1.6 0.07±0.19 0.15±0.20 0.68±0.541 WW7 21 1.41±0.32 17.7±5.8 6.4±0.5 906±233 175±821 2.3±1.3 0.10±0.12 0.48±0.41 1.70±1.651 WW8 21 1.56±0.31 17.4±5.7 6.2±0.5 780±235 165±991 2.7±1.4 0.18±0.56 0.60±0.58 0.59±0.491 WW9 11c 0.48±0.07 19.8±4.1 6.1±0.6 1,229±311 142±841 3.2±1.3 0.05±0.08 2.38±1.62 3.03±3.281 WW10 11 0.40±0.07 20.6±3.1 5.8±0.6 1,432±184 97±481 3.1±1.2 0.16±0.36 0.42±0.27 0.22±0.211 WW11 11 0.54±0.19 18.2±6.1 6.3±0.5 1,028±199 0±115 2.9±1.4 0.07±0.07 2.81±1.49 15.51±26.42 WW12 11 0.86±0.35 19.2±5.7 6.1±0.2 1,458±331 38±126 3.0±1.2 2.86±7.93 2.19±1.53 12.90±7.981 WW13 11 1.10±0.33 18.8±4.7 6.0±0.4 873±251 97±911 3.6±1.5 0.86±2.38 2.50±2.58 16.69±13.67
a Data period is April 2005-October 2006
b Data period is February 2005-October 2006
c Data period is August 2005-October 2006
Wells Number of data
Sulfide (mg/L)
DOCa (mg/L)
Cl- (mg/L)
NO3-N (mg/L)
SO4
(mg/L)
NO2-N (mg/L)
Alkalinity (mg/L) WW0 17 0.00±0.00 103.04±226.92 84.35±75.18 0.92±1.261 4.26±3.801 2.31±5.48 562.00±451.02 WW1 21 0.00±0.00 153.65±56.39 123.47±35.10 3.53±6.551 2.34±2.821 0.29±0.39 573.71±236.44 WW2 21 0.01±0.01 155.72±65.69 238.22±62.72 12.75±31.82 3.31±4.201 4.46±13.15 914.59±376.95 WW3 21 0.01±0.01 118.12±11.65 149.21±71.74 51.96±31.02 9.43±5.121 0.84±1.69 294.32±139.91 WW4 21 0.01±0.02 120.09±13.45 211.53±85.10 86.38±49.19 8.02±5.021 0.38±0.42 274.75±265.79 WW5 21 0.01±0.03 113.51±8.87 121.81±69.47 38.27±19.93 12.00±6.381 0.06±0.06 201.81±82.47 WW6 21 0.01±0.03 120.19±13.69 147.85±75.70 44.90±25.50 12.54±5.881 0.66±1.32 329.49±211.87 WW7 21 0.00±0.01 116.02±12.73 94.31±50.50 6.20±4.501 37.30±21.29 0.02±0.03 244.40±72.39 WW8 21 0.00±0.01 111.59±8.55 84.89±49.88 3.14±4.321 37.51±21.71 0.04±0.06 209.15±75.77 WW9 11 0.00±0.00 112.25±10.14 105.23±56.01 40.22±23.55 11.45±2.931 0.76±1.36 216.79±82.53 WW10 11 0.00±0.00 117.71±4.11 295.39±66.97 4.85±1.341 6.01±0.841 0.15±0.22 224.67±104.55 WW11 11 0.00±0.00 112.24±6.35 71.95±21.18 0.65±0.911 10.10±5.321 0.12±0.24 329.37±111.67 WW12 11 0.00±0.00 114.07±8.88 218.35±57.73 1.28±1.731 8.22±4.021 0.25±0.33 318.49±209.14 WW13 11 0.01±0.02 118.10±3.03 129.83±45.19 1.87±3.431 7.06±3.281 0.10±0.11 158.10±82.79
a Dissolved organic carbon
Results show that electrical conductivity (EC) is highest both within the landfill and in most wells proximal to the landfill. While the EC levels generally decreased with dis- tance, they were elevated in the downgradient wells (WW9~WW12). Levels of EC for these wells are nearly equivalent to those of the upgradient wells (WW3~WW6).
An opposite distribution trend was shown for the ORP lev- els, where the lowest was recorded in the landfill, while the highest was found in the upper part of the sandy open field caused by the frequent direct infiltration of rainfall due to the permeable sandy land surface (Lee et al., 2006a; Table 2).
At the most downgradient wells, the ORP levels were again lower. While a somewhat large variation between ORP lev- els was observed, only a finite range (2.0~3.6 mg/L) of mean concentrations of DO was shown and the least vari- ation was observed over the travel path (coefficient of vari- ation=0.17). The substantial concentration of DO even in the landfill may be related to the permeable surface prop- erty of the landfill and the sandy open field. Concentrations of manganese (Mn2+) and ferrous iron (Fe2+) are closely cor- related (r>0.82 at 95% confidence level) and they indicate levels of a reduction condition. It is significant that these concentrations were highest within the landfill and in the most downgradient wells that were beneath the paddy fields.
As expected, the highest concentrations of NH3-N were found in the wells that were proximal to the landfill, while the lowest concentrations were found in the middle of the open field, again in the most downgradient wells. Sulfide was almost undetectable within and below the landfill.
Thus, it was inferred that either sulfate reduction in this landfill is not substantial or sulfide was again oxidized to sulfate due to oxygen supplied by rainfall infiltration. Only DOC showed a rather a monotonous decreasing trend with the distance from the landfill, which is a result of fermen- tative decomposition of organic matter by microorganisms.
A general decreasing trend according to distance was also observed with chloride, a conservative ion. However, largely elevated concentrations of Cl- at downgradient wells (WW10~
WW13) may indicate the possibility of an additional source from another pathway. However, because the main source of chloride in shallow groundwater includes landfill leachate similar to that found in this study, it appeared to be unrea- sonable to include the additional sources of chloride ema- nating from septic tanks, road salts, and seawater intrusion.
This aspect is discussed in more detail in section 3.3.
A depletion of nitrate levels was found in the landfill due to nitrate reduction, while it was enriched in the permeable open field. However, nitrate levels were again lower in the
paddy fields. This variation shows a somewhat opposite trend to that of NH3-N (a reduced form of nitrogen). Reduced NH3-N emanating from the landfill can be converted to nitrate in an aerobic condition. Depleted nitrate in the uppermost wells accompanied elevated NO2-N concentra- tions. While sulfide was not substantially detected within and below the landfill, the relatively depressed levels of sul- fate (SO42-) were found in the uppermost wells, and ele- vated sulfate levels in downgradient wells may indicate to a certain extent the occurrence of sulfate reduction. As also expected, alkalinity (as HCO3-) levels were elevated in the uppermost wells due to the decomposition of organic mat- ter, while they were lower in the open field (Basberg et al., 1998).
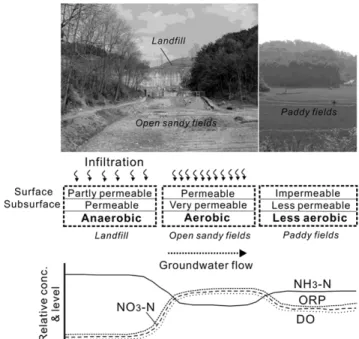
Lee et al. (2006a) has simply attributed this distribution of all these groundwater parameters or the changes in groundwater quality with distance to a significant change in the hydrogeological setting (Fig. 2). It is assumed that redox sensitive parameters would change according to the differ- ence in surface permeability, the degree of rainfall infiltra- tion and the degree of organic fermentation. However, while the effect of various groundwater flow paths on a smaller scale was not largely considered in these studies (Lee et al., 2006a), this is considered in detail in this present study, based on results of the cluster analysis (Section 3.3).
Table 2. Monthly precipitation of the study area for 2005-2006. Data are obtained from Korea Meteorological Administration (unit: mm)
Year Jan Feb Mar Apr May Jun Jul Aug Sep Oct Nov Dec
2005 2.6 22.8 53.5 79.5 67.7 219.5 363.6 370 290.5 63.7 27.8 9.8
2006 30.2 27.1 14.7 79.5 87.6 132 930.2 157.4 21.6 21.5 47.3 11.4
Fig. 2. Simple conceptual model illustrating variation of relevant groundwater parameters in and around the Wonju landfill. The fig- ure was modified from Lee et al. (2006a).
3.2. Trend Analysis
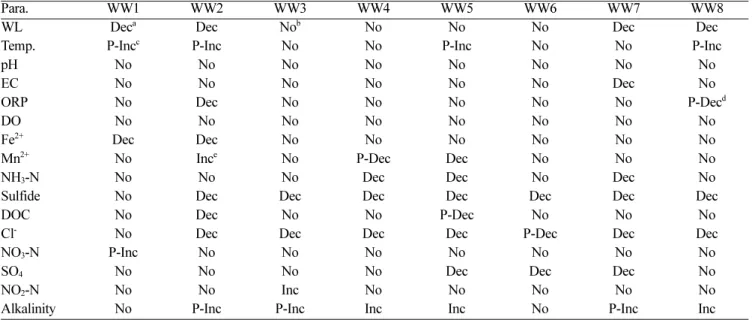
With respect to the 16 groundwater parameters for 8 wells (WW1~WW8), in which the monitoring period is greater than a single hydrological year, a non-parametric trend analysis (Sen’ test) was conducted. Table 3 shows the results of the trend analysis at a confidence level of 95%. Many of the parameters did not show any trend for most wells. A trend of partially decreasing water levels at some wells indicates decrease in precipitation on the site for the monitoring period. While a statistically significant decreasing trend was shown for sulfide. Because its absolute concentration was too low, this trend is not considered. A trend of decreasing levels of chloride at most wells is notable because it is nor- mally expected that chloride concentration will increase in conditions of lower rainfall. In normal conditions, this decrease of chloride concentration can be interpreted as a decrease in leachate outflow, which is significantly consis- tent with a lower rainfall.
It is significant that the trend of an increase in alkalinity level generally occurred at most wells. The alkalinity level may increase with further decomposition of organic matter (Hem, 1992). Figure 3 clearly shows those wells that are influenced by the excess production of CO2 (Sæther et al., 1992). However, no substantial trend was shown for DOC.
Furthermore, the organic matter does not necessarily orig- inate from the landfill leachate. Some of the organic matter found on the site may be attributed to the significant fertility of the sandy open field due to consecutive cultivation of
many vegetables, the contribution of which is not readily quantified at this time. Considering that a long period (at least 20~25 yrs) is required for the landfill to be stabilized, the results obtained from the trend analysis for this short period are not conclusive.
Table 3. Results of non-parametric trend analysis (Sen’s test) of groundwater quality at confidence level of 95%
Para. WW1 WW2 WW3 WW4 WW5 WW6 WW7 WW8
WL Deca Dec Nob No No No Dec Dec
Temp. P-Incc P-Inc No No P-Inc No No P-Inc
pH No No No No No No No No
EC No No No No No No Dec No
ORP No Dec No No No No No P-Decd
DO No No No No No No No No
Fe2+ Dec Dec No No No No No No
Mn2+ No Ince No P-Dec Dec No No No
NH3-N No No No Dec Dec No Dec No
Sulfide No Dec Dec Dec Dec Dec Dec Dec
DOC No Dec No No P-Dec No No No
Cl- No Dec Dec Dec Dec P-Dec Dec Dec
NO3-N P-Inc No No No No No No No
SO4 No No No No Dec Dec Dec No
NO2-N No No Inc No No No No No
Alkalinity No P-Inc P-Inc Inc Inc No P-Inc Inc
aDecreasing
bNo trend
cProbably increasing
dProbably decreasing
eIncreasing
Fig. 3. Relationship between Ca2+ and HCO3- in groundwaters of this site.
3.3. Cluster Analysis
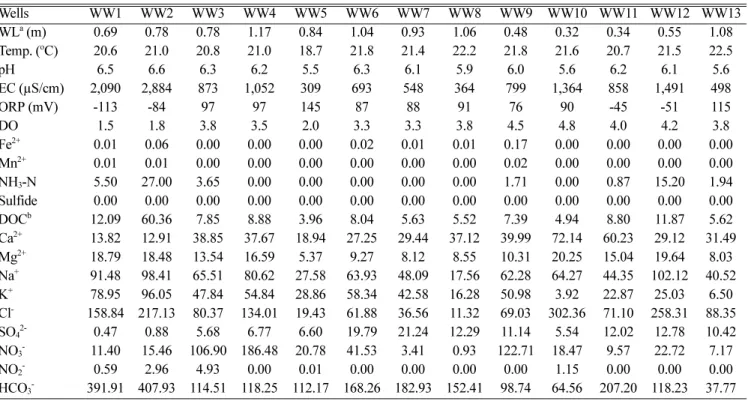
Table 4 shows the chemistry of the groundwater deter- mined in October 2005, used for the multivariate cluster analysis. In addition to the regularly monitored parameters, major ions were added for the analysis. Basically, the gen- eral distribution of the parameters does not substantially dif- fer from the explanation previously provided in section 3.1.
At this sampling time (end of the wet season), the EC levels at the upper wells were largely elevated, while the ORP lev- els were depressed. The depletion in Fe2+ and Mn2+ levels may be due to the effect of precipitation triggered by a large amount of rainfall during the preceding wet months. NH3- N was only detected at the uppermost and the most down- gradient wells while nitrate levels were significant in every well. The elevated nitrate concentration in the uppermost and downgradient wells indicates the rapid percolation of rainfall water into the landfill while the suppressed levels of NO2- (reduced form of nitrogen) support this interpretation.
Prior to carrying out the cluster analysis, the Pearson cor- relation among the groundwater parameters was calculated (Table 5). Two parameters (pH and EC) showed substantial correlation with many other parameters. The pH level was closely positively correlated with DOC, K and HCO3-. As described previously, this result was somewhat unexpected.
Because the elevation of the latter three parameters might indicate the leachate effect (Fatta et al., 1999; Thornton et al., 2000), lower pH levels would be expected. For the
present time, this abnormal correlation cannot be explained.
Levels of EC are normally well correlated with DOC, Mg2+, Na+ and Cl-. A negative correlation (r=-0.80 at p=0.00) between EC and ORP levels was expected (Christensen et al., 2000) because a high EC level of the leachate would be accompanied with a low ORP level. In addition, Mg showed a very high positive correlation with Cl-, while K+ showed a high positive correlation with HCO3-. A negative corre- lation of ORP with DOC, Mg2+, Na+ and HCO3- resulted from the leachate effect because fermentation of microor- ganisms using organic matter would produce a greater reducing condition.
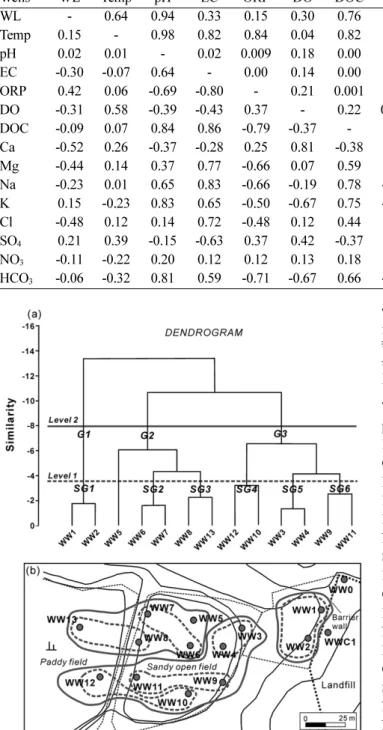
Figure 4 shows a dendrogram created from the cluster analysis and geographical distribution of each well cluster that had a similar chemistry (with respect to groundwater parameters included in this analysis). According to the den- drogram, 6 sub-groups and 1 unclassified well (WW5) showed high similarity levels (Level 1 in Fig. 4). As expected, the two proximal wells mostly formed one subgroup (SG1~SG5).
However, 3 large groups (G1~G3) showed low similarity levels (Level 2 in Fig. 4), including all the wells. With the exception of the uppermost wells, the geographical distri- bution (or shape) of the two groups somewhat contradicts our expectation because it was initially expected that the groups would be formed in a direction perpendicular to that of the general groundwater flow. Consequently, the two lat- ter groups (G2 and G3) showed a somewhat parallel dis- tribution. It is significant that the upper subgroup, SG5 Table 4. Water chemistry in October 2005, used for multivariate analysis. Units are in mg/L unless otherwise noted
Wells WW1 WW2 WW3 WW4 WW5 WW6 WW7 WW8 WW9 WW10 WW11 WW12 WW13
WLa(m) 0.69 0.78 0.78 1.17 0.84 1.04 0.93 1.06 0.48 0.32 0.34 0.55 1.08
Temp. (oC) 20.6 21.0 20.8 21.0 18.7 21.8 21.4 22.2 21.8 21.6 20.7 21.5 22.5
pH 6.5 6.6 6.3 6.2 5.5 6.3 6.1 5.9 6.0 5.6 6.2 6.1 5.6
EC (µS/cm) 2,090 2,884 873 1,052 309 693 548 364 799 1,364 858 1,491 498
ORP (mV) -113 -84 97 97 145 87 88 91 76 90 -45 -51 115
DO 1.5 1.8 3.8 3.5 2.0 3.3 3.3 3.8 4.5 4.8 4.0 4.2 3.8
Fe2+ 0.01 0.06 0.00 0.00 0.00 0.02 0.01 0.01 0.17 0.00 0.00 0.00 0.00
Mn2+ 0.01 0.01 0.00 0.00 0.00 0.00 0.00 0.00 0.02 0.00 0.00 0.00 0.00
NH3-N 5.50 27.00 3.65 0.00 0.00 0.00 0.00 0.00 1.71 0.00 0.87 15.20 1.94
Sulfide 0.00 0.00 0.00 0.00 0.00 0.00 0.00 0.00 0.00 0.00 0.00 0.00 0.00
DOCb 12.09 60.36 7.85 8.88 3.96 8.04 5.63 5.52 7.39 4.94 8.80 11.87 5.62
Ca2+ 13.82 12.91 38.85 37.67 18.94 27.25 29.44 37.12 39.99 72.14 60.23 29.12 31.49 Mg2+ 18.79 18.48 13.54 16.59 5.37 9.27 8.12 8.55 10.31 20.25 15.04 19.64 8.03 Na+ 91.48 98.41 65.51 80.62 27.58 63.93 48.09 17.56 62.28 64.27 44.35 102.12 40.52 K+ 78.95 96.05 47.84 54.84 28.86 58.34 42.58 16.28 50.98 3.92 22.87 25.03 6.50 Cl- 158.84 217.13 80.37 134.01 19.43 61.88 36.56 11.32 69.03 302.36 71.10 258.31 88.35 SO42- 0.47 0.88 5.68 6.77 6.60 19.79 21.24 12.29 11.14 5.54 12.02 12.78 10.42 NO3- 11.40 15.46 106.90 186.48 20.78 41.53 3.41 0.93 122.71 18.47 9.57 22.72 7.17
NO2- 0.59 2.96 4.93 0.00 0.01 0.00 0.00 0.00 0.00 1.15 0.00 0.00 0.00
HCO3- 391.91 407.93 114.51 118.25 112.17 168.26 182.93 152.41 98.74 64.56 207.20 118.23 37.77
aWater level (depth to water below ground surface)
bDissolved organic carbon
(WW3 and WW4), was finally incorporated into the main group G3, which provides a number of important clues to enhance our understanding of the local groundwater flow around the landfill, which will be discussed in the next section.
The mean chemistries of the three classified groups are presented in Table 6. While a consistent interpretation could
not be maintained for all the parameters, it was generally inferred that the effect of the landfill leachate was increas- ing in the order of G2<G3<G1, which was mainly evi- denced by levels of EC, ORP, Fe2+, NH3-N, DOC, Cl-, SO42- and NO2-. Elevated levels of nitrate at Group 1 wells (WW1 and WW2) were rather distinctive. Heavy rains occurring Table 5. Pearson correlation among groundwater parameters, which was calculated after data normalization with z and appropriate trans- formations. Correlation values are given in the lower triangle and probabilities that the parameters are uncorrelated are given in the upper.
High values at 95% confidence level are bolded
Wells WL Temp pH EC ORP DO DOC Ca Mg Na K Cl SO4 NO3 HCO3
WL - 0.64 0.94 0.33 0.15 0.30 0.76 0.07 0.13 0.45 0.62 0.10 0.49 0.73 0.85
Temp 0.15 - 0.98 0.82 0.84 0.04 0.82 0.39 0.65 0.96 0.44 0.69 0.18 0.47 0.28
pH 0.02 0.01 - 0.02 0.009 0.18 0.00 0.21 0.22 0.02 0.00 0.66 0.61 0.51 0.00
EC -0.30 -0.07 0.64 - 0.00 0.14 0.00 0.35 0.002 0.001 0.02 0.005 0.02 0.69 0.03 ORP 0.42 0.06 -0.69 -0.80 - 0.21 0.001 0.41 0.02 0.01 0.08 0.10 0.22 0.70 0.006 DO -0.31 0.58 -0.39 -0.43 0.37 - 0.22 0.001 0.82 0.53 0.01 0.70 0.15 0.67 0.01 DOC -0.09 0.07 0.84 0.86 -0.79 -0.37 - 0.20 0.04 0.002 0.003 0.13 0.21 0.56 0.01 Ca -0.52 0.26 -0.37 -0.28 0.25 0.81 -0.38 - 0.49 0.40 0.02 0.51 0.66 0.85 0.11 Mg -0.44 0.14 0.37 0.77 -0.66 0.07 0.59 0.21 - 0.002 0.58 0.00 0.06 0.50 0.61 Na -0.23 0.01 0.65 0.83 -0.66 -0.19 0.78 -0.26 0.77 - 0.03 0.004 0.20 0.10 0.19 K 0.15 -0.23 0.83 0.65 -0.50 -0.67 0.75 -0.64 0.17 0.61 - 0.83 0.27 0.27 0.002
Cl -0.48 0.12 0.14 0.72 -0.48 0.12 0.44 0.20 0.90 0.74 0.07 - 0.12 0.51 0.98
SO4 0.21 0.39 -0.15 -0.63 0.37 0.42 -0.37 0.14 -0.55 -0.38 -0.33 -0.45 - 0.44 0.52 NO3 -0.11 -0.22 0.20 0.12 0.12 0.13 0.18 0.06 0.21 0.48 0.33 0.20 -0.23 - 0.19 HCO3 -0.06 -0.32 0.81 0.59 -0.71 -0.67 0.66 -0.47 0.15 0.39 0.77 0.01 -0.20 0.39 -
Fig. 4. (a) Dendrogram formed by cluster analysis using Ward method and (b) Geographical distribution of each well cluster at two similarity levels.
Table 6. Mean concentrations or levels of groundwater parameters for the three groups. Units are in mg/L unless otherwise noted Wells Group 1 (G1) Group 2 (G2) Group 3 (G3) Member wells WW1~2 WW5~8, WW13WW3~4,WW9~12
WLa (m) 0.74 0.99 0.61
Temp. (oC) 20.8 21.3 21.2
pH 6.6 5.9 6.1
EC (µS/cm) 2,487 482 1,073
ORP (mV) -99 105 44
DO 1.7 3.2 4.1
Fe2+ 0.04 0.01 0.03
Mn2+ 0.01 0.00 0.00
NH3-N 16.25 0.39 3.57
Sulfide 0.00 0.00 0.00
DOCb 36.23 5.75 8.29
Ca2+ 13.37 28.84 46.33
Mg2+ 18.64 7.87 15.90
Na+ 94.95 39.54 69.86
K+ 87.50 30.51 34.25
Cl- 187.99 43.51 152.53
SO42- 0.68 14.07 8.99
NO3- 13.43 14.76 77.81
NO2- 1.78 0.00 1.01
HCO3- 399.92 130.71 120.25
aWater level (depth to water below ground surface)
bDissolved organic carbon
during the preceding days (42 mm for October 1 and 13.5 mm for October 7) may partly explain these elevated nitrate concentrations.
3.4. Implications for Plume Migration Paths
Figure 5 shows the groundwater flow constructed using measured groundwater level data for the monitoring period and hydrogeological properties collected in this study (Kim et al., 2007). Groundwater flow was relatively rapid in the upper half of the monitoring area because of the consider- able hydraulic conductivity in the sandy open field and the hydraulic gradient of this area is steep (Lee et al., 2006a).
Groundwater velocity was reduced in the lower half due to a decrease in the permeability of the subsurface (see arrow length in Fig. 5). In terms of a relatively wider scale, includ- ing the landfill, the sandy open field and the downgradient residential area, it is expected that groundwater would flow from the landfill to the residential area (simply single direc-
tion) and that it would initially converge to the depression (the landfill valley) from the surrounding mountains.
However, on a smaller scale, if groundwater flow is only restricted in the downgradient area immediately proximal to the landfill, the groundwater flow direction and its velocity varies significantly. While the groundwater flow from the landfill in the first upper half area is rapid and divergent, it is slower and convergent in the paddy fields. Simply assum- ing a longitudinal advection along the flow path, a single plume originating from the landfill would split into two plumes, each taking a different migration pathway, one in the WW3-WW11-WW12 direction and the other in the WW5-WW8-WW13 direction. By incorporating the sub- group, SG5, into the main group G3, it was found that the first flow path was more dominant than the second pathway and was relatively faster. Similar groundwater chemistry was therefore formed in a parallel way, which explains the relatively more significant leachate effect for the lower wells (G3 wells) than for the upper wells (G2 wells), evi-
Fig. 5. Groundwater flow fields at dif- ferent months of 2005. Length of the arrow indicates relative flow velocity.
denced by a higher EC level, lower ORP level, and higher Fe2+ and NH3-N levels. High concentrations of Cl- at WW10~12 (similar to the levels at the uppermost wells) can also be explained by this pathway (see Section 3.1).
The preferential selection of the groundwater flow path (G3 direction) appeared to be closely related to the hydro- geological setting of the subsurface. According to an elec- trical resistivity survey for this area (Lee et al., 2006b), high resistivity regions are present under the upper margin (G2 area, Fig. 6), which is considered to consist of less perme- able bedrock (granitic gneiss). Actually, there are many out- crops of tight granitic gneiss in the upper area immediately proximal to the G2. However, there is the presence of the sandy open field in the lower part (G3 area). Thus, the less permeable tight gneiss would actually function as a hydrau- lic barrier to the shallow groundwater flow. Furthermore, the subsurface of the lower sandy open area (G3 area) showed relatively low electrical resistivities, indicating occurrence of groundwater and effect of the landfill leachate in the per-
meable materials (Lee et al., 2006b). Thus, leachate-affected groundwater would preferentially flow toward this low resistance direction. However, these downgradient wells (G2 and G3 wells) would be affected by additional ground- water flow from both sides of the mountains, which was not readily quantified.
4. SUMMARY AND CONCLUSION
In this study, an evaluation was carried out on the quality of groundwater affected by an uncontrolled landfill in Wonju, Korea. Using the groundwater monitoring data obtained for about 2 years, a non-parametric trend analysis and a cluster analysis were conducted. For the interpretation of the analysis results, many other investigation results were also referred to, including surveys of hydrogeological log- ging, water levels and electrical resistivity. From this study, a number of primary conclusions were drawn.
1. The groundwater chemistry below the landfill was Fig. 6. Distribution of electrical resis- tivity around the landfill. The figure was modified from Lee et al., (2006b).
largely controlled by the landfill leachate, agricultural activ- ities, land surface permeability and local groundwater flow.
The first three components have been previously discussed in other literature (Lee et al., 2006a, 2007a).
2. Results of the non-parametric trend analysis indicated that there was a general increasing trend in alkalinity levels at most wells, indicating further degradation of organic mat- ter. However, this result is inconclusive due to the relatively short monitoring period.
3. According to the cluster analysis, similar chemical groups were formed in a parallel direction to the general direction of groundwater flow, which was mainly derived from the local groundwater flow originating from the sur- rounding mountains.
4. In order to more precisely evaluate the plume migra- tion pathways along the groundwater flow, multi-level groundwater monitoring is required. In this topographic set- ting, the vertical component of the groundwater flow cannot be neglected.
ACKNOWLEDGMENTS: This study was financially supported by the MOE (Ministry of Environment of Korea) and KIEST (The Eco- technopia 21 project). The authors greatly appreciate Jeong-Yong Cheon and Hyung-Pyo Kwon at GeoGreen21 Co., Ltd., Dr. Jong-Ho Kim at H-Plus Eco Co., Ltd., and Hee-Sung Yoon and Seong-Sun Lee at Seoul National University for their field and laboratory assistances.
We also appreciate Mr. Jin-Youl Yoo at Sangji University for his labo- rious laboratory analysis. Deep gratitude is extended to Dr. Kyung- Seok Ko at KIGAM and an anonymous reviewer for their critical reviews.
REFERENCES
Basberg, L., Banks, D. and Sæther, O.M., 1998, Redox processes in groundwater impacted by landfill leachate. Aquatic Geochemis- try, 4, 253−272.
Christensen, T.H., Kjeldsen, P., Albrechtsen, H.-J., Heron, G., Nielsen, P.H., Bjerg, P.L., and Holm, P.E., 1994, Attenuation of landfill leachate pollutants in aquifers. Critical Reviews in Envi- ronmental Science and Technology, 24, 119−202.
Christensen, T.H., Bjerg, P.L., Banwart, S.A., Jakobsen, R., Heron, G., and Albrechtsen, H.-J., 2000, Characterization of redox con- ditions in groundwater contaminant plumes. Journal of Contam- inant Hydrology, 45, 162−241.
Fatta, D., Papadopoulos, A., and Loizidou, M., 1999, A study on the landfill leachate and its impact on the groundwater quality of the greater area. Environmental Geochemistry and Health, 21, 175−190.
Hem, J.D., 1992, Study and Interpretation of the Chemical Charac- teristics of Natural Water. USGS Water-Supply Paper 2254, USGS, Washington, D.C., 263 p.
Kim, C.G., Han, J.S., Park, H.A., Kang, J.O., Lee, S.J., Sung, E.H., Park, H.J., So, M.H., Park, J.K., and Lee, J.Y., 2007, Develop- ment of Technology to Long-term Monitor Uncontrolled Landfill by Molecular and Biochemical Characterization. Final Research Report, Inha University, 379 p.
Lee, J.Y., Cheon, J.Y., Kwon, H.P., Yoon, H.S., Lee, S.S., Kim, J.H.,
Park, J.K., and Kim, C.G., 2006a, Attenuation of landfill leachate at two uncontrolled landfills. Environmental Geology, 51, 581− 593.
Lee, J.Y., Lee, C.H., and Lee, K.K., 2002, Evaluation of air injection and extraction tests in a landfill site in Korea: implications for landfill management. Environmental Geology, 42, 945−954.
Lee, S.S., Lee, J.Y., Yoon, H.S., Lee, K.K., Kim, C.G., and Yu, Y.C., 2006b, Environmental geophysical survey of abandoned landfills for contamination evaluation : a case study. Journal of KSEE, 28, 463−471. (in Korean with English abstract)
Lee, J.Y. and Lee, K.K., 2003, Viability of natural attenuation in a petroleum-contaminated shallow sandy aquifer. Environmental Pollution, 126, 201−212.
Lee, J.Y., Cheon, J.Y., Kwon, H.P., Yoon, H.S., Lee, S.S., Kim, J.H., Park, J.G., and Kim, C., 2008. Comparison of hydrogeologic and hydrochemical conditions between two uncontrolled landfills.
Water International (in press).
Lee, J.Y., Cheon, J.Y., Lee, K.K., Lee, S.Y., and Lee, M.H., 2001, Statistical evaluation of geochemical parameter distribution in a ground water system contaminated with petroleum hydrocar- bons. Journal of Environmental Quality, 20, 1548−1563.
Lee, J.Y., Yi, M.J., Lee, J.M., Ahn, K.H., Won, J.H., Moon, S.H., and Cho, M., 2006c, Parametric and non-parametric trend analysis of groundwater data obtained from national groundwater monitor- ing stations. Journal of KoSSGE, 11, 56−67.
Lee, J.Y., Yi, M.J., Yoo, Y.K., Ahn, K.H., Kim, G.B., and Won, J.H., 2007, A review of the National Groundwater Monitoring Net- work in Korea. Hydrological Processes, 21, 907−919.
Park, H.A., Han, J.S., Kim, C.G., and Lee, J.Y., 2006, Application of molecular biological techniques for development of stability indi- cator in uncontrolled landfill. Journal of KSEE, 28, 128−136. (in Korean with English abstract)
Park, J.K., Kim, J.H., Lee, J.Y., Kim, T.D., and Choi, D.H., 2007, Case study of hydrogeological characteristics for evaluating potential leachate plume formation and migration from an uncon- trolled closed valley landfill. Journal of Korean Wastes Engineer- ing Society, 24(4), 358−364. (in Korean with English abstract) Ryan, P.D., Harper, D.A.T., and Whalley, J.S., 1995, PALSTAT, Sta-
tistics for Palaeontologist. Chapman & Hall, London, 69 p.
Sæther, O.M., Misund, A., Ødegård, M., Andreasen, B.TH., and Voss, A., 1992, Groundwater contamination at Trandum landfill, Southeastern Norway. Norges Geologiske Undersøkelse Bulletin, 422, 83−95.
Sen, P.K., 1968, Estimates of the regression coefficient based on Kendall’ tau. Journal of American Statistics Association, 63, 1379−1389.
Thornton, S.F., Tellam, J.H., and Lerner, D.N., 2000, Attenuation of landfill leachate by UK Triassic sandstone aquifer materials 1.
Fate of inorganic pollutants in laboratory columns. Journal of Contaminant Hydrology, 43, 327−354.
Ward, J.H., 1963, Hierarchical grouping to optimize an objective function. Journal of American Statistics Association, 58, 235−244.
Wiedemeier, T.H., Rifai, H.S., Newell, C.J., and Wilson, J.T., 1999, Natural Attenuation of Fuels and Chlorinated Solvents in the Subsurface. John Wiley & Sons, Inc., New York, 504 p.
Manuscript received October 1, 2007 Manuscript accepted August 26, 2008