https://doi.org/10.14316/pmp.2016.27.4.180 pISSN 2508-4445, eISSN 2508-4453
This work was supported by the National Research Foundation of Korea (NRF) grant funded by the Korea government (MSIP) (No.
2015R1C1A1A02036331).
Received 22 November 2016, Revised 6 December 2016, Accepted 7 December 2016
Correspondence: Jung-in Kim ([email protected]) Tel: 82-2-2072-3573, Fax: 82-2-765-3317 cc This is an Open-Access article distributed under the terms of the Creative Commons Attribution Non-Commercial License (http://creativecommons.org/licenses/by-nc/4.0) which permits unrestricted non-commercial use, distribution, and reproduction in any medium, provided the original work is properly cited.
Dosimetric Validation of the Acuros XB
Advanced Dose Calculation Algorithm for Volumetric Modulated Arc Therapy Plans
So-Yeon Park*
†‡, Jong Min Park*
†‡§, Chang Heon Choi*
†‡, Minsoo Chun*
†‡∥, Jung-in Kim*
†‡*Department of Radiation Oncology, Seoul National University Hospital,
†Institute of Radiation Medicine, Seoul National University Medical Research Center, ‡Biomedical Research Institute, Seoul National University College of Medicine, Seoul, §Center for Convergence Research on Robotics, Advance Institutes of Convergence Technology, Suwon, ∥Interdisciplinary Program in Radiation
Applied Life Science, Seoul National University College of Medicine, Seoul, Korea
Acuros XB advanced dose calculation algorithm (AXB, Varian Medical Systems, Palo Alto, CA) has been released recently and provided the advantages of speed and accuracy for dose calculation. For clinical use, it is important to investigate the dosimetric performance of AXB compared to the calculation algorithm of the previous version, Anisotropic Analytical Algorithm (AAA, Varian Medical Systems, Palo Alto, CA). Ten volumetric modulated arc therapy (VMAT) plans for each of the following cases were included: head and neck (H&N), prostate, spine, and lung. The spine and lung cases were treated with stereotactic body radiation therapy (SBRT) technique. For all cases, the dose distributions were calculated using AAA and two dose reporting modes in AXB (dose-to-water, AXB
w, and dose-to-medium, AXB
m) with same plan parameters. For dosimetric evaluation, the dose-volumetric parameters were calculated for each planning target volume (PTV) and interested normal organs. The differences between AAA and AXB were statistically calculated with paired t-test. As a general trend, AXB
wand AXB
mshowed dose underestimation as compared with AAA, which did not exceed within −3.5% and −4.5%, respectively.
The maximum dose of PTV calculated by AXB
wand AXB
mwas tended to be overestimated with the relative dose difference ranged from 1.6% to 4.6% for all cases. The absolute mean values of the relative dose differences were 1.1±1.2% and 2.0±1.2% when comparing between AAA and AXB
w, and AAA and AXB
m, respectively. For almost dose-volumetric parameters of PTV, the relative dose differences are statistically significant while there are no statistical significance for normal tissues. Both AXB
wand AXB
mwas tended to underestimate dose for PTV and normal tissues compared to AAA. For analyzing two dose reporting modes in AXB, the dose distribution calculated by AXB
wwas similar to those of AAA when comparing the dose distributions between AAA and AXB
m.
Key Words: Acuros XB advanced dose calculation algorithm, Anisotropic Analytical Algorithm, Volumetric modulated arc therapy, Dose-volumetric parameter
Introduction
Volumetric modulated arc therapy (VMAT) modulating the
multi-leaf collimator (MLC) positions, gantry rotation speed, and dose rates has been broadly adopted in the clinic, having benefits of delivering prescription dose to target volume while sparing normal tissue.
1-3)It has shown that VMAT can achieve a similar plan quality and monitor unit (MU) effectiveness as compared to intensity modulated radiation therapy (IMRT) re- sulting in shortening the treatment time in the clinic.
4-6)As the portion of complicated radiotherapy technique such as VMAT increases in the clinic, demands on the accuracy and speed of dose calculation increases.
In 2010, Acuros XB advanced dose calculation algorithm
(AXB, Varian Medical Systems, Palo Alto, CA) has been re- leased as a clinical deterministic dose algorithm in the Eclipse treatment planning system (TPS) to meet accuracy and speed requirements for dose calculation. AXB uses the grid-based Boltzmann solver (GBBS) to solve the Linear Boltzmann transport equation (LBTE) which describes the macroscopic behavior of radiation particles as they travel through and inter- act with matter.
7-9)Using the AXB, the radiation transport problem within small volumes could be solved to calculate dose distribution with accuracy and speed for dose calculation.
Several studies have demonstrated that the dose calculation from the AXB were very close to those from Monte carlo (MC) simulation compared to the widely used Anisotropic Analytical Algorithm (AAA, Varian Medical Systems, Palo Alto, CA) and Collapsed-con Convolution algorithm (CCC) in heterogeneous slab phantom.
10-12)It has been shown that there were similar findings from other groups in dose calculation in- volving high density volumes,
13)small field segments defined by MLC,
14)and RPC phantoms of head and neck (H&N)
15)and thorax.
16)For clinical cases, several studies have per- formed dosimetric comparison of VMAT and IMRT plans be- tween AXB and AAA indicating that AXB underestimated the doses to targets or normal tissues in the cases of prostate, lung, H&N, and pelvis compared to AAA.
17-20)In contrast to these results, other study has shown that AAA underestimated the dose in the cases of spine.
21)The difference between AXB and AAA depends on the treatment site and beam energy, which the results are patient-specific.
Depending on the energy dependent fluence-to-dose response function, AXB provides two dose reporting modes: dose-to-wa- ter (AXB
w) and dose-to-medium (AXB
m). For the AXB
w, en- ergy dependent fluence-to-dose response functions are based on the water whereas for the AXB
mthose are based on each material. Until now, selecting between AXB
wand AXB
mis debate in the clinic.
22)Walters et al. have determined that dose-to-medium from MC provided a better estimation of the dose to the radiosensitive red bone marrow (RBM) and bone surface cells (BSC) in spongiosa, or cancellous bone as com- pared with dose-to-water from MC.
23)It is essential to inves- tigate if the selection of either AXB
mor AXB
wwill affect the dosimetric parameters of VMAT plans in the clinical. The pur- pose of this study is to evaluate the AXB using two dose re-
porting modes (AXB
wand AXB
m) compared as AAA in the cases of prostate, H&N, spine, and lung treated with VMAT plans.
Materials and Methods
1. Patient selection
Among patients previously treated with VMAT technique in our institution, 10 patients for each prostate cancer, H&N can- cer, spine cancer, and lung cancer were selected retrospectively for this study. The spine and lung cancers were treated with stereotactic body radiation therapy (SBRT) technique.
2. Planning and dose calculation
VMAT plans of all four cases of patients were generated in
the Eclipse TPS using a TrueBeam
TMequipped with a
high-definition 120 Millennium
TMMLC (Varian Medical
Systems, Palo Alto, CA). For prostate cases, the total dose
prescribed to the planning target volume (PTV) was 70 Gy
with a daily dose of 2.5 Gy in 28 fractions. The prostate
VMAT plans were generated using a two-full-arcs with 10
MV photon beam. In the case of H&N, the total prescription
dose to PTV was 67.5 Gy (2.25 Gy/fraction) and the H&N
VMAT plans were generated by using a two-full-arcs with 6
MV photon beam. The total dose prescription dose to the PTV
regarding spine SBRT was 8 Gy in 1 fraction. The VMAT
plans for spine SBRT were made using a two-full-arcs with 10
MV flattening-filter-free (FFF) photon beam. For lung SBRT
cases, prescription dose to PTV was 60 Gy with a daily dose
of 15 Gy in 4 fractions. The VMAT plans for lung SBRT
were made using a two-partial-arcs with 6 MV FFF photon
beam. Optimizations for all VMAT plans were performed by
the progressive resolution optimizer 3 (PRO4, ver. 10, Varian
Medical Systems, Palo Alto, CA). To improve the dosimetric
quality in VMAT plans, all VMAT plans were re-optimized
using the current dose distribution as a reference for
re-optimization. The dose distributions were calculated by us-
ing AAA. The calculation grid used in this study was 2.5 mm
except for 1.0 mm for lung SBRT cases. Then, dose dis-
tributions were calculated by using AXB
wand AXB
mwith
same plan parameters following dose calculation using AAA.
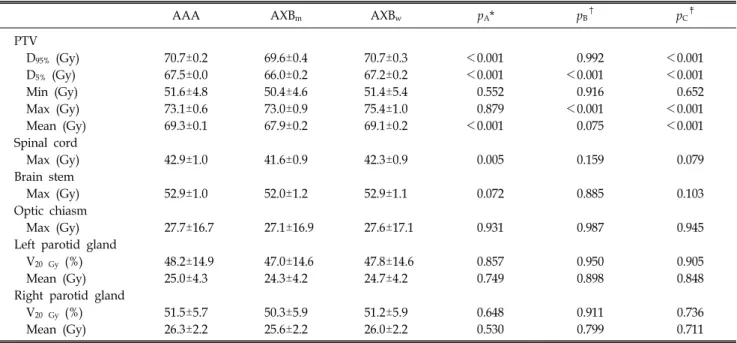
Table 1. The mean dose-volumetric parameters of PTV and normal tissues for head and neck cases.
AAA AXBm AXBw pA* pB
† pC
‡
PTV
D95% (Gy) 70.7±0.2 69.6±0.4 70.7±0.3 <0.001 0.992 <0.001
D5% (Gy) 67.5±0.0 66.0±0.2 67.2±0.2 <0.001 <0.001 <0.001
Min (Gy) 51.6±4.8 50.4±4.6 51.4±5.4 0.552 0.916 0.652
Max (Gy) 73.1±0.6 73.0±0.9 75.4±1.0 0.879 <0.001 <0.001
Mean (Gy) 69.3±0.1 67.9±0.2 69.1±0.2 <0.001 0.075 <0.001
Spinal cord
Max (Gy) 42.9±1.0 41.6±0.9 42.3±0.9 0.005 0.159 0.079
Brain stem
Max (Gy) 52.9±1.0 52.0±1.2 52.9±1.1 0.072 0.885 0.103
Optic chiasm
Max (Gy) 27.7±16.7 27.1±16.9 27.6±17.1 0.931 0.987 0.945
Left parotid gland
V20 Gy (%) 48.2±14.9 47.0±14.6 47.8±14.6 0.857 0.950 0.905
Mean (Gy) 25.0±4.3 24.3±4.2 24.7±4.2 0.749 0.898 0.848
Right parotid gland
V20 Gy (%) 51.5±5.7 50.3±5.9 51.2±5.9 0.648 0.911 0.736
Mean (Gy) 26.3±2.2 25.6±2.2 26.0±2.2 0.530 0.799 0.711
*pA: p-value for the comparison of dose-volumetric parameters between AAA and AXBm.
†pB: p-value for the comparison of dose-volumetric parameters between AAA and AXBw.
‡pC: p-value for the comparison of dose-volumetric parameters between AXBm and AXBw.
3. Analysis and evaluation of VMAT plans
For assessing the dosimetric quality with respect to PTV and normal organs, dose-volumetric histograms (DVHs) of AAA, AXB
w, and AXB
mwere calculated in the Eclipse TPS.
The dose-volumetric parameters for PTV for all 4 clinical cas- es were the mean dose, maximum dose, minimum dose, D
95%(dose received by at least 95% volume), and D
5%. For the nor- mal organs, mean dose and D
70%of rectum and bladder, max- imum dose and D
50%of left and right femur heads and kid- neys, maximum dose of brain stem and optic chiasm, mean dose and V
20 Gy(percent volume of the normal organ irradi- ated by at least 20 Gy) of left and right parotid glands, max- imum dose and V
13.5 Gyof spinal cord, maximum dose and V
27.5 Gyof heart, and maximum dose and V
20 Gyof left and right lungs were calculated. For a comparative purpose, the relative dose differences in the corresponding dose-volumetric parameters the AAA and AXB of the same case were calcu- lated as follows
21)Relative dose difference (%)=
×
(1)
where, AXB
xis selected between AXB
wand AXB
mdepend- ing on what dose reporting mode should be compared. To in- vestigate the statistical significance of the differences between AAA and AXB, p values were calculated using the paired t-test, indicating that p values less than 0.05 means statistically significance.
Results
The dose-volumetric parameters of AAA, AXB
w, and AXB
mwith respect to H&N, prostate, spine, and lung cases are
shown in Tables 1, 2, 3, and 4, respectively. The p-values pro-
viding the comparisons of mean values of dose-volumetric pa-
rameters between 2 calculation algorithms among AAA, AXB
w,
and AXB
mare listed in all tables. For almost dose-volumetric
parameters of PTV for 4 cases, the differences of dose-volu-
metric parameters are statistically significant while there are no
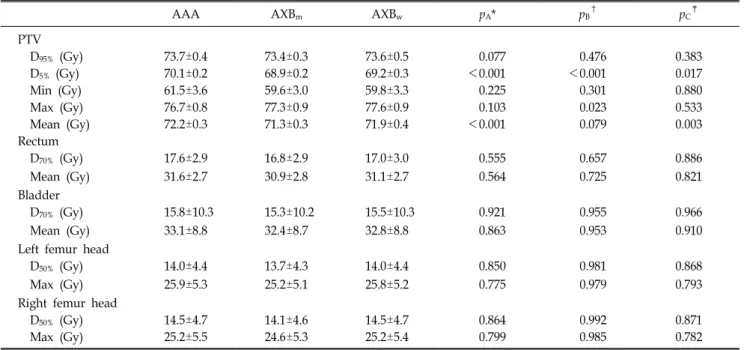
Table 2. The mean dose-volumetric parameters of PTV and normal tissues for prostate cases.
AAA AXBm AXBw pA* pB†
pC‡
PTV
D95% (Gy) 73.7±0.4 73.4±0.3 73.6±0.5 0.077 0.476 0.383
D5% (Gy) 70.1±0.2 68.9±0.2 69.2±0.3 <0.001 <0.001 0.017
Min (Gy) 61.5±3.6 59.6±3.0 59.8±3.3 0.225 0.301 0.880
Max (Gy) 76.7±0.8 77.3±0.9 77.6±0.9 0.103 0.023 0.533
Mean (Gy) 72.2±0.3 71.3±0.3 71.9±0.4 <0.001 0.079 0.003
Rectum
D70% (Gy) 17.6±2.9 16.8±2.9 17.0±3.0 0.555 0.657 0.886
Mean (Gy) 31.6±2.7 30.9±2.8 31.1±2.7 0.564 0.725 0.821
Bladder
D70% (Gy) 15.8±10.3 15.3±10.2 15.5±10.3 0.921 0.955 0.966
Mean (Gy) 33.1±8.8 32.4±8.7 32.8±8.8 0.863 0.953 0.910
Left femur head
D50% (Gy) 14.0±4.4 13.7±4.3 14.0±4.4 0.850 0.981 0.868
Max (Gy) 25.9±5.3 25.2±5.1 25.8±5.2 0.775 0.979 0.793
Right femur head
D50% (Gy) 14.5±4.7 14.1±4.6 14.5±4.7 0.864 0.992 0.871
Max (Gy) 25.2±5.5 24.6±5.3 25.2±5.4 0.799 0.985 0.782
*pA: p-value for the comparison of dose-volumetric parameters between AAA and AXBm.
†pB: p-value for the comparison of dose-volumetric parameters between AAA and AXBw.
‡pC: p-value for the comparison of dose-volumetric parameters between AXBm and AXBw.
Table 3. The mean dose-volumetric parameters of PTV and normal tissues for spine cases.
AAA AXBm AXBw pA* pB
† pC
‡
PTV
D95% (Gy) 8.3±0.1 8.2±0.1 8.4±0.1 0.001 0.055 <0.001
D5% (Gy) 8.0±0.0 7.8±0.0 8.0±0.0 <0.001 0.015 <0.001
Min (Gy) 6.8±1.1 6.6±1.0 6.7±1.0 0.619 0.771 0.831
Max (Gy) 8.7±0.1 8.6±0.1 9.2±0.1 0.657 <0.001 <0.001
Mean (Gy) 8.2±0.0 8.0±0.0 8.2±0.0 <0.001 0.673 <0.001
Left kidney
D50% (Gy) 0.8±0.9 0.8±0.9 0.8±0.9 0.958 0.980 0.979
Max (Gy) 3.7±3.2 3.6±3.1 3.6±3.1 0.936 0.953 0.983
Right kidney
D50% (Gy) 0.7±0.8 0.7±0.8 0.7±0.8 0.950 0.971 0.979
Max (Gy) 3.6±3.3 3.5±3.3 3.6±3.3 0.947 0.965 0.982
*pA: p-value for the comparison of dose-volumetric parameters between AAA and AXBm.
†pB: p-value for the comparison of dose-volumetric parameters between AAA and AXBw.
‡pC: p-value for the comparison of dose-volumetric parameters between AXBm and AXBw.
statistical significances for all dose-volumetric parameters of normal tissues for 4 cases. Almost dose-volumetric parameters calculated using AXB
mand AXB
wtended to be underestimated compared to those calculated using AAA.
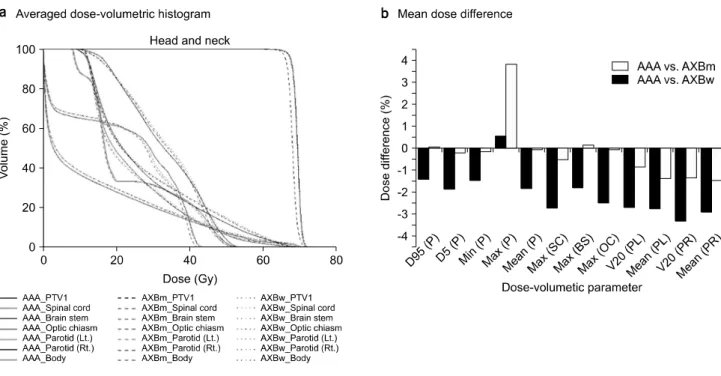
Figs. 1, 2, 3, and 4 show that the averaged DVHs and the
relative dose difference between AXB and AAA for PTV and
normal tissues for H&N, prostate, spine, and lung, respec-
tively. For H&N cases, AAA overestimated the dose compared
with AXB
wand AXB
m, with maximum value of the relative
dose difference of −3.4% while maximum doses of PTV from
Fig. 1. The averaged dose-volume histograms (DVHs) (a) and the mean values of the relative dose differences (b) for PTV and normal tissue in the case of head and neck. Solid lines, dotted lines, and dashed lines are for DVHs calculated by AAA, AXBw and AXBm, respectively. The Dn% (structure) means dose received n% volume of certain structure. Vn Gy (structure) means the percent volume of certain structure irradiated by at least n Gy. The minimum dose, maximum dose, and mean dose were abbreviated to min, max, and mean, respectively. The PTV, spinal cord, brain stem, optical chiasm, left parotid grand and right parotid grand were abbreviated to P, SC, BS, OC, PL and PR, respectively.
Table 4. The mean dose-volumetric parameters of PTV and normal tissues for lung cases.
AAA AXBm AXBw pA* pB†
pC‡
PTV
D95% (Gy) 63.1±0.7 63.5±1.0 63.4±1.0 0.319 0.424 0.851
D5% (Gy) 60.5±0.7 59.9±1.0 60.1±1.0 0.136 0.303 0.671
Min (Gy) 56.8±0.7 55.9±1.1 56.3±1.0 0.032 0.189 0.373
Max (Gy) 64.5±0.9 65.7±1.1 65.3±1.4 0.017 0.166 0.480
Mean (Gy) 62.0±0.7 61.9±1.0 62.0±0.9 0.792 0.862 0.930
Spinal cord
V13.5 Gy (%) 1.9±2.6 1.4±2.2 1.6±2.4 0.645 0.748 0.892
Max (Gy) 13.5±5.1 13.0±4.8 13.2±4.8 0.812 0.883 0.926
Heart
V27.5 Gy (%) 0.0±0.0 0.0±0.0 0.0±0.0 0.702 0.900 0.785
Max (Gy) 13.0±9.9 12.9±9.8 12.9±9.8 0.984 0.982 0.999
Left lung
V20 Gy (%) 3.0±4.9 3.0±4.9 3.0±4.9 0.998 0.996 0.999
Mean (Gy) 2.5±2.5 2.5±2.5 2.5±2.5 0.989 0.992 0.997
Right lung
V20 Gy (%) 4.6±4.8 4.6±4.9 4.6±4.9 0.983 0.980 0.997
Mean (Gy) 3.1±2.4 3.1±2.4 3.1±2.4 0.996 0.999 0.996
*pA: p-value for the comparison of dose-volumetric parameters between AAA and AXBm.
†pB: p-value for the comparison of dose-volumetric parameters between AAA and AXBw.
‡pC: p-value for the comparison of dose-volumetric parameters between AXBm and AXBw.
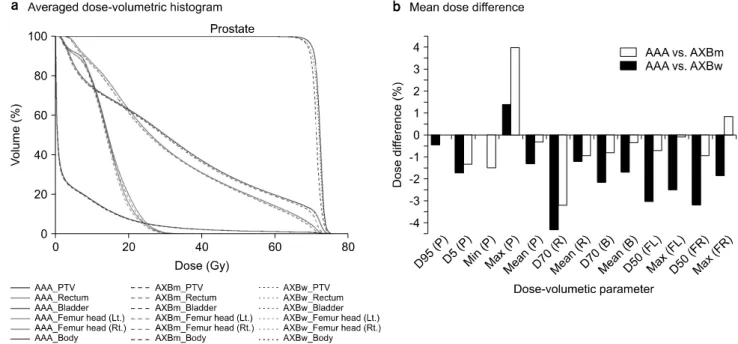
Fig. 2. The averaged dose-volume histograms (DVHs) (a) and the mean values of the relative dose differences (b) for PTV and normal tissue in the case of prostate. Solid lines, dotted lines, and dashed lines are for DVHs calculated by AAA, AXBw and AXBm, respectively. The Dn% (structure) means dose received n% volume of certain structure. Vn Gy (structure) means the percent volume of certain structure irradiated by at least n Gy. The minimum dose, maximum dose, and mean dose were abbreviated to min, max, and mean, respectively. The PTV, rectum, bladder, left femur head and right femur head were abbreviated to P, R, B, FL and FR, respectively.
Fig. 3. The averaged dose-volume histograms (DVHs) (a) and the mean values of the relative dose differences (b) for PTV and normal tissue in the case of Spine. Solid lines, dotted lines, and dashed lines are for DVHs calculated by AAA, AXBw and AXBm, respectively. The Dn% (structure) means dose received n% volume of certain structure. Vn Gy (structure) means the percent volume of certain structure irradiated by at least n Gy. The minimum dose, maximum dose, and mean dose were abbreviated to min, max, and mean, respectively. The PTV, left kidney and right kidney were abbreviated to P, KL and KR, respectively.
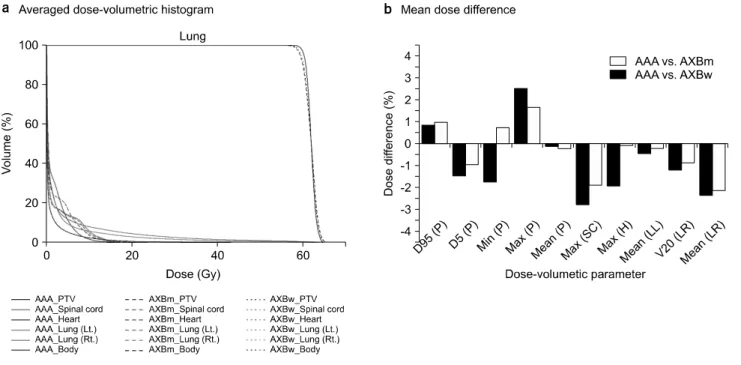
Fig. 4. The averaged dose-volume histograms (DVHs) (a) and the mean values of the relative dose differences (b) for PTV and normal tissue in the case of lung. Solid lines, dotted lines, and dashed lines are for DVHs calculated by AAA, AXBw and AXBm, respectively. The Dn% (structure) means dose received n% volume of certain structure. Vn Gy (structure) means the percent volume of certain structure irradiated by at least n Gy. The minimum dose, maximum dose, and mean dose were abbreviated to min, max, and mean, respectively. The PTV, spinal cord, heart, left lung, and right lung were abbreviated to P, SC, H, LL, and LR, respectively.
AXB
wand AXB
m, and maximum dose of brain stem from AXB
wwere overestimated with maximum value of the relative dose difference of 3.8%. For prostate cases which shows a similar tendency with H&N cases, the maximum value of the relative dose difference was −4.3% for D
70%of rectum com- paring AAA with AXB
mwhile those was 4.0% for maximum dose of PTV comparing AAA with AXB
w. In the case of spine, overestimation for AAA did not exceed within −4.5%
compared with AXB
mwhile maximum underestimation for AAA was 4.2% compared with AXB
w. For lung cases, the maximum value of the relative dose difference was −2.8% for maximum dose of spinal cord comparing AAA with AXB
mwhile those was 2.5% for maximum dose of PTV comparing AAA with AXB
m. As a general trend, the relative dose differ- ences comparing AAA and AXB
wwere tended to be smaller than those comparing AAA and AXB
mfor all 4 cases demon- strating that the absolute mean values of the relative dose dif- ferences were 1.1±1.2% and 2.0±1.2% when comparing be- tween AAA and AXB
w, and AAA and AXB
m, respectively.
The averaged DVHs for AAA were shown to be very similar
for normal tissue structures, but some notable differences in PTV compared against AXB
wand AXB
m.
Discussion
The dosimetric performance of AAA, AXB
w, and AXB
mwas investigated for the H&N, prostate, spine, and lung cases.
The dosimetric evaluation was conducted regarding the results derived from the dose-volume parameters in the Eclipse TPS.
The preliminary results from the clinical cases in this study showed that there was similar trend of underestimating the doses from AXB
wand AXB
mfor almost dose-volumetric pa- rameters of PTV and normal organs when comparing to those from AAA. This dosimetric characteristics of the AXB has been investigated in several studies. Suresh et al. have shown that the AAA predicted higher minimum, mean and maximum doses to the PTV but the dose difference was less than 0.50%
and for normal organs the maximum doses in the AAA plans
were higher by in average 0.58% when compared to the AXB
plans.
24)For H&N patients who treated with IMRT, the mean
dose to the PTV was escalated naturally by 2.1%∼3.7% by changing from AXB to AAA for 4 MV photon beam.
19)Dose underestimation by AXB has been showed in simple geometry including heterogeneous materials, compared to AAA.
25,26)This characteristics of AXB could affect the dose distributions in patient having complicated geometry. Another possibility of in- consistency between AAA and AXB was to use FFF photon beam. The difference in electron contamination parameter by removal of flattening filter was observed for modeling.
12)The dose differences by AAA and AXB were affected by many factors which were beam energy, field size, field number, and densities of normal tissue and then further investigation is necessary. In contrast to our results, Zhen et al. have demon- strated that AAA was shown to underestimate the dose for spine VMAT plans with no statistical significance compared to AXB
m.
21)However, numerical data for dose-volumetric param- eter has shown that the dose differences between AAA and AXB
mwere less than 0.2 Gy and our result was maximum dose difference of 0.4 Gy.
For statistically evaluation, the numbers of p values less than 0.05 were 10, 6, 9, and 2 for cases of H&N, prostate, spine, and lung, respectively. In order to assess the impact of calculation algorithms, the numbers of p values less than 0.05 for comparison of two algorithms which were AAA and AXB
m, AAA and AXB
w, and AXB
mand AXB
wwere 11, 6, and 10, respectively. Although AAA and AXB
whad different calculation mechanism, these algorithms were based on “water”.
It has demonstrated that the dose distribution calculated by AXB
wwas similar to those of AAA when comparing the dose distributions between AAA and AXB
m. The tendency in the dosimetric impact of AXB depends on the tumor location, beam energy and near tissues.
26)The mean values of the relative dose difference for lung cases were smaller than those for other cases as shown in Fig.
4. These findings are similar to what has been reported in the literature.
25,26,28)The reason for this small difference between AXB and AAA is attributed to the modeling of the hetero- geneity of lung tissue in the AXB, compared to AAA as re- ported by other studies.
14,25)Robinson et al. have demonstrated that AAA overestimates the doses to interface of the hetero- geneity supporting this findings.
29)Liu et al. have also reported that the effect of Hounsfield Unit (HU) values on the dose dif-
ferences calculated AAA and AXB and lower HU values could make the dose differences between AAA and AXB larger.
30)In our study, 10 patients for lung cases had clear de- lineation of gross tumor volume in SBRT and then dosimetric impact of AXB was slightly significant to dose calculation in comparison with AAA.
As shown in Figures 1, 2, 3, and 4, the DVHs calculated by AXB
wwas more matched with those of AAA for all cases in comparison with AXB
mand AAA. For calculation procedure of AAA, last step to convert the absorbed energy distribution to a dose is scaling water materials using electron density in- stead of mass density. The report mode in AAA could be gen- erally considered as dose-to-water mode supporting our findings.
31,32)Selecting the appropriate dose reporting mode in the clinic is still debate. In 2003, Liu has asserted that dose-to-medium allows to provide a closer relationship be- tween tissue response and dose while Keall has argued against this assertiveness and stated that all clinical experience and dosimetry protocols are based on the dose-to-water.
22)Further study is needed to determine the clinical impact depending on dose reporting modes in AXB.
Conclusion
In this study, the dose distributions calculated by AAA, AXB
w, and AXB
mwere compared in all cases for H&N, pros- tate, spine, and lung for validating the performance of AXB.
Both AXB
wand AXB
mwere tended to underestimate dose for PTV and normal tissues compared to AAA. For analyzing two dose reporting modes in AXB, the dose distribution calculated by AXB
wwas similar to those of AAA when comparing the dose distributions between AAA and AXB
m.
References
1. Otto K: Volumetric modulated arc therapy: IMRT in a single gantry arc. Med Phys 35, 310-317 (2008)
2. Park JM, Kim IH, Ye SJ, Kim K: Evaluation of treatment plans using various treatment techniques for the radiotherapy of cutaneous Kaposi's sarcoma developed on the skin of feet. J Appl Clin Med Phys 15, 4970 (2014)
3. Park JM, Kim K, Chie EK, Choi CH, Ye SJ, Ha SW:
RapidArc vs intensity-modulated radiation therapy for hep- atocellular carcinoma: a comparative planning study. Br J Radiol
85, e323-329 (2012)
4. Park JM, Wu HG, Kim JH, Carlson JN, Kim K: The effect of MLC speed and acceleration on the plan delivery accuracy of VMAT. Br J Radiol 88, 20140698 (2015)
5. Jin H, Jesseph FB and Ahmad S: A comparison study of volumetric modulated Arc therapy quality assurances using por- tal dosimetry and MapCHECK 2. Prog Med Phys. 25, 7 (2014) 6. Mattes MD, Lee JC, Elnaiem S, Guirguis A, Ikoro NC,
Ashamalla H: A predictive model to guide management of the overlap region between target volume and organs at risk in prostate cancer volumetric modulated arc therapy. Radiat Oncol J 32, 23-30 (2014)
7. Borgers C: Complexity of Monte Carlo and deterministic dose-calculation methods. Phys Med Biol 43, 517-528 (1998) 8. Gifford KA, Horton JL, Wareing TA, Failla G, Mourtada
F: Comparison of a finite-element multigroup discrete-ordinates code with Monte Carlo for radiotherapy calculations. Phys Med Biol 51, 2253-2265 (2006)
9. Vassiliev ON, Wareing TA, McGhee J, Failla G, Salehpour MR, Mourtada F: Validation of a new grid-based Boltzmann equation solver for dose calculation in radiotherapy with photon beams. Phys Med Biol 55, 581-598 (2010) 10. Han T, Mikell JK, Salehpour M, Mourtada F: Dosimetric
comparison of Acuros XB deterministic radiation transport meth- od with Monte Carlo and model-based convolution methods in heterogeneous media. Med Phys 38, 2651-2664 (2011) 11. Bush K, Gagne IM, Zavgorodni S, Ansbacher W,
Beckham W: Dosimetric validation of Acuros XB with Monte Carlo methods for photon dose calculations. Med Phys 38, 2208-2221 (2011)
12. Fogliata A, Nicolini G, Clivio A, Vanetti E, Mancosu P, Cozzi L: Dosimetric validation of the Acuros XB Advanced Dose Calculation algorithm: fundamental characterization in water. Phys Med Biol 56, 1879-1904 (2011)
13. Lloyd SA and Ansbacher W: Evaluation of an analytic linear Boltzmann transport equation solver for high-density inhomogeneities. Med Phys 40, 011707 (2013)
14. Kron T, Clivio A, Vanetti E, Nicolini G, Cramb J, Lonski P et al.: Small field segments surrounded by large areas only shielded by a multileaf collimator: comparison of experiments and dose calculation. Med Phys 39, 7480-7489 (2012) 15. Han T, Mourtada F, Kisling K, Mikell J, Followill D,
Howell R: Experimental validation of deterministic Acuros XB algorithm for IMRT and VMAT dose calculations with the Radiological Physics Center's head and neck phantom. Med Phys 39, 2193-2202 (2012)
16. Han T, Followill D, Mikell J, Repchak R, Molineu A, Howell R et al.: Dosimetric impact of Acuros XB deterministic radiation transport algorithm for heterogeneous dose calculation in lung cancer. Med Phys 40, 051710 (2013)
17. Kathirvel M, Subramanian S, Clivio A, Arun G, Fogliata A, Nicolini G et al.: Critical appraisal of the accuracy of Acuros-XB and Anisotropic Analytical Algorithm compared to measurement and calculations with the compass system in the delivery of RapidArc clinical plans. Radiation Oncology 8 (2013)
18. Huang B, Wu L, Lin P, Chen C: Dose calculation of Acuros XB and Anisotropic Analytical Algorithm in lung stereotactic body radiotherapy treatment with flattening filter free beams and the potential role of calculation grid size. Radiat Oncol 10, 53 (2015) 19. Hirata K, Nakamura M, Yoshimura M, Mukumoto N,
Nakata M, Ito H et al.: Dosimetric evaluation of the Acuros XB algorithm for a 4 MV photon beam in head and neck in- tensity-modulated radiation therapy. J Appl Clin Med Phys 16, 5222 (2015)
20. Rana S, Rogers K, Lee T, Reed D, Biggs C: Dosimetric impact of Acuros XB dose calculation algorithm in prostate can- cer treatment using RapidArc. J Can Res Ther 9, 430-435 (2013) 21. Zhen H, Hrycushko B, Lee H, Timmerman R, Pompos A,
Stojadinovic S et al.: Dosimetric comparison of Acuros XB with collapsed cone convolution/superposition and anisotropic analytic algorithm for stereotactic ablative radiotherapy of thora- cic spinal metastases. J Appl Clin Med Phys 16, 5493 (2015) 22. Liu HH: Dm rather than Dw should be used in Monte Carlo treat- ment planning. For the proposition. Med Phys 29, 922-923 (2002) 23. Walters BR, Kramer R, Kawrakow I: Dose to medium ver- sus dose to water as an estimator of dose to sensitive skeletal tissue. Phys Med Biol 55, 4535-4546 (2010)
24. Rana S and Pokharel S: Dose-to-medium vs. dose-to-wa- ter: Dosimetric evaluation of dose reporting modes in Acuros XB for prostate, lung and breast cancer. Int J Cancer Ther Oncol 2, 020421 (2014)
25. Fogliata A, Nicolini G, Clivio A, Vanetti E, Cozzi L:
Dosimetric evaluation of Acuros XB Advanced Dose Calculation algorithm in heterogeneous media. Radiat Oncol 6, 82 (2011) 26. Kan MW, Leung LH, Yu PK: Dosimetric impact of using the Acuros XB algorithm for intensity modulated radiation therapy and RapidArc planning in nasopharyngeal carcinomas. Int J Radiat Oncol Biol Phys 85, e73-80 (2013)
27. Kathirvel M, Subramanian S, Clivio A, Arun G, Fogliata A, Nicolini G et al.: Critical appraisal of the accuracy of Acuros-XB and Anisotropic Analytical Algorithm compared to measurement and calculations with the compass system in the delivery of RapidArc clinical plans. Radiat Oncol 8, 140 (2013) 28. Fogliata A, Nicolini G, Clivio A, Vanetti E, Cozzi L:
Critical appraisal of Acuros XB and Anisotropic Analytic Algo- rithm dose calculation in advanced non-small-cell lung cancer treatments. Int J Radiat Oncol Biol Phys 83, 1587-1595 (2012) 29. Robinson D: Inhomogeneity correction and the analytic aniso-
tropic algorithm. J Appl Clin Med Phys 9, 112-122 (2008) 30. Liu HW, Nugent Z, Clayton R, Dunscombe P, Lau H,
Khan R: Clinical impact of using the deterministic patient dose calculation algorithm Acuros XB for lung stereotactic body radia- tion therapy. Acta Oncologica 53, 324-329 (2014)
31. Fogliata A, Vanetti E, Albers D, Brink C, Clivio A, Knoos T et al.: On the dosimetric behaviour of photon dose calculation algorithms in the presence of simple geometric het- erogeneities: comparison with Monte Carlo calculations. Phys Med Biol 52, 1363-1385 (2007)
32. Beam Configuration Reference Guide. Varian medical system (2009)