Vol. 21, No. 4, pp. 397-402, August 31, 2015, ISSN 1229-3431(Print) / ISSN 2287-3341(Online) http://dx.doi.org/10.7837/kosomes.2015.21.4.397
A Study on the Observation Days of Maritime Traffic Investigation
Sang-Lok Yoo Seong-Book Park Young-Soo Park Jae-Yong Jeong
*, ** Graduate school of Mokpo National Maritime University, Mokpo 58628, Korea
*** Korea Maritime and Ocean University, Busan 49112, Korea
**** Mokpo National Maritime University, Mokpo 58628, Korea
해상교통조사 관측일수에 관한 연구
유상록 박성북 박영수 정재용
*, ** 목포해양대학교 대학원, *** 한국해양대학교, **** 목포해양대학교
Abstract : This study is to compare variation indexes by monthly, weekly and hourly using AIS data, which was collected for 365 days from January 1st to December 31st, 2013 at Mokpo Port and then, computed the maximum standard error by observation days. The comparison of monthly variation indexes showed that the monthly variation indexes for September and February were 1.11 and 0.84, respectively, in turn revealing that the maritime traffic in September was about 32.1 % larger than February. Also, the daily variation indexes for Tuesday and Sunday were 1.05 and 0.92, respectively, in turn revealing that the maritime traffic in Tuesday was about 14.1 % larger than Sunday. When the maritime traffic investigation is executed for at least 1 week in consideration of the daily variation index, it is possible to reduce the maximum standard error rate to be within 21 %. Therefore, if the maritime traffic investigation is made in the month and week with low maritime traffic, each variation index should be applied to reflect the actual maritime traffic.
Key Words : Maritime traffic investigation, Observation days, AIS, Variation index, Maximum standard error
요 약 : 본 연구는 관측일수에 따른 교통량의 신뢰성을 검증하고자 한다. 목포항의 1년간 선박자동식별장치(AIS) 자료를 사용하여 월별, 요일별, 시간별 변화지수를 비교한 후, 각 관측일수에 따른 최대표준오차를 산출하였다. 월별변화지수를 비교한 결과 9월달 1.11, 2월달 0.84로 나타나 9월달이 2월달 교통량 보다 약 32.1 % 많은 것으로 나타났다. 요일변화지수는 화요일 1.05, 일요일 0.92로 나타나 화요일이 일 요일 교통량보다 약 14.1 % 많았다. 해상교통조사는 요일변화지수를 고려하여 최소 1주일 이상 실시하면 최대표준오차를 21 % 이내로 산 출할 수 있다. 따라서 해상교통조사 관측시기에 따라 각 변화지수를 적용하여 교통량의 흐름을 반영한 연구가 뒷받침 되어야 하겠다.
핵심용어 : 해상교통조사, 관측일수, 선박자동식별장치, 변화지수, 최대표준오차
1. Introduction
*The maritime traffic investigation could be utilized as data for the maritime traffic congestion and flow evaluation, which is to evaluate whether a fairway could accommodate the maritime traffic volume, as well as setting of speed limits and improvement of fairways.
The previous studies on maritime traffic investigation include a study made on a 3-day maritime traffic investigation (Im et al., 2007; Kim et al., 2011; Lee et al., 2012) as well as studies on a
* First Author : [email protected], 061-241-2750 Corresponding Author : [email protected], 061-240-7175
7-day maritime traffic investigation(Kim et al., 2006) and a 10-day maritime traffic investigation(Park et al., 2006). However, all of them have failed to suggest an error in the estimated maritime traffic upon the number of days investigating the maritime traffic.
Also, they also did not suggest variation indexes including a month and a week and a hour of the maritime traffic investigation. In Japan, studies on the maritime traffic investigation have received a lot of interest(Kinzo and Kiyoshi, 1974), but there is no study on the maritime traffic investigation of Korea.
Therefore, this study aims to suggest variation indexes of the monthly and weekly maritime traffic, and validate the computation of the number of days of observation.
2. Method of Study
2.1 Area of Study
This study was made with AIS(Automatic Identification System) data, which was collected for 365 days from January 1st to December 31st, 2013 at Mokpo Port and the analysis object region was Mokpogu where vessels navigating Mokpo Port pass through, as shown in the Fig. 1.
Fig. 1. Area of study.
2.2 Procedure of Study
Fig. 2 shows the study procedure, which is to compare the maritime traffic by maritime traffic investigation period such as a month, a week and a hour and then, apply it with the variation index and suggest the maximum standard error by observation days.
Fig. 2. Procedure of study.
3. Maritime Traffic Analysis
3.1 Daily maritime traffic
Fig. 3 shows the daily maritime traffic. Table 1, revealing the statistics data for 1 year, shows that 20,833 vessels navigated in one year and 76.8 vessels navigated in one day on average.
Fig. 3. Daily passing ship at Mokpogu.
Statistics data
Total passing ship (ships/1year) 28,033
Average (ships/1day) 76.8
(ships/1hour) 3.2
Standard deviation (ships/1day) 15.9 Coefficient of variation (CV) 0.207 Table 1. Statistics data of passing ship
3.2 Monthly maritime traffic
Table 2, showing the investigation of vessels navigating Mokpogu by month, reveals that the average daily vessel traffic was the highest, of 84.9 vessels, in September and smallest, of 64.5 vessels, in February. Fig. 4 shows the monthly variation index (The monthly average daily maritime traffic for each month ÷ the annual average daily maritime traffic), which was shown to be 1.11 and 0.84 for September and February, respectively so the maritime traffic in September was about 32.1 % higher than the maritime traffic in February.
3.3 Weekly maritime traffic
Table 3 shows the maritime traffic by week. The average weekly maritime traffic by week reveals that it was highest, of 80.7 vessels, in Tuesday and smallest, of 70.8 vessels, in Sunday. Fig. 5
shows the weekly variation index (The average weekly maritime traffic by day ÷ the annual average daily maritime traffic) revealing that the daily variation indexes of Tuesday and Sunday were 1.05 and 0.92, respectively and the maritime traffic in Tuesday is about 14.1 % higher than of Sunday.
Month Inbound
ship Outbound
ship Total per
day Variation index
January 1189 1172 2361 76.2 0.99
February 914 893 1807 64.5 0.84
March 1117 1069 2186 70.5 0.92
April 1241 1111 2352 78.4 1.02
May 1311 1229 2540 81.9 1.07
June 1218 1132 2350 78.3 1.02
July 1266 1157 2423 78.1 1.02
August 1188 1174 2362 76.2 0.99
September 1283 1263 2546 84.9 1.11
October 1374 1213 2587 83.4 1.09
November 1201 1080 2281 76.0 0.99
December 1152 1086 2238 72.2 0.94
Table 2. Monthly passing ship and variation index
Fig. 4. Monthly variation index.
Day of
Week Inbound
ship Outbound
ship Total per
day Variation index
Sunday 1897 1784 3681 70.8 0.92
Monday 1997 1936 3933 75.6 0.98
Tuesday 2257 2022 4279 80.7 1.05
Wednesday 2107 2053 4160 80.0 1.04
Thursday 2167 2021 4188 80.5 1.05
Friday 2068 1857 3925 75.5 0.98
Saturday 1961 1906 3867 74.4 0.97
Table 3. Weekly passing ship and variation index
Fig. 5. Weekly variation index.
Hour Inbound
ship Outbound
ship Total per
day Variation index
00-01 381 147 528 1.45 0.46
01-02 312 139 451 1.24 0.39
02-03 282 184 466 1.28 0.40
03-04 209 241 450 1.23 0.39
04-05 207 288 495 1.36 0.43
05-06 258 419 677 1.85 0.59
06-07 595 1043 1638 4.49 1.42
07-08 529 963 1492 4.09 1.29
08-09 555 999 1554 4.26 1.35
09-10 1196 977 2173 5.95 1.88
10-11 936 903 1839 5.04 1.59
11-12 754 540 1294 3.55 1.12
12-13 824 625 1449 3.97 1.25
13-14 792 944 1736 4.76 1.50
14-15 883 1036 1919 5.26 1.66
15-16 638 792 1430 3.92 1.24
16-17 621 636 1257 3.44 1.09
17-18 1193 474 1667 4.57 1.44
18-19 1027 389 1416 3.88 1.23
19-20 414 470 884 2.42 0.77
20-21 379 355 734 2.01 0.64
21-22 604 295 899 2.46 0.78
22-23 370 343 713 1.95 0.62
23-24 331 229 560 1.53 0.48
Table 4. Hourly passing ship and variation index
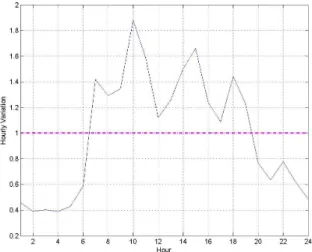
3.4 Hourly maritime traffic
Table 4 shows the maritime traffic by hour. Fig. 6 shows the
hourly variation index (The average daily maritime traffic by hour
÷ the annual average daily maritime traffic) revealing that the maritime traffic from 09 to 10 was 1.88 which is about 382.1 % higher than 0.39 for the maritime traffic from 03 to 04. Also, from 20 to 03, the number of inbound vessels was found to be relatively higher than of outgoing vessels and from 03 to 09, the number of outgoing vessels was relatively larger than of incoming vessels.
Fig. 6. Hourly variation index.
4. Reliability of Observation Days
4.1 Relationship between the Observation Days and Coefficient of Variation
When the coefficient of variation(CV) of the sample mean by the observation days is applied, it could be expressed as the equation (1)(Kinzo and Kiyoshi, 1974).
∙ (1)
Since the standard deviation() of the maritime traffic in Mokpogu were 15.9 vessels, and the sample mean () of the maritime traffic in Mokpogu was similar with the population mean ( of 76.8 vessels, it could be calculated as / =0.207 and expressed as the analytical equation (2).
∙ (2)
On the other hand, from the population, it is possible to calculate the sample mean () and standard deviation () for
sample groups in the number of i={number of days in one year-(n-1)}, which was calculated by moving the number of populations by each observation days. The regression equation for CV for each of 50 sample groups could be computed as in the Fig. 7 and then, expressed as the equation (3).
∙ (3)
Fig. 7. Relation between the observational days and Coefficient of variation.
4.2 Estimation of Annual Average Daily maritime traffic The annual average daily maritime traffic, in general, is estimated with continuous observation for days, as the equation (4).
∙ ∙ (4)
Where : Reliability Coefficient
: Estimated Annual Average Daily maritime traffic : Average maritime traffic, estimated with the observation
made in the number of days.
For instance, during the 7-day maritime traffic investigation at Mokpogu, when the annual average maritime traffic was calculated at the 95 % confidence level (=1.96), as the equation (5).
∙ ≒ 0.11 (5)
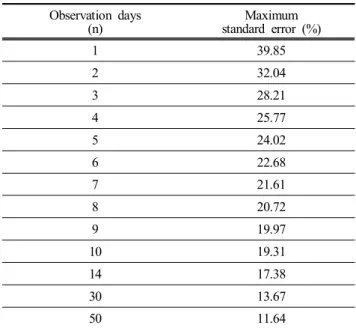
Table 5 shows the maximum standard error in the estimation of annual average daily maritime traffic by observation days. For
Observation days (n)
Maximum standard error (%)
Akashi kaikyo Mokpogu
1 49.8 39.8
3 32.3 28.2
5 26.4 24.0
7 23.2 21.6
10 20.1 19.3
14 17.6 17.3
30 13.1 13.6
50 10.7 11.6
Table 6. Comparison of Maximum standard error between Akashi kaikyo and Mokpogu
instance, when it is estimated at the 95 % confidence level, the 3-day maritime traffic investigation and 7-day maritime traffic investigation could have 28.2 % and 21.6 % of the maximum standard error, respectively.
Observation days
(n) Maximum
standard error (%)
1 39.85
2 32.04
3 28.21
4 25.77
5 24.02
6 22.68
7 21.61
8 20.72
9 19.97
10 19.31
14 17.38
30 13.67
50 11.64
Table 5. Maximum standard error by observation days (95 % confidence)
4.3 Comparison with Previous Studies
Table 6 shows the comparison of the maximum standard errors between the previous study(Kinzo and Kiyoshi, 1974) on the maritime traffic at the Akashi Strait for 1 year and this study, and it reveals that a result of this study is similar with of the aforementioned study. When the observation days was 14, the
maximum standard errors were found to be 17.6 and 17.3 for the Akashi Strait and Mokpogu, respectively. Also, when the observation days was 30, the maximum standard errors were found to be 13.1 and 13.6 for the Akashi Strait and Mokpogu, respectively. It could be reasonable to assume that the maximum standard error tends to be similar when the observation days is 14 or above.
5. Conclusion
In this study, a difference in the monthly, weekly and hourly maritime traffic was compared after applying it with the variation index, and the maximum standard error, varied by observation days, is as the following.
The comparison of monthly variation indexes showed that the monthly variation indexes for September and February were 1.11 and 0.84, respectively, in turn revealing that the maritime traffic in September was about 32.1 % larger than February. Also, the daily variation indexes for Tuesday and Sunday were 1.05 and 0.92, respectively, in turn revealing that the maritime traffic in Tuesday was about 14.1 % larger than Sunday. Therefore, if the maritime traffic investigation is made in the month and week with low maritime traffic, each variation index should be applied to reflect the actual maritime traffic. Also, it is suggested that the maritime traffic investigation should be made on Tuesday, Wednesday and Thursday in either September or October when the maritime traffic is relatively large. When the maritime traffic investigation is executed for at least 1 week in consideration of the daily variation index, it is possible to reduce the maximum standard error rate to be within 21 %.
Since this study suggest an error rate of the maritime traffic investigation by variation index and observation days, it is possible to detect the maritime traffic flow by month, week, and hour.
Thus, it could be utilized as data for the maritime traffic congestion and flow evaluation, which is to evaluate whether a fairway could accommodate the volume of maritime traffic, as well as setting of speed limits and improvement of fairways.
Acknowledgements
The contents of this paper are the results of the research project of the Ministry of Oceans and Fisheries of Korea(A fundamental research on maritime accident prevention phase 2).
Reference
[1] Im, N. K., C. S. Kim, H. S. Yang and K. W. Lee(2007), A Study on Design of Emergency Anchorage at Adjacent Waters of Wan-do Port, Journal of the Korean Scociety of Marine Environment & Safety, Vol. 14, No. 1, pp. 65-69.
[2] Kim, C. S., G. S. Rim and S. C. Kim(2011), A Study on the Improvement of the Daesan Harbor Fairway, Journal of Korean Navigation and Port Research, Vol. 17, No. 2, pp.
143-148.
[3] Kim, C. W., Y. S. Lee, Y. S. Park, G. H. Yun and D. H.
Kim(2006), A Study on the Traffic Stream and Navigational Characteristics at the Adcacent Sea Area of Busan Central Wharf, Journal of Korean Navigation and Port Research, Vol.
30, No. 1, pp. 9-15.
[4] Kinzo, I. and H. Kiyoshi(1974), Relations between the Number of Observational Days and the Accuracy on the Estimation of Average Annual Daily Traffic Volume, Japan Institute of Navigation, Vol. 50, pp. 1-8.
[5] Lee, Y. S., J. Y. Jong and C. S. Kim(2012), A Study on the Designation of MIPO Emergency Anchorage, Journal of the Korean Scociety of Marine Environment & Safety, Vol. 18, No. 4, pp. 316-322.
[6] Park, S. H., J. S. Jeong and Y. S. Park(2006), A Study on Establishment of Traffic Separation Scheme for Adjacent Sea Area on Yeosu Port, Journal of the Korean Scociety of Marine Environment & Safety, Vol. 12, No. 2, pp. 133-137.
Received : 2015. 06. 24.
Revised : 2015. 07. 27. (1st) : 2015. 08. 17. (2nd) Accepted : 2015. 08. 27.