서울시 및 경기도의 생태계교란식물 취약지역 평가*
박현철1)․이관규2)․이정환3)
1)강원대학교 대학원 조경학과․2)강원대학교 조경학과․3)강원대학교 환경연구소
Regional Vulnerability Assessment of Invasive Alien Plants in Seoul and Gyeonggi Province*
Hyun-Chul Park1)․Gwan-Gyu Lee2) and Jung-Hwan Lee3)
1)Department of Landscape Architecture, Graduate School, Kangwon National University,
2)Department of Landscape Architecture, Kangwon National University,
3)Institute of Environmental Research at Kangwon National University.
ABSTRACT
This study was conducted to develop an environmental index for assessing the vulnerability of areas with invasive alien plants. To that end, “Regional Vulnerability Numerical Index” (RVNI) was developed with a spatial statistical technique and applied to Seoul and Gyeonggi-do area first. The results are as follows. First, RVNI was high in stream areas. Second, RVNI was lowest in mountain areas. It indicates that stream areas are vulnerable to invasive alien plants. In terms of regions, Guri City is most vulnerable and Gapyeong-gun is the least vulnerable. To expand and manage the invasive alien plants, a control protocol should be developed by considering the physiology and ecology by invasive alien plant. Also, related policies should be pursued based on the results. Thus, the findings of this study can be used as baseline data for setting policies for invasive alien species management.
Key Words:Alien species, Species distribution models, Biodiversity, Climate change.
* 본 논문은 환경부 차세대에코이노베이션 환경기술개발사업(416-111-013) 및 강원대학교 환경연구소의 지원으로 수행된 연구의 일부입니다.
First author:Hyun-Chul Park, Department of Landscape Architecture, Kangwon National University, 1 Kangwondaehak-ro, Chuncheon-si, Gangwon 24341, South Korea,
Tel:+82-33-250-7319, E-mail:[email protected]
Corresponding author:Jung-Hwan Lee, Research Professor, Institute of Environmental Research at Kangwon National University, 1 Kangwondaehak-ro, Chuncheon-si, Gangwon 24341, South Korea, Tel:+82-33-250-7319, E-mail:[email protected]
Received:25 June, 2015. Revised:26 November, 2015. Accepted:13 December, 2015.
- 1 -
I. 서 론
외래생물은 농업용, 조경용, 공업용 등의 목적 으로 국내에 유입되며, 국가간 무역의 증가, 해 외 여행인구의 증가, 철새의 이동 등 의도치 않 은 경로에 의해서도 유입되기도 한다(Pimentel et al., 2001; Perrings et al., 2005; Kettunen et al., 2008; Van Wilgen et al., 2008). 뿐만 아니라 지 구온난화 역시 외래생물 유입의 원인이 되고 있 다(Sala et al., 2000). 외래생물 중 기존의 생태 계, 서식처, 종다양성의 위협요인이 되며 생물다 양성 감소에 주요한 원인이 되는 생태계교란생물 의 침입 역시 증가하는 추세이다(Wilcove et al., 1998; CBD, 2008; IUCN, 2011). 특히 생태계교 란식물은 다양한 방법에 의한 종자 확산 및 왕성 한 영양 번식으로 개체군을 확장하여 고유 생태 계를 교란할 뿐 아니라 심할 경우 자생종을 절멸 시키며, 꽃가루 등의 알레르기 물질을 발생시키 는 등 인간생활에도 악영향을 준다(Gurevitch and Padilla, 2004; Mooney 2005; Pimentel et al., 2005). 또한 농업 및 생태복원에서 상당한 위협 요인이며 생태계교란식물이 침입한 경작지 및 교란된 생태계를 복원하기 위해서는 많은 비용 이 소요되기 때문에 생물학적 침입을 예방하 기 위한 사전대책 마련이 필요하다(Van Wilgen et al., 2001).
환경부는 외래생물 중에서 생태계에 부정적 인 영향을 미치는 종을 생물다양성 보전 및 이 용에 관한 법률에 의해 생태계교란생물로 지정 하고 확산 방지를 위해 다양한 정책을 마련하고 있다(Kil et al., 2004). 각 지방자치단체에서는 인력에 의해 생태계교란생물의 포획 및 제거활 동을 실시하고 있지만 인력 및 예산부족 등으로 현실적인 어려움이 직면해 있다. 국가차원에서
생태계교란생물의 확산 예방을 목적으로 지속 적인 모니터링(NIER, 2007; 2008; 2009; 2010;
2011; 2012; 2013)을 실시하고 있지만 기존 서 식처의 개체군 변화 및 신규 서식처의 조사에 머무르고 있어 생물다양성 보전을 위한 의사결 정 수단으로 활용할 환경지표의 역할을 하지 못 하고 있다.
지속가능한 국토개발을 위해 시행하는 환경영 향평가 과정에는 생물다양성 보전을 위해 국토환 경성평가, 생태․자연도 등의 환경지표1)가 활용 되고 있다. 그러나 평가 대상지역의 생태계교란 생물 취약성을 파악할 수 있는 환경지표는 아직 개발되지 않고 있다. 이는 국토개발과정 중 생태 계교란생물의 확산 대응을 위한 의사결정 도구로 써의 환경지표가 필요함을 시사하고 있다.
본 연구에서는 교란 생태계를 파악할 수 있는 환경지표를 개발하기 위한 기초 연구로 서울 및 경기도 지역의 생태계교란식물 취약지역을 도 출하고 이를 생태계교란식물 취약지수로 개발 하고자 한다. 본 연구의 결과는 국가 및 지방자 치단체의 교란생태계 관리 및 생물다양성 보전 을 위한 의사결정 도구로 활용되길 기대한다.
II. 연구 방법
1. 생태계교란식물의 공간 분포 예측
생태계교란식물의 취약지역 평가를 위해서는 생태계교란식물의 공간분포 파악이 우선시 되 어야 한다. 산림식생과 같이 동일종이 군집을 형성하는 경우에는 항공사진 분석 등의 원격탐 사 방법을 통해 취약지역을 도면화 할 수 있지 만 생태계교란식물의 경우에는 대부분 초본식 물로 군집을 형성하더라도 항공사진 상으로는 명확한 구분이 어렵다. 인력을 동원하여 생태계
1) 환경지표(Environmental indicator)는 특정 환경에 관한 상태를 정량적으로 평가하는 도구이며, 정책, 기본계획, 실시 설계와 관련된 의사결정에 중요한 정보를 제공한다(Bockstaller and Girardin, 2003; Cloquell-Ballester et al., 2006).
교란식물 분포지역을 조사하더라도 명확한 경 계설정이 어렵고 많은 인원과 비용 발생하기 때 문에 비효율적일 것이다. 이러한 한계를 극복하 기 위해서는 생태계교란식물 분포에 관여하는 환경요인과 출현 위치를 이용하여 확률론적으 로 공간 분포를 예측하는 것이 효율적일 것이 다. 이러한 방법에 사용되는 것이 종 분포 모형 (Species distribution models, SDMs)이다. SDMs 는 생물종이 분포하는 위치의 환경 및 지형적 관계를 통계적으로 해석하고 평가할 수 있으며, 생물지리학, 보전생물학, 생태학 분야에서 다양 한 목적으로 사용되고 있다(Elith and Leathwick, 2009; Franklin, 2010; Hof et al., 2012). SDMs는 알고리즘에 따라 다양한 종류가 있으며, 본 연 구에서는 다양한 연구 분야에서 활용되고 우수 한 모형으로 입증된 MaxEnt (Maximum entropy modeling of species geographic distributions)를 사용하였다(Phillips et al., 2008; Merow et al., 2013). MaxEnt는 제한된 변수를 이용한 확률 모 형이기 때문에 모형의 정확성을 위해 5회 교차 검 증(5-fold cross-validation)을 실시하였고(Thuiller, 2003; Merow et al., 2013), 모형의 정확성 진단을 위해 ROC(Receiver Operating Characteristic)의 AUC(Area Under Curve)값을 측정하였다. ROC의 AUC는 모형 결과의 효율성을 판단하는 방법 중 널리 사용되는 것으로 모형의 민감도(sensitivity) 와 특이도(specificity)를 이용하여 산출된다. AUC 가 높을수록 모형의 정확도가 높으며 일반적으 로 모형의 정확도가 완벽할 경우 AUC는 1.0이 며, 0.7이상일 경우 모형이 예측한 결과가 적절 (fair)하고, 0.5∼0.6사이일 경우 모형은 정확치 않다고 판단한다(Swets, 1988; Hosmer Jr and Lemeshow, 2004). 또한 환경변수의 기여도 분 석을 통해 생태계교란식물 분포에 영향을 주는 환경변수를 선별하였다. 기여도 분석은 생태계 교란식물 각 출현지점별로 획득된 환경변수의 속성을 MaxEnt 알고리즘으로 상관성 분석을 수 행하였고, 기여도가 높은 환경변수는 생태계교
란식물의 분포에 관여하는 공통된 환경요인임 을 시사한다(Phillips et al., 2006).
2. 생태계교란식물의 출현자료 수집
SDMs를 이용해 생태계교란식물의 공간 분포 확률을 예측하기 위해서는 출현자료(Presence data) 라고 하는 생태계교란식물이 분포하는 위치의 공간좌표가 필수적이다(Austin, 2007; Elith et al., 2011).
본 연구에서는 2007년부터 2015년동안 현장 조사를 통해 생태계교란식물의 출현자료를 수 집하였다. 한편, 최근 SDMs를 사용한 연구에 의 하면 출현자료의 표본 편향(sampling bias)에 의한 공간적 자기상관(spatially autocorrelated)으로 인 해 SDMs의 오류가 보고되기도 하였다(Segurado et al., 2006; Betts et al., 2006; Dormann, 2007;
Pearson et al., 2007; Veloz, 2009; McCormack et al., 2010; Warren and Seifert, 2011; Naimi et al., 2011). 따라서 본 연구에서는 공간적 자기상관 에 의한 오류를 해결하기 위해 1km 이내 중복되 는 출현자료를 제거하여 변수로 사용하였으며 중복 출현자료의 제거는 SDM Toolbox(v1.1)를 사용하였다(Brown, 2014).
3. 환경변수 선정
MaxEnt의 설명변수로 생태계교란식물 분포 지역의 환경특성을 반영할 수 있는 요소를 선정 하였다. 우선 기본적으로 지형적 요소로 고도, 경사, 향방향을 선정하고 국립환경과학원의 생 태계교란종 모니터링을 참고하여 생태계교란식 물이 분포하는 지역을 고려한 변수를 생성하였 다(NIER, 2007; 2008; 2009; 2010; 2011; 2012;
2013). 국립환경과학원의 연구에 의하면 생태계 교란식물의 분포지역은 하천, 호수, 나지, 초지, 산림, 도심지의 공원, 도로변 등이며 이러한 분 포 지역을 공간분포 예측에 반영하기 위해서 수 계로부터의 거리, 도로에서부터의 거리, 산림으 로부터의 거리, 토지피복, 식생지수를 변수로
선정하였다. 토양의 경우 식물 분포의 중요한 제한 요인이므로(Jobbágy and Jackson, 2001;
Cousins and Lindborg, 2004) 취약지역 예측을 위한 변수로 선정하였다(Table 1).
4. 생태계교란식물 취약지역 분석
MaxEnt에 의해 예측된 종 분포 지역은 실제 종이 분포하거나 종이 분포하는 환경조건이 충 족되는 잠재적 분포지역이다. 종 분포 확률을 0∼1의 범위로 예측되며, 이 범위에서 종의 출현 지역으로 판단할 수 있는 지역은 확률의 임계값 (threshold value)이상 지역이다. 취약지역 분석을 위해 확률의 임계값을 기준으로 비출현(0)과 출 현(1)으로 구분하는 이항형 지도(binary map)로 변환하였고, 임계값은 모형의 민감도(sensitivity) 와 특이도(specificity)의 합이 최대가 되는 확률 을 기준으로 하였다(Liu et al., 2013).
취약지역 분석은 각 생태계교란식물의 이항 형 지도를 기준으로 출현 지역을 합산하여 분 석하였으며, 산출된 값은 생태계교란식물 취약 지수(Regional Vulnerability Numerical Index, RVNI)라고 정의하였다. RVNI가 높을수록 많은
종의 생태계교란식물의 분포하는 지역 즉, 생태 계교란식물 분포에 취약한 지역임을 의미한다 (식 1).
(식 1)
RVNI = 취약지수(Regional vulnerability numerical index)
n = 연구대상 종수
Gi = 각 종의 이항형 지도에서 출현값(1)을 갖는 격자
RVNI 분석은 SDMs 실행이 가능한 종을 대 상으로 실시하였고, RVNI가 1 이상인 지역은 1 개 종 이상의 생태계교란식물이 분포하거나 잠 재적인 분포지역임을 의미한다. 따라서 각 지방 자치단체의 생태계교란식물 취약지역 분포 비 율을 분석하면 상대적인 취약지역 비교가 가능 하게 되며, 각 지방자치단체의 환경계획 수립에 필요한 의사결정 수단이 될 수 있다. 생태계교 란 식물 취약지역 비율(RVNI rate, R)은 각 지 Table 1. Environmental predictors included in MaxEnt modeling for the this study.
Variable Code Description Source
Topography DEM Continuous values of the elevation Digital Topographic Map Slope Continuous values of the slope Digital Topographic Map Aspect Continuous values of the aspect Digital Topographic Map dfw Euclidean Distance from waterway Digital Topographic Map road Euclidean Distance from road Digital Topographic Map forest Euclidean Distance from forest edge 4th Forest Type Map
Soil taxgwrb Soil classification of WRB criteria ISRIC-World Soil Information, (http://soilgrids.org) soilph The pH of the soil
Land cover landc Level 2 Land Cover Map Environmental Geographic Information Service(https://egis.me.go.kr) NDVI ndvi Maximum green vegetation fraction
from MOD13A2 Broxton et al.(2014)
방자치단체 면적대비 RNVI가 1이상인 지역의 비율로 산출하였다(식 2).
(식 2)
R = RVNI rate(%)
RVNI>1 = 각 지방자치단체의 RVNI 1 이상의
면적
Marea = 각 지방자치단체의 면적
III. 연구 결과
1. 생태계교란식물의 분포
2015년 현재 「생물다양성 보전 및 이용에 관 한 법률」에서 지정한 생태계교란식물은 12종이 며, 이중 경기도 및 서울에 분포하는 종은 8종으 로 나타났다(Table 2). Figure 1는 생태계교란식 물 8종의 출현자료에서 취득한 GPS 좌표를 공 간상에 표현한 것이며 SDMs의 출현자료로 사
용하였다. 생태계교란식물 중에서 가시박은 하 천 제방사면이나 뚝마루 또는 하천과 인접한 숲 가장자리에 주로 분포하고 있으며, 단풍잎돼지 풀, 돼지풀, 미국쑥부쟁이, 애기수영, 가시상추 는 하천변, 숲 가장자리의 초지, 도심지의 초지 등 산림을 제외한 초지에 분포하는 경향을 나타 내었다. 반면 서양등골나물은 산림이나 도심 인 공녹지의 초본층에 분포하였다.
2. 생태계교란식물 분포 지역의 예측
생태계교란식물의 종 분포 확률을 예측하기 위해 Table 1의 환경 변수와 Figure 1의 종 출현 자료를 이용하여 생태계교란식물의 분포 지역 을 분석하였다(Figure 2). Franklin(2010)에 의하 면 MaxEnt는 통계기반이기 때문에 공간 통계 분석을 위한 최소 출현자료가 필요하며, 최소 출현자료는 일반적으로 7지점 이상으로 본다.
본 연구에서 수집한 생태계교란식물 8종의 출 현자료 중 도깨비가지의 출현 자료는 6개로 최 소 지점 수에 미달하였다. 따라서 종 분포 예측
Table 2. Invasive alien plants listed in South Korea and number of occurrence locations that have been used in the study.
Scientific name Korea name Distribution species in study area
Number of occurrence locations
Sicyos angulatus 가시박 84
Ambrosia trifida var. trifida 단풍잎돼지풀 198
Ambrosia artemisiifolia 돼지풀 117
Aster pilosus 미국쑥부쟁이 184
Rumex acetosella 애기수영 44
Lactuca scariola 가시상추 19
Eupatorium rugosum 서양등골나물 103
Solanum carolinense 도깨비가지 6
Solidago altissima 양미역취
Hypochaeris radicata 서양금혼초
Paspalum distichum 물참새피
Paspalum distichum var. indutum 털물참새피
은 가시박, 단풍잎돼지풀, 돼지풀, 서양등골나 물, 미국쑥부쟁이, 가시상추, 애기수영 7개종에 한하여 시행하였다(Table 2).
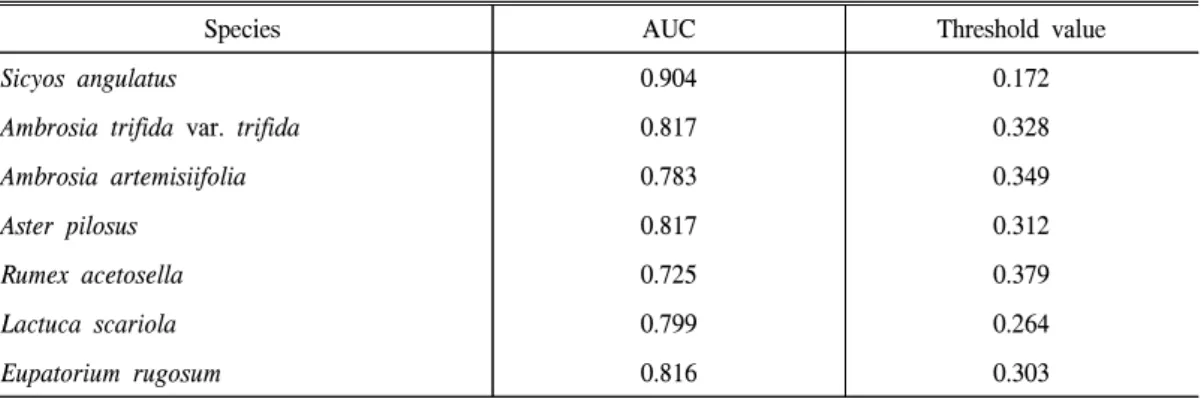
MaxEnt 수행 결과, AUC는 0.725∼0.904 범 위로 측정되었고, 모형의 정확도는 우수한 것으 로 판정되었다(Table 3의 AUC).
환경변수가 종 분포 확률에 기여하는 기여도 평가를 실시한 결과, 하천주변에 분포하는 가시
박은 수계로부터의 거리(dfw)의 기여도가 가장 높았으며, 산림 등의 녹지에 주로 분포하는 서 양등골나물은 산림으로 부터의 거리(내부)와 식 생지수의 기여도가 높았다. 단풍잎돼지풀, 미국 쑥부쟁이, 돼지풀, 가시상추는 산림으로부터의 거리(외부)와 토양도의 기여도가 높았으며, 애 기수영은 토지피복과 수계로부터의 거리의 기 여도가 높았다(Table 4).
Table 3. AUC of Species distribution model and threshold for the presence/absence classification.
Species AUC Threshold value
Sicyos angulatus 0.904 0.172
Ambrosia trifida var. trifida 0.817 0.328
Ambrosia artemisiifolia 0.783 0.349
Aster pilosus 0.817 0.312
Rumex acetosella 0.725 0.379
Lactuca scariola 0.799 0.264
Eupatorium rugosum 0.816 0.303
Figure 1. Map of the study area in South Korea and occurrence locations(black point) of invasive alien plants.
(A) Sicyos angulatus. (B) Ambrosia trifida var. trifida, (C) Ambrosia artemisiifolia, (D) Aster pilosus.
(E) Rumex acetosella, (F) Lactuca scariola, (G) Eupatorium rugosum, (H) Solanum carolinense
3. 생태계교란식물 취약지역 평가
ⓛ RVNI 분석
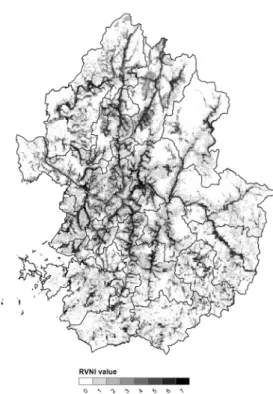
RVNI는 생태계교란식물 분포 지역 예측 (Figure 2)자료와 출현/비출현의 기준이 되는 임 계값(Table 3의 Threshold value)을 기준으로 이 항형 지도를 작성하고 식-1에 의해 분석하였다 (Figure 3). RVNI은 0∼7의 범위로 분석되었고 RVNI 값이 0은 생태계교란식물이 분포하지 않 거나 생태계교란식물이 분포하기에 적합하지 않은 지역을 의미한다. 반면 RVNI>1 지역은 1 개종 이상의 생태계교란식물이 분포하거나 잠 재적인 분포지역임을 의미한다.
연구지역의 RVNI 분석결과, 하천을 중심으 로 가시박, 돼지풀, 단풍잎돼지풀, 미국쑥부쟁 이, 가시상추, 애기수영이 공통적으로 분포하여 RVNI가 5∼7으로 나타났으며 하천에서 거리가 멀어질수록 RVNI는 낮아지는 경향을 보였다.
따라서 연구지역에서 하천 주변이 생태계교란 식물에 가장 취약한 지역으로 분석되었고, 산림 은 상대적으로 취약하지 않은 것으로 분석되었 다. 다만 서울, 구리, 안양, 과천, 의정부, 양주,
하남일대 산림의 RVNI는 1로 분석되었는데 이 는 연구대상 생태계교란식물 중에서 유일하게 산림에 분포하는 서양등골나물의 분포지역이기 때문이다(Figure 3).
② 지방자치단체의 R 분석
생태계교란식물의 RVNI가 1 이상 지역은 7 개 생태계교란식물 중 1종 이상의 식물이 분포 하거나 잠재적인 분포지역임을 의미한다. 따라 서 RVNI가 1 이상 지역은 생태계교란식물의 취 약지역으로 평가할 수 있으며 R에 따라 지방자 치단체별 취약지역의 분포를 상대적으로 비교 할 수 있다.
R이 가장 높은 지역은 구리시로 84.9%의 값 을 나타내었다. 광명시, 서울특별시, 과천시, 성 남시, 안양시 등은 70∼78%, 군포시, 하남시, 양 주시, 시흥시 고양시는 60∼64%, 부천시, 오산 시 의왕시, 남양주시, 광주시는 50∼60%, 동두 천시, 포천시, 용인시, 이천시, 수원시, 파주시는 40∼50%, 안산시, 화성시, 연천군, 여주시, 김포 시, 안성시 등은 30∼40%로 분석되었다. 반면, Table 4. Estimates of relative contributions of the environmental variables to the Maxent model.
(Sa) Sicyos angulatus, (Atr) Ambrosia trifida var. trifida, (Aa) Ambrosia artemisiifolia, (Ap) Aster pilosus, (Ra) Rumex acetosella, (Ls) Lactuca scariola, (Er) Eupatorium rugosum
Species
Variables Sa Atr Aa Ap Ra Ls Er
dem 5.5 15.6 9.1 15.5 7.5 1.8 2.7
Slope 4.5 2.6 0.9 3.1 2.5 5.5 1.7
Aspect 5.7 1.5 1.1 1.0 8.8 0.7 2.7
dfw 21.6 8.0 12.8 8.4 19.4 18.3 2.0
forest 12.6 25.2 40.8 30.5 2.5 38.8 25.2
road 2.9 3.6 0.9 2.6 11.3 2.9 7.2
taxgwrb 2.4 22.9 20.2 19.4 7.8 9.0 12.6
soilph 0.6 5.7 0.7 4.2 0.5 0.1 1.9
landc 10.9 11.8 8.7 13.0 27.5 11.9 19.0
ndvi 32.4 3.1 4.7 2.4 12.2 10.9 24.9
R이 가장 낮은 지역은 26.5%의 가평군으로 분 석되었다(Figure 4).
각 지방자치단체별로 단풍잎돼지풀, 돼지풀,
가시박, 애기수영 등이 공통적으로 출현하며 R 이 가장 높은 구리시를 포함하여 광명시, 서울 특별시, 과천시, 성남시, 안양시, 의왕시, 군포시, Figure 2. Probability distribution of invasive alien plants.
(A) Ambrosia artemisiifolia, (B) Ambrosia trifida var. trifida, (C) Aster pilosus,
(D) Eupatorium rugosum, (E) Lactuca scariola, (F) Sicyos angulatus, (G) Rumex acetosella
하남시 등은 산림을 서식처로 하는 서양등골나 물의 취약지역으로 R이 상대적으로 높았다. 반 면 R이 가장 낮은 가평군은 생태계교란식물이 분포 확률이 낮은 산림의 분포 비율이 상대적으 로 많기 때문에 R이 낮은 것으로 분석되었다.
IV. 결 론
본 연구는 생태계교란식물 분포지역의 취약 성 평가를 위한 환경지표 개발을 목적으로 하였 으며, 공간적 통계기법에 의해 환경지표(RVNI) 를 개발하고 서울 및 경기도를 대상으로 적용하 였다. 연구지역 중은 하천 주변의 RVNI가 높게 나타났으며 이는 하천 및 하천 주변지역이 생태 계교란식물에 취약한 지역임을 의미한다. 많은 지방자치단체에서 하천을 대상으로 생태하천 복원, 하천 정비 및 생태계교란생물 제거사업을 시행하고 있지만 생태계교란식물의 확산을 근
Figure 4. RVNI rate(R) of municipalities in the study area.
Figure 3. Map of RVNI in the study area.
본적으로 해결하지 못하고 있다. 이는 소규모 단위로 시행되는 생태계교란식물의 확산 대책 이 효율적이지 못하다는 것으로 의미한다. 식물 은 다양한 방법으로 종자를 확산하는데 소규모 지역 단위로 제거 계획을 수립한다 하더라도 외 부에서 유입되는 생태계교란식물의 종자 유입 을 물리적으로 제어할 방법이 현실적으로 존재 하지 않기 때문이다. 최근 생태계교란식물인 가 시박의 성장을 물리적으로 억제하는 방법이 연 구되고 있지만(Kang, 2014)이 또한 한시적인 방 법인 것으로 판단된다. 생태계교란식물의 확산 방지 및 제거 대책은 각 식물의 생리생태를 반 영한 방제법 개발과 거시적인 정책적 접근이 필 요하며, 본 연구의 결과는 거시적 측면에서 생 태계교란식물 관리를 위한 의사결정 도구로 충 분히 활용 가능할 것으로 판단된다.
본 연구 과정에서 생태계교란식물의 출현 자 료는 지방자치단체별로 균일하게 수집하려고 노력하였으나 인력 및 연구비의 한계로 지역별 편향이 발생할 수 있는 한계점이 있다. 그러므 로 지속적으로 종 출현 자료의 수집하고 평가지 표를 수정하는 연구의 유연성이 인정될 필요가 있다. 또한 본 연구 결과를 기초로 하여 식물뿐 아니라 곤충, 어류 등 생태계교란생물의 전반적 인 취약지역 평가가 수행된다면 환경보전을 위 한 정책 결정 및 환경영향평가에 사용할 수 있 는 환경지표가 될 수 있을 것이다. 그리고 기후 변화 시나리오에 의한 미래 취약성 평가가 진행 된다면 기후변화 적응 대책 수립을 위한 중요한 자료가 될 것으로 기대한다.
References
Austin, M. 2007. Species distribution models and ecological theory: a critical assessment and some possible new approaches. Ecological modelling. 200(1): 1-19.
Betts, M. G.․A. W. Diamond․G. J. Forbes․M.
A. Villard and J. S. Gunn. 2006. The importance of spatial autocorrelation, extent and resolution in predicting forest bird occurrence. Ecological modelling. 191(2):
197-224.
Bockstaller, C. and P. Girardin. 2003. How to validate environmental indicators. Agricultural systems. 76(2): 639-653.
Broxton, P. D.․X. Zeng․W. Scheftic and P. A.
Troch. 2014. A MODIS-based global 1-km Maximum Green Vegetation Fraction dataset.
Journal of Applied Meteorology and Climato- logy. 53(8): 1996-2004.
Brown, J. L. 2014. SDMtoolbox: a python-based GIS toolkit for landscape genetic, bio- geographic and species distribution model analyses. Methods in Ecology and Evolution.
5(7): 694-700.
CBD. 2008. CBD-Convention on Biological Diversity. Alien Species that Threaten Ecosystems, Habitats or Species [Article 8(h)]. United Nations.
Cloquell-Ballester, V. A.․V. A. Cloquell- Ballester․R. Monterde-Diaz and M.
Csantamarina-Siurana. 2006. Indicators vali- dation for the improvement of environmental and social impact quantitative assessment.
Environmental Impact Assessment Review.
26(1): 79-105.
Cousins S. A. and R. Lindborg. 2004. Assessing changes in plant distribution patterns- indicator species versus plant functional types. Ecological Indicators. 4(1): 17-27.
Dormann, C. F. 2007. Effects of incorporating spatial autocorrelation into the analysis of species distribution data. Global ecology and biogeography. 16(2): 129-138.
Elith, J. and J. R. Leathwick. 2009. Species
distribution models: ecological explanation and prediction across space and time. Annual Review of Ecology, Evolution, and Systematics 40(1): 677.
Elith, J.․S. J. Phillips․T. Hastie․M. Dudík․Y.
E. Chee and C. J. Yates. 2011. A statistical explanation of MaxEnt for ecologists.
Diversity and Distributions. 17(1): 43-57.
Franklin, J. 2010. Mapping species distributions:
spatial inference and prediction. Cambridge University Press.
Gurevitch, J. and D. K. Padilla. 2004. Are invasive species a major cause of extinctions?. Trends in Ecology & Evolution. 19(9): 470-474.
Hof, A. R.․R. Jansson and C. Nilsson. 2012. The usefulness of elevation as a predictor variable in species distribution modelling. Ecological Modelling, 246: 86-90.
Hosmer Jr, D. W. and S. Lemeshow. 2004. Applied logistic regression. John Wiley & Sons.
IUCN. 2011. IUCN-International Union for Con- servation of Nature. Invasive Species.
Jobbágy E. G. and R. B. Jackson. 2001. The distribution of soil nutrients with depth: global patterns and the imprint of plants. Bio- geochemistry. 53(1): 51-77.
Kettunen, M.․P. Genovesi․S. Gollasch․S.
Pagad․U. Starfinger․P. Ten Brink and C.
Shine. 2008. Technical support to EU strategy on invasive species (IAS)-Assessment of the impacts of IAS in Europe and the EU (final module report for the European Commission).
Institute for European Environmental Policy (IEEP). Brussels. Belgium. pp. 43.
Kang, B. H. 2014. Development of environmentally- friendly control of Burcucumber. Korea Environmental Industry & Technology Insti- tute Technical Reports[403-112-003].
Kil, J. H.․K. C. Shim․S. H. Park․K. S. Koh․
M. H. Suh․Y. B. Ku and H. Y. Kong. 2004.
Distributions of Naturalized Alien Plants in South Korea 1. Weed Technology. 18(sp1):
1493-1495.
Liu, C.․M. White and G. Newell. 2013. Selecting thresholds for the prediction of species occurrence with presence-only data. Journal of Biogeography 40(4): 778-789.
McCormack, J. E.․A. J. Zellmer and L. L.
Knowles. 2010. Does niche divergence accompany allopatric divergence in Aphelo- coma jays as predicted under ecological speciation?: insights from tests with niche models. Evolution. 64(5): 1231-1244.
Merow, C.․M. J. Smith and J. A. Silander. 2013.
A practical guide to MaxEnt for modeling species’ distributions: what it does, and why inputs and settings matter. Ecography. 36(10):
1058-1069.
Mooney, H. A. 2005. Invasive alien species: a new synthesis(Vol. 63). Island press.
Naimi, B.․A. K. Skidmore․T. A. Groen and N. A. Hamm. 2011. Spatial autocorrelation in predictors reduces the impact of positional uncertainty in occurrence data on species distribution modelling. Journal of Bio- geography. 38(8): 1497-1509.
NIER. 2007. Monitoring of invasive alien species designated by the wild life protection act.
National Institute of Environmental Research.
(in Korean)
NIER. 2008. Monitoring of invasive alien species designated by the wild life protection act(Ⅱ).
National Institute of Environmental Research.
(in Korean)
NIER. 2009. Monitoring of invasive alien species designated by the wild life protection act(Ⅲ).
National Institute of Environmental Research.
(in Korean)
NIER. 20010. Monitoring of invasive alien species designated by the wild life protection act(Ⅳ).
National Institute of Environmental Research.
(in Korean)
NIER. 2011. Monitoring of invasive alien species designated by the wild life protection act(Ⅴ).
National Institute of Environmental Research.
(in Korean)
NIER. 2012. Monitoring of invasive alien species designated by the wild life protection act(Ⅵ).
National Institute of Environmental Research.
(in Korean)
NIER. 2013. Monitoring of invasive alien species designated by the wild life protection act(Ⅶ).
National Institute of Environmental Research.
(in Korean)
Pearson, R. G.․C. J. Raxworthy․M. Nakamura and A. Townsend Peterson. 2007. Predicting species distributions from small numbers of occurrence records: a test case using cryptic geckos in Madagascar. Journal of Biogeo- graphy. 34(1): 102-117.
Perrings, C.․Dehnen-Schmutz, K.․Touza, J.․
Williamson, M. (2005). How to manage bio- logical invasions under globalization. Trends in ecology & evolution, 20(5): 212-215.
Phillips, S. J.․R. P. Anderson and R. E. Schapire.
2006. Maximum entropy modeling of species geographic distributions. Ecological modelling.
190(3): 231-259.
Phillips, S. J. and M. Dudík. 2008. Modeling of species distributions with Maxent: new extensions and a comprehensive evaluation.
Ecography 31(2): 161-175.
Pimentel, D. (Ed.). 2011. Biological invasions:
economic and environmental costs of alien
plant, animal, and microbe species. CRC Press.
Pimentel, D.․S. McNair․J. Janecka․J.
Wightman․C. Simmonds,․C. O’Connell․
E. Wong․L. Russel․J. Zern․T. Aquino and T. Tsomondo. 2001. Economic and environmental threats of alien plant, animal, and microbe invasions. Agriculture, Eco- systems & Environment. 84(1): 1-20.
Thuiller, W. 2003. BIOMOD-optimizing predictions of species distributions and projecting poten- tial future shifts under global change. Global change biology. 9(10): 1353-1362.
Sala, O. E.․F.S. Chapin III․J. J. Armesto․E.
Berlow․J. Bloomþeld․R. Dirzo․E. Huber- Sanwald․L. F. Huenneke․R. B. Jackson․
A. Kinzig․R. Leemans․D. M. Lodge․H.
A. Mooney․M. Oesterheld․N. L. Poff․
M. T. Sykes․B. H. Walker․M. Walker and D. H. Wall. 2000. Global biodiversity scenarios for the year 2100. Science. 287(5459):
1770-1774.
Segurado, P.․M. B. Araújo and W. E. Kunin.
2006. Consequences of spatial autocorrelation for niche-based models. Journal of Applied Ecology. 43(3): 433-444.
Swets, J. A. 1988. Measuring the accuracy of diagnostic systems. Science. 240(4857):
1285-1293.
Van Wilgen, B. W.․D. M. Richardson․D. C.
Le Maitre․C. Marais and D. Magadlela.
2001. The economic consequences of alien plant invasions: Examples of impacts and approaches to sustainable management in South Africa. Environment, Development and Sustainability. 3(2): 145-168.
Van Wilgen, B. W.․B. Reyers․D. C. Le Maitre․
D. M. Richardson and L. Schonegevel. 2008.
A biome-scale assessment of the impact of invasive alien plants on ecosystem services in South Africa. Journal of Environmental Management. 89(4): 336-349.
Veloz, S. D. 2009. Spatially autocorrelated sampling falsely inflates measures of accuracy for presence-only niche models. Journal of Biogeography. 36(12): 2290-2299.
Warren, D. L. and S. N. Seifert. 2011. Ecological
niche modeling in Maxent: the importance of model complexity and the performance of model selection criteria. Ecological Appli- cations. 21(2): 335-342.
Wilcove, D. S.․D. Rothstein․J. Dubow․A.
Phillips and E. Losos. 1998. Quantifying threats to imperiled species in the United States. BioScience. 48(8): 607-615.