• 검색 결과가 없습니다.

Determination of Optimum Threshold for Accuracy of People-counting System Based on Motion Detection

N/A
N/A
Protected

Academic year: 2021

Share "Determination of Optimum Threshold for Accuracy of People-counting System Based on Motion Detection"

Copied!
6
0
0

로드 중.... (전체 텍스트 보기)

전체 글

(1)

Determination of Optimum Threshold for Accuracy of People-counting System Based on Motion Detection

Hanseul Ryu*, Junho Song*, Boram Lee**, and Kiyoung Lee**

,

***

*Intern program, Built Environment Science and Technology Laboratory, Graduate School of Public Health, Seoul National University

**Department of Environmental Health Graduate School of Public Health, Seoul National University

***Institute of Health and Environment, Seoul National University

ABSTRACT

Objectives: A people-counting system measures real-time occupancy through motion detection. Accurate people- counting can be used to calculate suitable ventilation demands. This study determined the optimum motion threshold for a people-counting system.

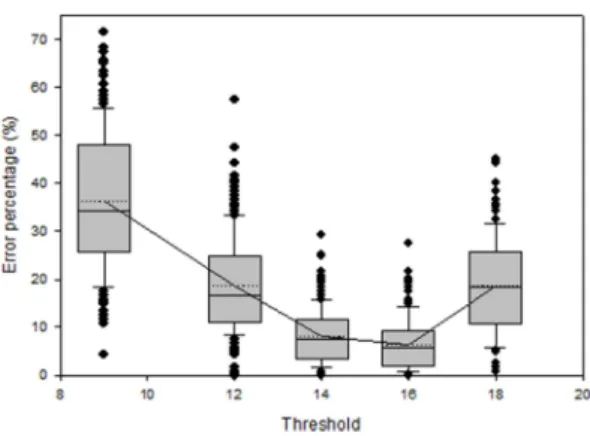
Methods: In a closed room with two occupants moving constantly, different thresholds were tested for the accu- racy of a people-counting system. The experiments were conducted at 150, 300, 450 and 600 lux. These levels of brightness included the illumination levels of most public indoor areas. The experiments were repeated with three types of clothing coloration.

Results: Overall, a threshold of 16 provided the lowest mean error percentage for the people-counting system.

Brightness and clothing color did not have a significant impact on the results.

Conclusion: A people-counting system could be used with threshold of 16 for most indoor environments.

Keywords: Accuracy test, environmental health service, IAQ management, motion detection, people counting

I. Introduction

Maintenance of proper indoor environmental quality (IEQ) in buildings requires high efficiency of ventilation.

1,2)

Various studies have shown that carbon dioxide concentration provides the most precise measure of IEQ, since CO

2

is closely associated with occupant density.

3,4)

Therefore, the most widely studied form of demand controlled ventilation (DCV) was based on CO

2

.

5-9)

DCV can conserve energy by adjusting the ventilation rate based on actual need. However, due to variables such as air circulation in multi-room buildings and gas dissipation rate, CO

2

concentration was often not an exact indicator for ventilation demand in a specific area.

10-15)

For better efficiency of DCV, a people-counting

system was proposed to determine the real-time ventilation rate. Appropriate ventilation rate could be calculated by CO2 emission rate per person, if number of resident can be measured. Therefore, a people-counting system can provide most efficient ventilation rate instantly. In addition, ventilation can be operated only when there are people in the space.

Such demand controlled ventilation system can provide clean air with less energy consumption.

However, there is no automatic people-counting system available.

For DCV, a people-counting system was developed to directly measure real-time occupancy in closed areas through motion detection. It provided a rapid calculation of ventilation demand in a certain location. Various factors, including brightness of the area and clothing color of occupants, could influence

Corresponding author: Department of Environmental Health Graduate School of Public Health, Seoul National University, Seoul, 151-742, Korea, Tel: +82-2-880-2836, E-mail: [email protected]

Received: 6 July 2015, Revised: 19 September 2015, Accepted: 25 September 2015

원 저 Original articles

(2)

the system’s counting ability. This study determined the most accurate value of motion threshold and analyzed the impact of variables on the people- counting system’s accuracy.

II. Method

The specifications of the people-counting system are shown in Table 1. The people-counting system was based on Linux Kernel 3.10 operating system with CPU (central processing unit) of Prescale MX51 Dual Core Cortex A9 1.2 Ghz. The software of the system had 1 GB of memory

DDR3 (double data rate type three) and 32 GB of storage (SD card). It had Ethernet network transmitting at 10 and 100 Mbps (Megabits per second). The hardware of the system contained four USB 2.0 ports that were each used for keyboard, mouse, camera, and USB flash drive connection. It contained two HDMI ports, one of which was used for monitor connection. The camera connected to the system had a part name of OV7725, interface of USB, frame rate of 60 fps (frames per second), and image sensor of 0.3 Mega pixels with 180° wide field-of-view.

The performance test of the motion-sensing camera was conducted in a small room of approximately 22.88 m

3

volume (width: 3.35 m, length: 2.53 m, height: 2.70 m). The camera was installed on the ceiling at an angle that covered the entire space of the room. Two people participated in this test: one 173 cm male and one 162cm female.

The experiment was performed under four different degrees of brightness: 150, 300, 450, and 600 lux.

The brightness of the room was controlled by the number of fluorescent tubes, with one fluorescent tube equal to approximately 150 lux. Other light sources that could possibly affect the brightness of the room was completely blocked out by attaching black cardboard paper on the door window (the room did not have any other windows).

The second variable was the color of clothes worn by participants: light-colored (Male: White Top &

Table 1. People-counting system specifications Part Specification

CPU Prescale MX51 Dual Core Cortex A9 1.2 Ghz

Memory DDR3 1 GB

Storage (SD Card) 32 GB

USB Port USB 2.0, 4 Port

HDMI 2 Port

Ethernet 10/100

Camera

Part Name: OV7725 Interface: USB Frame Rate: 60 fps Image Sensor: 0.3 Mega Pixel, 180°

Wide View

OS Linux Kernel 3.10

Table 2. The detected number of people according to the brightness and clothing color

Lux-clothing color Threshold value

9 12 14 16 18

150-light 2.7±0.1 2.4±0.2 2.1±0.1 1.8±0.1 1.7±0.1

150-medium 2.3±0.1 2.1±0.1 1.9±0.1 1.7±0.1 1.3±0.1

150-dark 3.0±0.2 2.5±0.1 2.2±0.1 1.8±0.1 1.6±0.1

300-light 3.1±0.1 2.7±0.2 2.2±0.1 1.9±0.04 1.9±0.04

300-medium 2.7±0.1 2.3±0.2 2.2±0.03 2.0±0.1 1.4±0.1

300-dark 3.0±0.1 2.4±0.1 2.4±0.1 2.0±0.1 1.7±0.1

450-light 2.7±0.3 2.3±0.1 2.1±0.1 2.0±0.02 1.8±0.1

450-medium 2.6±0.1 2.2±0.1 1.9±0.1 1.9±0.1 1.5±0.03

450-dark 2.5±0.1 2.3±0.1 2.1±0.1 2.0±0.1 1.6±0.1

600-light 2.8±0.2 2.3±0.1 2.2±0.1 2.1±0.1 2.0±0.1

600-medium 2.6±0.1 2.3±0.1 2.1±0.04 1.9±0.03 1.6±0.1

600-dark 2.8±0.2 2.5±0.2 2.1±0.1 1.8±0.1 1.7±0.1

(3)

Blue Bottom, Female: White Top & Black Bottom), medium-colored (Male: Red Top & Beige Bottom, Female: Blue Top & Indigo Bottom), and dark- colored (Male: Black Top & Gray Bottom, Female:

Gray Top & Beige Bottom). After setting the variables, the following motion threshold values were tested: 9 (default value), 12, 14, 16 and 18 (only for experiments with 600 lux and light-colored clothes). In total, 12 experiments were repeated for each threshold to determine the optimum value of the people-counting system (4 degrees of brightness, 3 types of clothing color).

The performance test was carried out by walking at a steady pace around the room in a circle (clockwise/anticlockwise). Each experiment lasted 15 minutes. 1-minute averages of detected occupant number were calculated and compared to the actual occupant number (2) to calculate the 1-minute error percentage

(1)

Error percentages were plotted on a box plot graph using SigmaPlot 10.0 (Systat Software Inc., Chicago, IL, USA). The mean of 1-minute error percentages for each experiment was compared on a line graph.

III. Results

The mean counted people over 15minutes ranged from 2.5 to 3.1 for threshold 9, 2.2 to 2.7 for threshold 12, 1.9 to 2.4 for threshold 14, 1.8 to 2.1 for threshold 16 and 1.6 to 2.0 for threshold 18. The mean counted people over 15minutes ranged from 1.7 to 2.8 for light color clothing, 1.3 to 2.7 for medium color clothing, 1.6 to 3.0 for dark color clothing. When the threshold value was 16, number of detected people was close to actual value of two (Table 2).

Fig. 1 shows the 1-minute error percentages of each threshold acquired from all 12 experiments.

The optimum threshold value for the people- counting system was 16. The error percentages of threshold 16 ranged from 0% to 27.5% with an average of 6.44%±5.23%. The error percentage was the highest at threshold 9 with an average of 36.30%±14.36%. It decreased steadily as the

threshold increased until the minimum was reached at threshold 16. The error increased again at threshold 18.

Fig. 2 shows the means of 1-minute error percentages by brightness and clothing color. In every experimental condition, the mean decreased from its highest point at threshold 9 and reached the minimum at a value between 12 and 18. The optimum threshold values for light-colored, medium-colored, and dark-colored clothes were: 18, 14, and 14 in 600 lux; 16, 14, and 16 in 450 lux;

16, 16, and 16 in 300 lux; 14, 12, and 16 in 150 lux. Although the optimum thresholds by brightness and clothing color were not always 16, the difference was relatively small. For 600 lux, threshold 18 showed a mean percentage of 4.83%, which was 0.56% lower than that of threshold 16, when the occupants wore light-colored clothes. For medium and dark-colored clothes, threshold 14 (4.11% and 5.94%, respectively) was 1.06% and 2.56% more accurate than threshold of 16. For 450 lux and medium-colored clothes, the mean percentage for threshold 14 (5.39%) was 0.61%

lower than that of 16. Threshold of 16 was the

optimum threshold in 450 lux for light (3.33%) and

dark-colored clothes (5.33%). For 300 lux, 16 was

Fig. 1. Change in 1-minute error percentage of people-

counting system by threshold. The box represents

data from the 25

th

to 75

th

percentile, and the solid

line of each box marks the median. Error bars

below and above the boxes stand for the 10

th

and

90

th

percentile. All individual plots outside of the

boxes are outliers. The dotted line within the

boxes stands for mean of 1-minute error

percentages.

(4)

the optimum threshold for all types of clothing color (light: 4.61%, medium: 3.50%, dark: 3.44%). For 150 lux, threshold 14 (5.61%) was 3.33% more accurate than threshold 16 in light-colored clothes, and 12 (9.22%) was 4.89% more accurate than threshold of 16 in medium-colored clothes. When the occupants wore dark clothes, the optimum threshold was 16, showing a mean error percentage of 8.89%.

IV. Discussion

Overall, threshold 16 should be used for the people-counting system. Low thresholds values of 9 and 12 resulted in high error percentages, probably because of a large red circle counted as 1 additional person on the camera monitor. These thresholds were too sensitive to human motion. When the threshold exceeded 16, the system was not able to

detect motion that occurred relatively far away from the motion-sensing camera. The lowest 1-minute people-count average for threshold 18 was 1.45 people, resulting in the 1-minute error percentage of 27.50%

The relatively small influence of brightness and clothing color on the trend of 1-minute error percentages implied that the results could be applied to a wide range of indoor areas. Although the optimum threshold value ranged from 12 to 18 in a few specific situations, 16 remained the first or second most accurate threshold value. The largest difference between the mean error percentages of the optimum threshold and threshold 16 was 4.89% with 150 lux and medium colored clothing).

The people-counting system can be used with

threshold 16 for any indoor environment with the

illumination level from 150 to 600 lux. According

Fig. 2. Average error percentages by threshold with different brightness and clothing color.

(5)

to IESNA (Illuminating Engineering Society of North America), the brightness of most indoor areas, including living areas and educational spaces, ranges from 300 to 400 lux

16)

. Dim locations, such as hotel dining areas, only require 100 lux.

Recommendations for hotel kitchens and simple examination rooms in hospitals reach up to 500 lux.

The illumination levels exceed 600 lux only for medical treatment rooms or industrial areas involving difficult assembly. Therefore, the illumination range of the present study included most public areas.

As a limitation of the study, populations larger than 2 occupants were not tested. Data regarding varying occupant population would be helpful in confirming the accuracy of the optimum threshold value. In addition, it is possible that a different camera angle or room of a different size could change error percentage values. However, the 12 experiments of this study for each threshold prove that a people-counting system with threshold 16 can accurately calculate the ventilation demand of most indoor areas.

V. Conclusion

In this study, the optimum threshold value for the people-counting system was determined to be 16.

Brightness of the room and clothing colors of the occupants did not significantly impact the accuracy of the people-counting system with threshold of 16.

The system of detecting real-time occupancy through motion detection could provide a accurate calculation of ventilation demand in the most indoor areas.

Acknowledgement

This research was supported by Social Service R&D research (No. 900-20130073) of Ministry of Health & Welfare.

References

1. R. Cantin, A. Kindinis, P. Michel. New approaches for overcoming the complexity of future buildings impacted by new energy constraints. Futures 2012;

44: 735-745.

2. L. Pérez-Lombard, J. Ortiz, C. Pout. A review on buildings energy consumption information. Energy and Buildings 2008; 40: 394-398.

3. M. Ng, M. Qu, P. Zheng, Z. Li, Y. Hang. CO

2

- based demand controlled ventilation under new ASHRAE Standard 62.1-2010: a case study for a gymnasium of an elementary school at West Lafayette, Indiana. Energy and Buildings 2011; 43:

11, 3216-3225.

4. A. Rackes, M. Waring. Modeling impacts of dynamic ventilation strategies on indoor air qual- ity of offices in six US cities. Building and Envi- ronment 2013; 60: 243-253.

5. S. Emmerich, A. Persily. State-Of-The-Art Review of CO

2

Demand Controlled Ventilation Technol- ogy and Application, NISTIR 6729. National Insti- tute of Standards and technology (2001).

6. X. Lin, J. Lau. Demand controlled ventilation for multiple zone HVAC systems: CO

2

-based dynamic reset (RP 1547). HVAC&R Research 2014; 20: 8, 875-888.

7. T. Lu, X. Lü, M. Viljanen. A novel and dynamic demand-controlled ventilation strategy for CO

2

control and energy saving in buildings. Energy and Buildings 2011; 43:9, 2499-2508.

8. N. Nassif. A robust CO

2

-based demand-controlled ventilation control strategy for multi-zone HVAC systems. Energy and Buildings 2012; 45: 72-81.

9. Z. Sun, S. Wang, Z. Ma. In-situ implementation and validation of a CO

2

-based adaptive demand- controlled ventilation strategy in a multi-zone office building. Building and Environment 2011;

46: 1, 124-133.

10. D. Cali, P. Matthes, K. Huchtemann, R. Streblow, D. Müller. CO

2

based occupancy detection algo- rithm: Experimental analysis and validation for office and residential buildings. Building and Envi- ronment 2015; 86: 39-49.

11. Demetriou, D. and H. Khalifa. Evaluation of dis- tributed environmental control systems for improv- ing IAQ and reducing energy consumption in office buildings. Building Simulation 2009; 2:3, 197-214.

12. T. Labeodan, W. Zeiler, G. Boxem, Y. Zhao. Occu- pancy measurement in commercial office build- ings for demand-driven control applications—A survey and detection system evaluation. Energy and Buildings 2015; 93: 303-314.

13. M. Mysen, S. Berntsen, P. Nafstad, P. Schild.

Occupancy density and benefits of demand-con- trolled ventilation in Norwegian primary schools.

Energy and Buildings 2015; 37: 12, 1234-1240.

14. E. Naghiyev, M. Gillott, R. Wilson. Three unob-

(6)

trusive domestic occupancy measurement technol- ogies under qualitative review. Energy and Buildings 2014; 69: 507-514.

15. S. Wang, J. Burnett, H. Chong. Experimental val- idation of CO

2

- based occupancy detection for

demand-controlled ventilation. Indoor Built Envi- ronment 1999; 8: 6, 377-391.

16. IESNA 9th Edition Handbook, Illuminating Engi-

neering Society of North America (2010).

수치

Table 2. The detected number of people according to the brightness and clothing color
Fig. 1 shows the 1-minute error percentages of each threshold acquired from all 12 experiments.

참조

관련 문서

1 John Owen, Justification by Faith Alone, in The Works of John Owen, ed. John Bolt, trans. Scott Clark, "Do This and Live: Christ's Active Obedience as the

at the Specific Conditions of Sputtering Power in the Preparation of CoSi 2 Thin Films by Using the Sputtering Method ……… 88 Fig.. 44 Carrier Concentration and Mobility of the

First, analyzing the difference of enjoyment factor based on demographic attributes of elderly sport for all program’s participant and by its gender, the

3 Mean percentages of bone implant contact ratio in the control group and experimental groups at 6 and 12 weeks after placement of the

Second, in the results of examining the difference in the cognition, preference and demand for the clothing chapter of the Middle School’s Technology and Home Economics

This study focuses on the energy-related legal system of Australia and examines (1) the general regulatory framework of energy industries, (2) the management and oversight

→ For the turbulent jet motion and heat and mass transport, simulation of turbulence is important.. in the mean-flow equations in a way which close these equations by

In the proposed method, the motion of focused object and the background is identified and then the motion vector information is extracted by using the 9